FabricPerf: Measuring NIC-less Scale-Up Network through GPU Communication Kernel ProfilingFabricPerf:以 GPU 通訊 kernel 剖析量測沒有 NIC 的 scale-up 網路
After reading, you can explain why NVLink has no NIC counters to read, how FabricPerf times transfers inside NCCL's kernels, and what its channel and L2 findings mean for tuning.讀完後,你能說明為什麼 NVLink 沒有 NIC 計數器可讀、FabricPerf 如何在 NCCL 的 kernel 內為傳輸計時,以及它對 channel 與 L2 的發現對調校有什麼意義。
Inside an NVLink domain, a GPU sends data by storing it into another GPU's memory. No NIC is on the path, so there are no NIC queues, hardware timestamps or PTP clocks; tools saw only kernel durations and NVLink byte counts. FabricPerf profiles the network as GPU code. Probes on three instructions in NCCL's kernels give five timestamps per transfer, a PTP variant made of 128-bit stores aligns the GPU clocks, and a memory-traffic model lets L2 counters explain the transfers. The testbeds were an H100 NVL8 and a GB200 NVL16; on the GB200, the clock offset jittered by 101.8 ns on average inside a kernel. Two findings followed. Channels finish unevenly (P99 about 2× P50), and work stealing raised AllGather from 316.9 to 334.4 GB/s. At high bandwidth, L2 misses almost every network-buffer access, and eviction hints raised ReduceScatter's read hit rate from 0.31% to 35.17%.
在 NVLink 網域內,GPU 送資料的方式是把資料 store 進另一顆 GPU 的記憶體。路徑上沒有 NIC,所以沒有 NIC 佇列、硬體時間戳或 PTP 時鐘;現有工具只看得到 kernel 執行時間與 NVLink 位元組計數。FabricPerf 把網路當成 GPU 程式來剖析。掛在 NCCL kernel 三個指令上的探針為每次傳輸給出五個時間戳;以 128 位元 store 組成的 PTP 變體對齊各 GPU 的時鐘;記憶體流量模型讓 L2 計數器能解釋這些傳輸。測試平台是 H100 NVL8 與 GB200 NVL16;在 GB200 上,kernel 內時鐘偏移的平均抖動是 101.8 ns。接著有兩項發現。channel 完成得不平均(P99 約為 P50 的 2 倍),work stealing 讓 AllGather 從 316.9 提高到 334.4 GB/s。在高頻寬下,L2 幾乎每次存取網路緩衝都失誤,eviction hint 把 ReduceScatter 的讀取命中率從 0.31% 提高到 35.17%。
Where this paper sits這篇論文的位置
Section 2.2 puts NVLink at 900 GB/s per H100, both directions (Panel 1 there); section 06 gives its latency only as a vendor figure, "about 1–2 µs". Section 03 shows that scale-out observability lives in the NIC, which monitors such as R-Pingmesh read. A scale-up fabric has no NIC (figure below). A store leaves the streaming multiprocessor (SM), crosses the crossbar, NVLink and NVSwitch, and lands in the peer's L2 or HBM. The transport is software: NCCL's kernels and their channels (Section 4.5). Nothing below the kernel duration had been measured.
第 2.2 節把 NVLink 定為每顆 H100 雙向 900 GB/s(見該頁面板 1);第 06 節只用廠商數字給出它的延遲:「約 1–2 µs」。第 03 節說明 scale-out 的可觀測性在 NIC 裡,R-Pingmesh 這類監測系統讀的就是它。scale-up 互連沒有 NIC(見下圖)。一次 store 離開串流多處理器(SM),穿過 crossbar、NVLink 與 NVSwitch,落在對方的 L2 或 HBM。傳輸層是軟體:NCCL 的 kernel 與它們的 channel(第 4.5 節)。比 kernel 總時間更細的東西,之前沒有人量過。
The problem, measured問題,用量測說明
The paper names three obstacles. Scale-up traffic comes from GPU threads, so the CPU, the operating system and eBPF never see it. NVLink and NVSwitch are closed parts with byte counters and no programmable interface. And the unit of transfer is a 16-byte store, not a 1,500-byte frame: NCCL needs 10,240 threads to fill NVLink at 350 GB/s on an H100 for send/recv. Threads form blocks on one SM, and one block is one channel. A header in every store would cost too much, so the protocol writes the data, then a fence, then one flag, the tailer. The fence holds later stores until the earlier ones are visible, so a receiver that sees the tailer knows that the data has landed.
論文列出三個障礙。scale-up 流量來自 GPU 執行緒,所以 CPU、作業系統與 eBPF 都看不到。NVLink 與 NVSwitch 是封閉元件,只有位元組計數器,沒有可程式化介面。而且傳輸單位是 16 位元組的 store,不是 1,500 位元組的訊框:在 H100 上做 send/recv 時,NCCL 需要 10,240 條執行緒才能把 NVLink 填到 350 GB/s。執行緒在一顆 SM 上組成 block,一個 block 就是一個 channel。在每個 store 裡加標頭太昂貴,所以協定先寫資料,再下 fence,最後寫一個旗標,稱為 tailer。fence 讓之後的 store 等到之前的 store 可見為止,所以接收端一看到 tailer,就知道資料已經到了。
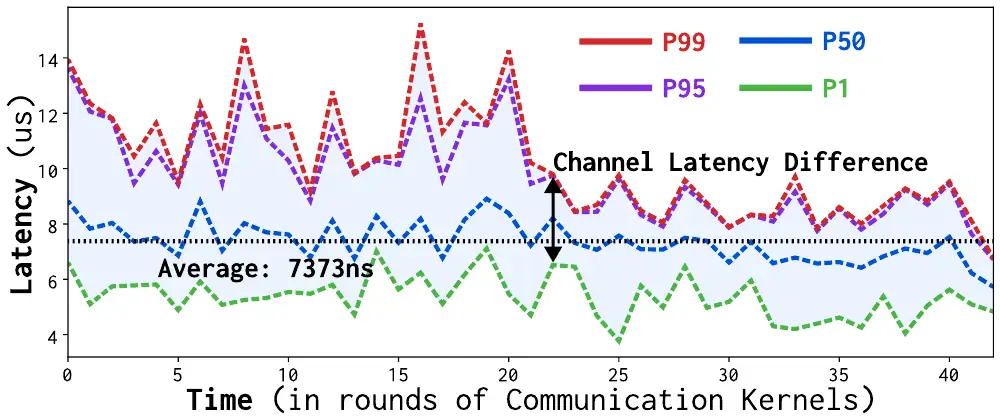
NVLink latency is often quoted as a constant "about 6 µs" (Demystifying NCCL, HOTI 2025). FabricPerf measured averages of 2–10 µs on the H100 and 5–13 µs on the GB200, depending on the collective and the channel and thread counts. The averages also hide a tail (figure below).
NVLink 的延遲常被說成固定的「約 6 µs」(Demystifying NCCL,HOTI 2025)。FabricPerf 量到的平均值在 H100 上是 2–10 µs、在 GB200 上是 5–13 µs,取決於集體操作以及 channel 與執行緒數。平均值也藏住了尾端(見下圖)。
The design設計
1. Five timestamps inside the communication kernel1. 通訊 kernel 內的五個時間戳
In one transfer (figure below, part B), the receiver writes CLEAR to say that its buffer is free. The sender spins until it sees CLEAR, copies the data, issues the fence and writes the tailer. The receiver spins until it sees the tailer and copies the data out. FabricPerf stamps T1 when CLEAR is issued, T2 when the sender sees it, T3 when the first store leaves the SM, T4 when the fence completes, and T5 when the receiver sees the tailer. The probes hook the first store (T1, T3), the branch of the spin loop (T2, T5) and the fence (T4).
在一次傳輸中(下圖 B 部分),接收端寫入 CLEAR,表示它的緩衝空出來了。發送端自旋等到看見 CLEAR,複製資料,下 fence,再寫 tailer。接收端自旋等到看見 tailer,再把資料複製出去。FabricPerf 在 CLEAR 發出時記下 T1、發送端看見它時記 T2、第一個 store 離開 SM 時記 T3、fence 完成時記 T4、接收端看見 tailer 時記 T5。探針掛在第一個 store(T1、T3)、自旋迴圈的分支指令(T2、T5)與 fence(T4)上。
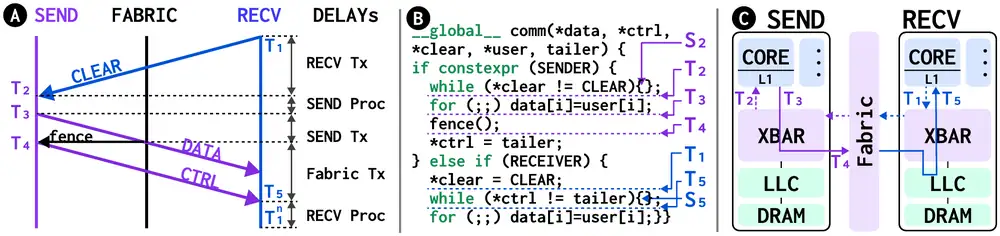
The fabric latency is , and throughput comes from counting arrivals per time bin. CLEAR comes first because no NIC buffer can absorb early data, like a congestion window of one. If the first poll already succeeds, the data arrived before the stamp, so the sample counts for throughput but not for latency. A "packet" here is one fence-delimited transfer of kilobytes to megabytes. The paper's 4 MB echo test shows where the time goes:
互連延遲是 ,吞吐量則由每個時間區間內 的到達次數算出。CLEAR 排在最前面,是因為沒有 NIC 緩衝能吸收提早到的資料,就像壅塞視窗等於 1。如果第一次輪詢就成功,資料其實在時間戳之前就到了,所以這個樣本算進吞吐量、不算進延遲。這裡的「封包」是一次以 fence 分隔、KB 到 MB 大小的傳輸。論文的 4 MB echo 測試顯示時間花在哪裡:
Shares, from Table 6:
各段占比(Table 6):
| Question問題 | Calculation算式 | Result結果 |
|---|---|---|
| H100: the whole echoH100:整個 echo | µs | |
| H100: share of the fabric (Fabr-TX)H100:互連(Fabr-TX)的占比 | ||
| H100: share of the fence (Send-TX)H100:fence(Send-TX)的占比 | ||
| H100: share of the two copiesH100:兩次複製的占比 | ||
| GB200 node: share of the fabricGB200 節點:互連的占比 |
So a 4 MB transfer is mostly memory copies, and the fabric takes 1–2%. The GB200's intra-node and inter-node segments match, as a fully connected switch layer predicts.
所以一次 4 MB 的傳輸大多是記憶體複製,互連只占 1–2%。GB200 的節點內與跨節點各段相同,正如全互連的單層交換所預期。
2. GPTP: one clock for all GPUs2. GPTP:讓所有 GPU 共用一個時鐘
T1 and T5 come from the receiver's clock and T2 to T4 from the sender's, and on the GB200 the raw clocks of different nodes differed by milliseconds to seconds. A GPU cannot use the NIC's PTP clock (one PCIe read takes about 1 µs), so the authors built GPTP. GPU 0 leads. It exchanges the four IEEE 1588 messages with each follower, after a handshake that makes sure the follower is already polling. Each message is one 128-bit store, delivered whole, and each side polls only its own memory. GPU clocks (32 ns steps) cannot change rate, so GPTP corrects only the offset . The paper does not print the formula; the IEEE 1588 one, with the send and receive times of Sync and those of Delay_Req, is
T1 與 T5 來自接收端的時鐘,T2 到 T4 來自發送端的時鐘;在 GB200 上,不同節點的原始時鐘相差數毫秒到數秒。GPU 無法使用 NIC 的 PTP 時鐘(一次 PCIe 讀取就要約 1 µs),所以作者做了 GPTP。由 GPU 0 擔任 leader。它與每個 follower 交換 IEEE 1588 的四種訊息,之前先以交握確認 follower 已經在輪詢。每則訊息是一個 128 位元的 store,會完整送達,而且每一端只輪詢自己的記憶體。GPU 時鐘(每步 32 ns)無法調整速率,所以 GPTP 只修正偏移 。論文沒有印出公式;IEEE 1588 的公式如下, 是 Sync 的送出與接收時間, 是 Delay_Req 的:
Inside a kernel the offset jittered by 101.8 ns on average. Between kernels it moved by about 36 µs, because node clocks drift by about 1.5 µs per run. So GPTP runs before every kernel, in 5–10 µs, or 1–2% of the communication time. The triangle error stayed at or below 364.6 ns.
在 kernel 內,偏移的平均抖動是 101.8 ns。在 kernel 之間它移動約 36 µs,因為各節點的時鐘每跑一次就漂移約 1.5 µs。所以 GPTP 在每個 kernel 之前都跑一次,花 5–10 µs,占通訊時間的 1–2%。三角誤差 都在 364.6 ns 以內。
3. The network as memory traffic3. 把網路當成記憶體流量
NVLink has almost no counters, but the GPU memory system has many: crossbar, DRAM and L2, read through CUPTI. A transfer at fabric bandwidth causes five memory flows (figure below): (1) the sender reads its source buffer and (2) writes across the fabric; (3) the writes land in the receiver's network buffer; (4) the receiver reads it and (5) writes to the user's destination buffer. The network buffer is reused in a cycle and should stay in L2. User buffers are touched once and should miss.
NVLink 幾乎沒有計數器,但 GPU 記憶體系統有很多:crossbar、DRAM 與 L2,可透過 CUPTI 讀取。以互連頻寬 進行的傳輸會引起五道記憶體流(見下圖):(1) 發送端讀取來源緩衝,(2) 跨互連寫出;(3) 寫入落在接收端的網路緩衝;(4) 接收端讀取它,(5) 再寫進使用者的目的緩衝。網路緩衝循環重複使用,應留在 L2。使用者緩衝只碰一次,應該失誤。
Table 2 of the paper gives the expected traffic and the ideal L2 hit rates for SendRecv (SR), SendRecv with DMA-style buffers (DMA), AllGather (AG) and ReduceScatter (RS), with ranks:
論文 Table 2 給出 SendRecv(SR)、使用 DMA 式緩衝的 SendRecv(DMA)、AllGather(AG)與 ReduceScatter(RS)的預期流量與理想 L2 命中率, 是 rank 數:
| SR | DMA | AG | RS | |
|---|---|---|---|---|
| Reads讀取 | ||||
| Writes寫入 | ||||
| L2 read hitL2 讀取命中 | 1/2 | 0% | 100% | 1/2 |
| L2 write hitL2 寫入命中 | 2/3 | 1/2 | 2/3 | 100% |
DMA-style buffers (NCCL user-buffer registration) remove flows 4 and 5, but only for SendRecv and AlltoAll, because those flows also do the reduction. Across 4–32 channels, the predicted memory bandwidth matched the measured one within 6.86% on average.
DMA 式緩衝(NCCL 的使用者緩衝註冊)拿掉流 4 與流 5,但只適用於 SendRecv 與 AlltoAll,因為這兩道流也負責歸約。在 4–32 個 channel 之間,預測的記憶體頻寬與實測值平均相差 6.86%。
Implementation實作
FabricPerf is a plugin of Neutrino, the authors' tool that patches probes into GPU assembly, with MPI hooks for ranks and traces. Offline mode keeps the stamps in shared memory until the kernel ends, about 20 ns per stamp instead of 200+ ns. Online mode sends them in GPTP-format messages, so the receiver can use them inside the kernel. The code is open source; the paper gives no line count.
FabricPerf 是 Neutrino 的外掛;Neutrino 是作者把探針插進 GPU 組合語言的工具,另有處理 rank 與紀錄的 MPI 掛勾。離線模式把時間戳留在共享記憶體,等 kernel 結束才寫出,每個約 20 ns,而不是 200 ns 以上。線上模式以 GPTP 格式的訊息送出時間戳,讓接收端能在 kernel 內使用。程式碼已開源;論文沒有給行數。
What was measured量了什麼
The testbeds are an H100 NVL8 (one node, four NVSwitch chips, 900 GB/s per GPU in both directions) and a GB200 NVL16 (four 4-GPU nodes of an NVL72, 18 NVSwitch chips, 1.8 TB/s). The software is NCCL 2.28.9 and nccl-tests 2.17.0, running SendRecv, AllGather and ReduceScatter with the Ring algorithm. The knob is NCCL_CTAS, the channel count.
測試平台是 H100 NVL8(單一節點、四顆 NVSwitch 晶片、每顆 GPU 雙向 900 GB/s)與 GB200 NVL16(一套 NVL72 中的四個 4-GPU 節點、18 顆 NVSwitch 晶片、1.8 TB/s)。軟體是 NCCL 2.28.9 與 nccl-tests 2.17.0,以 Ring 演算法執行 SendRecv、AllGather 與 ReduceScatter。旋鈕是 NCCL_CTAS,也就是 channel 數。
Can the tool be trusted?這個工具可信嗎?
| Check (setup)檢查(設定) | Result結果 |
|---|---|
| Clock jitter inside a kernel (GB200 NVL16)kernel 內的時鐘抖動(GB200 NVL16) | 101.8 ns average平均 101.8 ns |
| Triangle error of the clocks (GB200 NVL16)時鐘的三角誤差(GB200 NVL16) | ns 106.45 ns average平均 106.45 ns |
| SendRecv throughput, FabricPerf / nccl-tests (H100, 1 GB; GB200, 2 GB)SendRecv 吞吐量,FabricPerf/nccl-tests(H100、1 GB;GB200、2 GB) | 366.37 / 360.67 698.18 / 690.20 GB/s |
| Overhead on the hot path (2.87 ms kernel; GPU not named)熱路徑上的額外負擔(2.87 ms 的 kernel;未註明 GPU) | +0.6% offline +8.9% online離線 +0.6% 線上 +8.9% |
Throughput is slightly above nccl-tests' because host overhead is left out. Only SendRecv's latency (6.862 µs on the H100) matched "about 6 µs"; ReduceScatter took 13.207 µs.
吞吐量略高於 nccl-tests,因為不含主機端的額外負擔。只有 SendRecv 的延遲(H100 上 6.862 µs)符合「約 6 µs」;ReduceScatter 花了 13.207 µs。
Channel imbalance, and work stealingchannel 不平衡與 work stealing
The tail of Figure 12 is not saturation. P95 and P99 leave P50 at 12 channels and about 200 GB/s (the paper's Figure 17), while the H100 saturates near 24 channels and 300+ GB/s. Channels map to SMs, not NVLink ports; the authors suspect port selection or scheduling in the hidden network layer but cannot confirm it. A collective ends with its slowest channel: the "slowest flow sets the pace" rule of ECMP in the Chapter 8, inside one GPU.
Figure 12 的尾端不是飽和造成的。P95 與 P99 在 12 個 channel、約 200 GB/s 時就離開 P50(論文 Figure 17),而 H100 要到約 24 個 channel、300 GB/s 以上才飽和。channel 對應的是 SM,不是 NVLink 埠;作者懷疑是看不見的網路層在選埠或排程上出問題,但無法證實。集體操作要等最慢的 channel 結束:這就是第 8 章中 ECMP「最慢的流決定節奏」的規則,只是發生在一顆 GPU 內。
The fix is work stealing in NCCL's device code. A channel that finishes increments a helper counter. If fewer than helpers are active and it was not robbed itself, it claims the channel with the least progress by an atomic compare-and-swap and moves that victim's end to
修正方法是在 NCCL 的 device 程式碼中做 work stealing。完成的 channel 把 helper 計數器加一。如果正在協助的 helper 少於 個,而且它自己沒有被接手,它就用原子 compare-and-swap 取得進度最少的 channel,並把對方的結束點移到
where is the steal fraction. The helper sends the chunks from there to ; the victim stops at its new end and waits for a helperDone flag. The paper does not report , or .
其中 是接手比例。helper 送出從該點到 的 chunk;被接手的 channel 停在新的結束點,等待 helperDone 旗標。論文沒有給出 、 或 的值。
On the H100, against the better of two stock kernels (Figure 13B):
在 H100 上,與兩種原始 kernel 中較好的那一種相比(Figure 13B):
| Metric指標 | Stock原始 | Work stealingwork stealing |
|---|---|---|
| SendRecv bus bandwidthSendRecv 匯流排頻寬 | 349.3 GB/s | 361.6 GB/s +12.3 |
| AllGather bus bandwidthAllGather 匯流排頻寬 | 316.9 GB/s | 334.4 GB/s +17.5 |
| SendRecv channel-finish spreadSendRecv 各 channel 完成時間差 | 1.91 ms | 1.03 ms −46% |
| AllGather channel-finish spreadAllGather 各 channel 完成時間差 | 0.35 ms | 0.24 ms −32% |
So the channel count is not a free bandwidth dial. Past about 12 channels on the H100, channels add tail as well as bandwidth, and evening out the tail gave AllGather about 5%. Section 4.5 explains what a channel holds.
所以 channel 數不是免費的頻寬旋鈕。在 H100 上超過約 12 個 channel 後,增加 channel 也會增加尾端;把尾端拉平,讓 AllGather 多了約 5%。第 4.5 節說明一個 channel 持有什麼。
The L2 cache loses the network buffersL2 快取留不住網路緩衝
The cache study ran on one 4-GPU GB200 node, because CUPTI hung across nodes. Hit rates came closest to Table 2 at low bandwidth: 8 channels or fewer, about 200 GB/s or less. At 16 or more channels and 350 GB/s or more, they fell to 15% or less, and to about 0% at 32 channels. With 32 channels, the default 4 MB buffers also gave about 0%, and smaller buffers recovered (figure below). Streaming user-buffer flows evict the network buffers before their reuse.
快取研究在 GB200 的單一 4-GPU 節點上進行,因為 CUPTI 跨節點時會卡住。在低頻寬下,也就是 8 個以下 channel、約 200 GB/s 以下時,命中率最接近 Table 2。在 16 個以上 channel、350 GB/s 以上時,命中率掉到 15% 以下,32 個 channel 時約為 0%。在 32 個 channel 下,預設的 4 MB 緩衝也只有約 0%,緩衝縮小後才回升(見下圖)。串流式的使用者緩衝流量在網路緩衝被重用之前就把它們逐出。
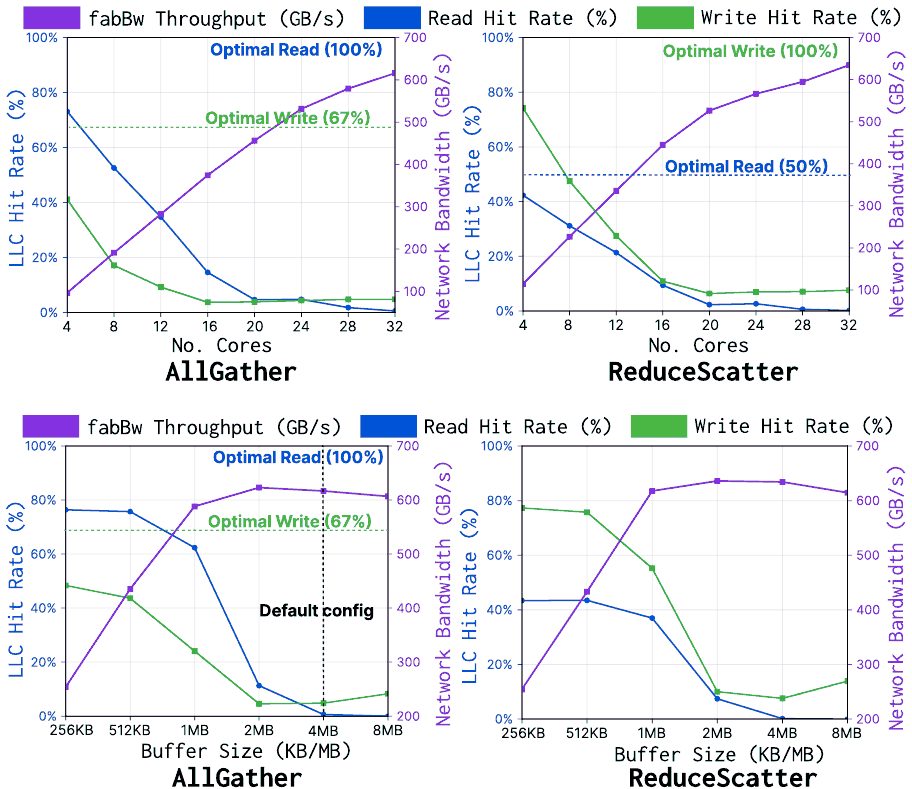
Our reading: both sweeps track the total buffer, channels × buffer size. The AllGather read hits are read off the plots, to about points:
我們的解讀:兩組掃描追蹤的都是緩衝總量,也就是 channel 數 × 緩衝大小。AllGather 的讀取命中率是從圖上讀出的,誤差約 個百分點:
| Setting設定 | Calculation算式 | Result結果 |
|---|---|---|
| 8 channels, 4 MB (Figure 14)8 個 channel、4 MB(Figure 14) | MBread hit ≈ 52%讀取命中 ≈ 52% | |
| 32 channels, 1 MB (Figure 15)32 個 channel、1 MB(Figure 15) | MBread hit ≈ 62%讀取命中 ≈ 62% | |
| 16 channels, 4 MB (Figure 14)16 個 channel、4 MB(Figure 14) | MBread hit ≈ 15%讀取命中 ≈ 15% | |
| 32 channels, 2 MB (Figure 15)32 個 channel、2 MB(Figure 15) | MBread hit ≈ 11%讀取命中 ≈ 11% | |
| The default: 32 channels, 4 MB預設:32 個 channel、4 MB | MBread hit ≈ 0%讀取命中 ≈ 0% |
Both sweeps fall off between 32 and 64 MB. The text calls 2 MB or less good, but the plot gives about 11% at 2 MB. Small buffers cost bandwidth: AllGather drops to about 260 GB/s at 256 KB, against about 620 GB/s at 2–4 MB.
兩組掃描都在 32 到 64 MB 之間崩落。正文說 2 MB 以下就好,但圖上 2 MB 只有約 11%。小緩衝會犧牲頻寬:256 KB 時 AllGather 掉到約 260 GB/s,2–4 MB 時則約 620 GB/s。
The second fix keeps the 4 MB buffers and sets cache priority with PTX hints: evict_first on the streaming flows 1 and 5 and on buffer loads 4 (the buffers are circular), and evict_last on buffer stores 2 and 3. Table 8 of the paper (one GB200 node, 2 GB):
第二種修正保留 4 MB 緩衝,改用 PTX hint 設定快取優先權:串流式的流 1、5 與緩衝 load(流 4,因為緩衝是環形的)設為 evict_first,緩衝 store(流 2、3)設為 evict_last。論文 Table 8(單一 GB200 節點、2 GB):
| Case情況 | Fabric GB/s互連 GB/s | L2 read hitL2 讀取命中 |
|---|---|---|
| ReduceScatter, stockReduceScatter,原始 | 632.717 | 0.31% |
| ReduceScatter, hintsReduceScatter,加 hint | 648.787 | 35.17% |
| AllGather, stockAllGather,原始 | 614.425 | 0.68% |
| AllGather, hintsAllGather,加 hint | 625.306 | 57.18% |
ReduceScatter gained 16.07 GB/s, and its DRAM reads fell from 3.785 G to 2.449 G; on the full NVL16 it went from 680.22 to 690.8 GB/s. The default buffer size and a high channel count each help bandwidth, but together they overflow L2. Panel 1 puts both sweeps on one grid.
ReduceScatter 多了 16.07 GB/s,DRAM 讀取從 3.785 G 降到 2.449 G;在完整的 NVL16 上從 680.22 提高到 690.8 GB/s。預設緩衝大小與高 channel 數各自都對頻寬有利,但兩者加起來就超出 L2。面板 1 把兩組掃描放在同一張格子上。
Limits and open questions限制與未解的問題
The paper's own. FabricPerf cannot see routing, packetization or NVSwitch; switch effects appear only in end-to-end latency. The cause of the imbalance is a hypothesis, and online mode costs 8.9%. A careful reader's. The largest run has 16 GPUs, not a full NVL72. Only NCCL 2.28.9 with Ring was measured, not tree or NVLS (reduction inside NVSwitch), which would change the memory model. The probes rely on the Simple protocol's fence; LL and LL128 need none (Section 4.5), and the paper does not say how it handles them. Work stealing was tested on one node at one message size, and the cache study had no GEMM sharing L2. The paper's absolute online-overhead figures disagree, so we quote only percentages.
論文自己提到的。FabricPerf 看不到路由、封包化或 NVSwitch;交換器的影響只出現在端到端延遲中。不平衡的原因仍是假設,線上模式的成本是 8.9%。細心讀者會問的。最大的實驗只有 16 顆 GPU,不是完整的 NVL72。只量了 NCCL 2.28.9 的 Ring,沒有 tree 或 NVLS(在 NVSwitch 內歸約),而 NVLS 會改變記憶體模型。探針依賴 Simple 協定的 fence;LL 與 LL128 不需要 fence(第 4.5 節),論文也沒有說明如何處理。work stealing 只在一個節點、一種訊息大小上測過,快取研究也沒有讓 GEMM 同時使用 L2。論文中線上額外負擔的絕對數字前後不一致,所以我們只引用百分比。
How it connects與其他內容的關聯
PingPoint does the same work one level further in, for the chiplet network inside an AMD MI300X, and InfiniteHBD asks how large and fault-tolerant a scale-up domain can be. AutoCCL tunes the channel and thread counts that FabricPerf varies. PReCCL moves bytes between channels at collective boundaries; FabricPerf steals work inside one collective. NCCLX drops staging copies, as DMA-style buffers drop flows 4 and 5. The Meta RoCE and Llama 3 papers treat NVLink as a fixed island; FabricPerf opens it.
PingPoint 往內再走一層,對 AMD MI300X 封裝內的 chiplet 網路做同樣的事;InfiniteHBD 問的是 scale-up 網域能做多大、多耐故障。AutoCCL 調的正是 FabricPerf 改變的 channel 與執行緒數。PReCCL 在集體操作的邊界於 channel 之間移動位元組;FabricPerf 則在單一集體操作內接手工作。NCCLX 拿掉暫存複製,正如 DMA 式緩衝拿掉流 4 與流 5。Meta RoCE 與 Llama 3 論文把 NVLink 當成固定的孤島;FabricPerf 打開了它。
Key numbers關鍵數字
| Number數字 | What was measured, and where量了什麼、在哪裡量 |
|---|---|
| 10,240 | Threads to fill NVLink at 350 GB/s (H100, send/recv)把 NVLink 填到 350 GB/s 所需的執行緒(H100、send/recv) |
| 101.8 ns / ns | Clock jitter in a kernel / worst triangle error (GB200)kernel 內的時鐘抖動/最大三角誤差(GB200) |
| +0.6% / +8.9% | Overhead, offline / online (hot path)額外負擔,離線/線上(熱路徑) |
| 0.68 of 58.5 µs | Fabric segment of a 4 MB echo (H100)一次 4 MB echo 中的互連段(H100) |
| ≈ 14 vs ≈ 7 µs | P99 vs P50 channel latency (H100, 24 channels)channel 延遲的 P99 對 P50(H100、24 個 channel) |
| 12 ch, ≈ 200 GB/s | Where P99 leaves P50, below saturation (H100)P99 離開 P50 之處,尚未飽和(H100) |
| 316.9 → 334.4 GB/s | AllGather with work stealing (H100)加 work stealing 的 AllGather(H100) |
| ≈ 0% | L2 hits at 32 channels and MB buffers (GB200)32 個 channel 且 MB 緩衝時的 L2 命中(GB200) |
| 0.31% → 35.17% | ReduceScatter read hits with eviction hints (GB200)加 eviction hint 的 ReduceScatter 讀取命中(GB200) |
Terms used on this page本頁用到的術語
- Scale-up network
- A GPU-to-GPU fabric on GPU memory, such as NVLink with NVSwitch; no NIC.
- 接在 GPU 記憶體上的 GPU 對 GPU 互連,例如 NVLink 加 NVSwitch;沒有 NIC。
- Channel
- One thread block on one SM that carries a slice of a collective.
- 跑在一顆 SM 上、負責集體操作一部分的一個 thread block。
- Fence / tailer
- The instruction that orders earlier stores before later ones / the flag written after it.
- 讓先前的 store 排在之後的 store 之前的指令/在它之後寫入的旗標。
- Fabr-TX
- : the fabric's share of one transfer.
- :一次傳輸中互連所占的部分。
- GPTP
- GPU Precision Time Protocol: offset sync with 128-bit messages.
- GPU 精確時間協定:用 128 位元訊息做偏移同步。
- evict_first / evict_last
- PTX hints that lower or raise one instruction's L2 priority.
- 降低或提高單一指令 L2 優先權的 PTX hint。
- Work stealing
- A finished channel sends the slowest channel's last chunks.
- 已完成的 channel 替最慢的 channel 送出最後幾個 chunk。