Understanding and Profiling the Accelerator Chiplet Network Using PingPoint以 PingPoint 理解並剖析加速器的 chiplet 網路
After reading, you can explain why an MI300X package is itself a network, how PingPoint's in-kernel pings find its congested links, and why fixed routes make placement the fix.讀完後,你能說明為什麼一顆 MI300X 封裝本身就是一個網路、PingPoint 如何用 kernel 內的 ping 找出壅塞的鏈路,以及為什麼固定的路由讓「配置」成為解法。
A chiplet GPU is a network before any byte reaches NVLink or a NIC. AMD's MI300X joins 8 compute dies, 4 IO dies and 8 HBM stacks with routed, buffered links: the Accelerator Chiplet Network (ACN). The ACN is 54 of 372 ns of an idle memory access but 436 of 949 ns under load. Its IO-IO links (2.4 TB/s) are narrower than HBM (5.9 TB/s), follow fixed YX routes and buffer deeply: a full link holds each request for about 4 µs. One congested memory link throttles its IO die, and the backpressure reaches every die; a flow that shares no link with it gains up to 139 ns. PingPoint fuses latency and bandwidth pings into the user's kernel and blames individual links. Kernels on disjoint compute units still interfered (P99 up to 10.6×), and guided placement brought a latency-bound service to 1.43 M queries/s, within 2% of running alone.
chiplet 架構的 GPU,在任何位元組抵達 NVLink 或 NIC 之前,本身就已經是一個網路。AMD 的 MI300X 用有路由、有緩衝的鏈路接起 8 顆運算晶粒、4 顆 IO 晶粒與 8 個 HBM 堆疊:這就是加速器 chiplet 網路(ACN)。閒置時 ACN 只占一次記憶體存取 372 ns 中的 54 ns,負載下卻占 949 ns 中的 436 ns。它的 IO-IO 鏈路(2.4 TB/s)比 HBM(5.9 TB/s)還窄、走固定的 YX 路徑,而且緩衝很深:一條滿載的鏈路讓每個請求等約 4 µs。一條壅塞的記憶體鏈路會節流它的 IO 晶粒,反壓再擴及每一顆晶粒;一條與它不共用任何鏈路的流,延遲最多增加 139 ns。PingPoint 把延遲與頻寬 ping 融合進使用者的 kernel,並把責任歸到個別鏈路。跑在不相交運算單元上的 kernel 仍互相干擾(P99 最多 10.6 倍);依 PingPoint 建議調整配置後,一個受延遲限制的服務達到每秒 143 萬次查詢,與單獨執行相差不到 2%。
1. Where this paper sits1. 這篇論文的位置
Section 2.2, "The bandwidth ladder as a principle", starts the ladder at HBM, about 3.35 TB/s on an H100 (Panel 1 there). Section 06, "The latency ladder", puts an HBM access at "hundreds of ns", the floor of every round trip. Both treat the GPU package as one box. In a chiplet GPU, the dies are joined by links with routers, queues and flow control, and nobody had measured them one by one: only 28 of MI300X's 259 performance counters relate to the interconnect, and earlier microbenchmarks timed compute units (CUs), caches and HBM. PingPoint moves Pingmesh-style probing (see R-Pingmesh) inside one package.
第 2.2 節「頻寬階梯作為原則」把階梯的起點放在 HBM:H100 上約 3.35 TB/s(該頁的面板 1)。第 06 節「延遲階梯」把一次 HBM 存取寫成「數百 ns」,是每一次往返的地板。兩節都把 GPU 封裝當成一個盒子。在 chiplet 架構的 GPU 中,晶粒之間由帶有路由器、佇列與流量控制的鏈路連接,過去沒有人逐條量測過:MI300X 的 259 個效能計數器中只有 28 個與互連有關,而過去的微基準量的是運算單元(CU)、快取與 HBM。PingPoint 把 Pingmesh 式的探測(見 R-Pingmesh)搬進單一封裝內部。
2. The problem, measured2. 問題,用量測說話
2.1 A package of chiplets2.1 由 chiplet 組成的封裝
The MI300X has 8 compute dies (XCDs, 38 CUs and a 4 MB L2 each), 4 IO dies (IODs, each with a 64 MB last-level cache, LLC) and 8 HBM stacks. One IOD with its two XCDs and two stacks is a chiplet cluster (CC). The links are COM-IO (XCD to IOD), IO-IO (IOD to IOD), IO-MEM (IOD to HBM) and IO-EXT (off-package, not measured). An L2 miss crosses COM-IO to the IOD, which answers from its LLC, its own HBM or a neighbouring IOD. Pages are spread over all 8 stacks in 4 KB chunks, so six of every eight chunks that a kernel touches sit in another cluster.
MI300X 有 8 顆運算晶粒(XCD,每顆 38 個 CU 與 4 MB L2)、4 顆 IO 晶粒(IOD,每顆有 64 MB 的末級快取 LLC),以及 8 個 HBM 堆疊。一顆 IOD 加上它的兩顆 XCD 與兩個堆疊,構成一個 chiplet cluster(CC)。鏈路分為 COM-IO(XCD 到 IOD)、IO-IO(IOD 到 IOD)、IO-MEM(IOD 到 HBM)與 IO-EXT(通往封裝外,本文未量測)。一次 L2 未命中經 COM-IO 送到 IOD,由它從 LLC、自己的 HBM 或相鄰的 IOD 取得資料。分頁以 4 KB 為單位分散到全部 8 個堆疊,所以 kernel 碰到的每 8 個區塊中有 6 個位於其他 cluster。
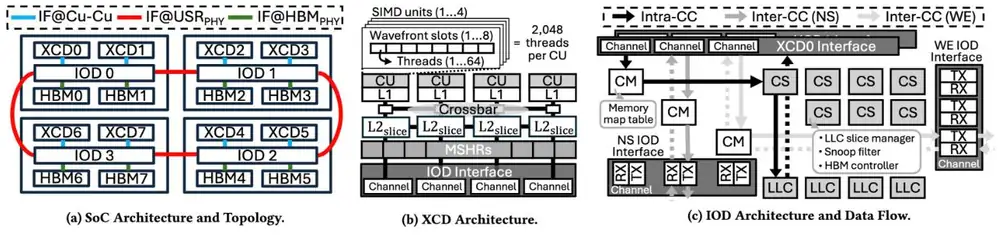
The authors built two controls the GPU lacks. XCD pinning: a prelude kernel reads its XCD number from a hardware register and runs the benchmark only on the target XCD. HBM stack localizer: 256 threads per XCD time a load of each 4 KB chunk, and the fastest XCD is in the chunk's cluster. Two kernels make traffic: lat (one thread chasing pointers) and bw (all threads reducing arrays). Paths that differ by one segment give that segment's latency.
作者做出 GPU 本身缺少的兩種控制。XCD 釘選:前導 kernel 從硬體暫存器讀出自己的 XCD 編號,只在目標 XCD 上執行基準程式。HBM 堆疊定位器:每顆 XCD 上 256 個執行緒對每個 4 KB 區塊的載入計時,最快的 XCD 就在該區塊所屬的 cluster。兩個 kernel 產生流量:lat(單一執行緒做指標追逐)與 bw(所有執行緒對陣列做歸約)。只差一段的兩條路徑,就給出那一段的延遲。
2.2 Under load, the links dominate2.2 負載下,鏈路成為主角
Idle, a CU-to-HBM access averages 372 ns over four patterns (local, west–east, north–south, diagonal). HBM is the largest part (156 ns); the ACN is 54 ns, about 50 ns per IO-IO hop. With bw kernels in the background, the access takes 949 ns and the ACN is the largest part, 436 ns, of which the IO-IO links take 324 ns. The ACN links are also the narrowest: 6.2, 2.4 and 4.4 TB/s for COM-IO, IO-IO and IO-MEM, against 5.9 TB/s for HBM. Traffic that crossed an IO-IO link stopped at 3.3 TB/s, against 5.3 TB/s locally: "thin pipes", in the paper's words.
閒置時,從 CU 到 HBM 的一次存取在四種模式(本地、東西向、南北向、對角)上平均 372 ns。最大的部分是 HBM(156 ns);ACN 是 54 ns,每次 IO-IO 跳躍約 50 ns。背景跑著 bw kernel 時,存取要 949 ns,ACN 以 436 ns 成為最大的部分,其中 IO-IO 鏈路占 324 ns。ACN 鏈路也是最窄的:COM-IO、IO-IO、IO-MEM 分別是 6.2、2.4、4.4 TB/s,而 HBM 是 5.9 TB/s。跨越 IO-IO 鏈路的流量停在 3.3 TB/s,本地則是 5.3 TB/s:用論文的話說,是「細管子」(thin pipes)。
bw kernels in the background), the ACN part (orange) grows from 54 to 436 ns. The three ACN links are the three narrowest segments of the path.依論文圖 3 (a)–(c) 重畫,數據為 MI300X 實測。負載下(背景跑 bw kernel),ACN 部分(橘色)從 54 ns 增加到 436 ns。三種 ACN 鏈路正是路徑上最窄的三段。Drawn for this primer from §3.3 and Figure 3 of Ryu et al.; the 513 and 112 ns parts are differences of the paper's totals.The shares, one question per row:
各占比逐列計算如下:
| Question問題 | Calculation算式 | Result結果 |
|---|---|---|
| ACN share of an idle accessACN 占閒置存取的比例 | paper: 14.4%論文:14.4% | |
| ACN share of a loaded accessACN 占負載下存取的比例 | paper states 43.1%論文寫 43.1% | |
| IO-IO part of the loaded ACN time負載下 ACN 時間中 IO-IO 的部分 | ||
| IO-IO bandwidth against HBM bandwidthIO-IO 頻寬相對 HBM 頻寬 |
The paper's 43.1% is probably the average of the four patterns' own shares; either way, the ACN is the largest part under load.
論文的 43.1% 大概是四種模式各自占比的平均;無論哪種算法,負載下 ACN 都是最大的部分。
2.3 Three link types, three behaviours2.3 三種鏈路,三種行為
COM-IO: spraying into shared queues. Each XCD reaches its IOD over 16 channels, and counters show uniform spraying over all 16, whatever the destination (one fully busy XCD, 76K threads, moved 1.1 TB/s locally and 0.8 TB/s remotely). Because local and remote requests share every channel, the 16 act as one FIFO queue. Head-of-line blocking starts at 43.7–66.8% load: under local load, remote requests slowed by up to 160 ns, under remote load by up to 41 ns. Stalls in the caches' miss registers, and above 74.0% load backpressure into the CUs, bound the damage.
COM-IO:噴灑進共用的佇列。每顆 XCD 透過 16 個通道連到它的 IOD,計數器顯示:不論目的地為何,請求都均勻噴灑到全部 16 個通道(一顆全速的 XCD、7.6 萬個執行緒,本地搬 1.1 TB/s、遠端 0.8 TB/s)。由於本地與遠端請求共用每一個通道,這 16 個通道就像一條 FIFO 佇列。隊頭阻塞(head-of-line blocking)在負載 43.7–66.8% 時開始:在本地負載下,遠端請求最多慢 160 ns,在遠端負載下最多慢 41 ns。快取未命中暫存器的停滯,以及負載超過 74.0% 後回推到 CU 的反壓,限制了損害的上限。
IO-IO: deep buffers and fixed routes. The 2×2 mesh has 8 one-way links, written for the link from IOD to IOD . Each takes 53 ns per hop and carries 820.0 GB/s. A large SRAM buffer at each link's egress absorbs bursts. Near the limit, request latency over , , and rose to 4,005, 3,903, 3,818 and 3,787 ns, 16.0–17.1× unloaded.
IO-IO:深緩衝與固定路由。2×2 網格有 8 條單向鏈路,以 表示從 IOD 到 IOD 的鏈路。每條每跳 53 ns、承載 820.0 GB/s。每條鏈路出口端的一大塊 SRAM 緩衝吸收突發。接近上限時,經過 、、、 的請求延遲升到 4,005、3,903、3,818、3,787 ns,是未負載的 16.0–17.1 倍。
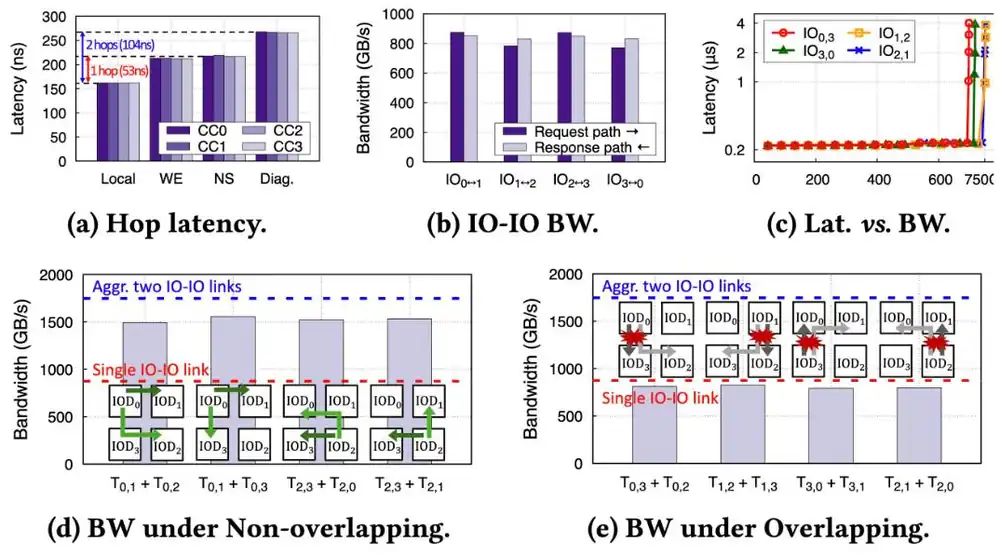
Routing between IODs is canonical YX routing: north–south first, then west–east. It ignores load, the reply takes a different route from the request, and neighbouring IODs always use their direct link (figure below). Two flows on disjoint links reached 1.5 TB/s together; two that shared a link got 791.1–820.0 GB/s. Since the route depends only on the source XCD and the address, congestion is predictable from where threads and pages sit, so the paper argues for topology-aware placement, not reactive congestion control.
IOD 之間採用標準的 YX 路由:先南北向,再東西向。它不看負載,回覆走的路與請求不同,相鄰的 IOD 一律使用直接鏈路(見下圖)。兩條走不相交鏈路的流合計達到 1.5 TB/s;共用一條鏈路的兩條流只得到 791.1–820.0 GB/s。路徑只取決於來源 XCD 與位址,所以從執行緒與分頁的位置就能預測壅塞,因此論文主張感知拓樸的配置,而不是被動反應的壅塞控制。
IO-MEM: shallow buffers and blind backpressure. Each of an IOD's 32 LLC partitions has its own channel to memory, chosen by address, and an IO-MEM link is capped at 737.5 GB/s. The buffers are shallow: an oversubscribed partition added at most 37 ns. But a congested IO-MEM link throttles its whole IOD without finding the culprit flow; the IOD holds back incoming IO-IO traffic, and the backpressure spreads ring by ring. A flow that shared no link with the culprit gained up to 139 ns, for tens to hundreds of microseconds. The authors compare this with PFC pause propagation: it is the victim flow of Section 7.3, one level down.
IO-MEM:淺緩衝與盲目的反壓。一顆 IOD 的 32 個 LLC 分區各有自己通往記憶體的通道,由位址決定,一條 IO-MEM 鏈路的上限是 737.5 GB/s。緩衝很淺:被超額使用的分區最多只增加 37 ns。可是一條壅塞的 IO-MEM 鏈路會節流整顆 IOD,而不去找出元兇的流;這顆 IOD 擋住流入的 IO-IO 流量,反壓一圈一圈往外擴散。一條與元兇不共用任何鏈路的流,延遲最多增加 139 ns,持續數十到數百微秒。作者把它比作 PFC 暫停的傳播:這正是第 7.3 節的受害者流,只是低了一個層級。
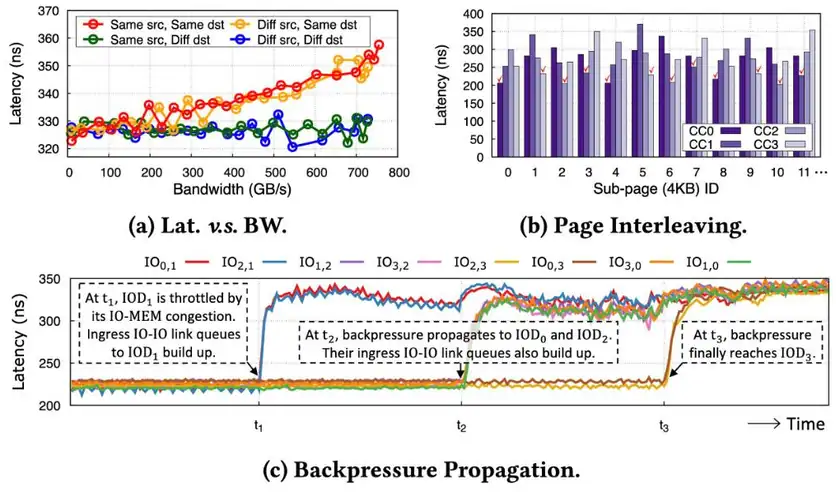
The panel shows the three IO-IO effects together: fixed routes, the shared-link cliff and spreading backpressure.
面板把三個 IO-IO 效應放在一起:固定的路徑、共用鏈路的懸崖,以及擴散的反壓。
Raise the defaults to 16 CUs. Does moving B's data to HBM2 bring A back to 104 ns? Then set A = XCD6 → HBM4 and B = XCD0 → HBM2, and step the backpressure from t1 to t3. When does A, which shares no link with B, start to pay?
把預設調到 16 個 CU。把 B 的資料移到 HBM2,能讓 A 回到 104 ns 嗎?接著設定 A = XCD6 → HBM4、B = XCD0 → HBM2,把反壓從 t1 推到 t3。與 B 不共用任何鏈路的 A,從哪一步開始付出代價?
3. The design: PingPoint3. 設計:PingPoint
3.1 A hose per link, a queue per link type3.1 每條鏈路一個 hose,每種鏈路一種佇列
Thousands of requests are in flight at sub-microsecond timescales, too many to trace one by one. PingPoint treats each link as a hose: maximum aggregate input and output rates, plus a performance envelope that depends only on total traffic. Each link type gets the queue that matches section 2, in Kendall notation (arrival / service / servers / capacity / sources / discipline):
同時在途的請求有數千個、時間尺度在微秒以下,無法逐一追蹤。PingPoint 把每條鏈路當成一個 hose(軟管):總輸入與總輸出速率上限,加上只取決於總流量的效能包絡。每種鏈路得到與第 2 節相符的佇列,以 Kendall 記號(到達 / 服務 / 伺服器數 / 容量 / 來源數 / 服務規則)表示:
| Hardware entity | 硬體實體 | Measured behaviour | 實測行為 | Queue model | 佇列模型 |
|---|---|---|---|---|---|
| Compute adapter (COM-IO) | 運算轉接端(COM-IO) | 16 sprayed channels act as one FIFO | 16 個噴灑通道如同一條 FIFO | Central-FCFS, | |
| IO chiplet (IO-IO) | IO chiplet(IO-IO) | Deep buffers, fixed YX routes | 深緩衝、固定 YX 路徑 | Split-FCFS, | |
| Memory-side adapter (IO-MEM) | 記憶體轉接端(IO-MEM) | Token-ring arbitration, coarse backpressure | 令牌環仲裁、粗粒度反壓 | Central-PS, |
counts sources or servers; processor sharing (PS) approximates the opportunistic sharing seen under congestion. The queues are vocabulary: the paper gives no formulas or fitted parameters.
表示來源或伺服器的數量;處理器共享(PS)近似壅塞時觀察到的機會式分享。這些佇列是詞彙:論文沒有給出公式或擬合參數。
3.2 Pings fused into the kernel3.2 融合進 kernel 的 ping
A PingSpec names a ping's type, its datapath (a source XCD and a destination HBM stack) and its CUs. A lat ping uses 1 CU; a bw ping uses 10–16 CUs at about 50 GB/s per CU. The default PingPlan covers every pair: 64 latency pings and 320 bandwidth pings.
PingSpec 指定一個 ping 的類型、資料路徑(一顆來源 XCD 與一個目的 HBM 堆疊)與 CU。lat ping 用 1 個 CU;bw ping 用 10–16 個 CU,每個 CU 約 50 GB/s。預設的 PingPlan 涵蓋每一對組合:64 個延遲 ping 與 320 個頻寬 ping。
The pings run inside the user's kernel. The kernel becomes a C++ functor, TargetFn, whose built-ins (blockIdx, gridDim) come from a PingPointCtx structure. PingPoint launches one fused_kernel with Cooperative Groups. Blocks that land on a ping's CUs run the ping; all others run TargetFn. Grid-wide barriers start and stop each ping inside the kernel's run, and ping CUs are never kernel CUs, so a slower ping means a slower ACN path, not a busier CU. What is timestamped: the elapsed clock cycles of every ping iteration, stored in a PingResult and sent to the host. A calibration phase first runs each ping alone to set its baseline.
ping 在使用者的 kernel 內部執行。kernel 被改寫成 C++ 函式物件 TargetFn,它的內建變數(blockIdx、gridDim)改由 PingPointCtx 結構提供。PingPoint 以 Cooperative Groups 啟動一個 fused_kernel。落在 ping 所屬 CU 上的區塊執行 ping;其餘區塊執行 TargetFn。全網格的 barrier 讓每個 ping 在 kernel 執行期間內開始與結束,而 ping 的 CU 永遠不是 kernel 的 CU,所以 ping 變慢代表 ACN 路徑變慢,而不是某個 CU 比較忙。記錄的時間戳:每次 ping 迭代經過的時脈週期數,存進 PingResult 再送到主機。在此之前的校準階段,每個 ping 單獨執行,建立自己的基準。
3.3 Differential Congestion Attribution3.3 差分壅塞歸因
Differential Congestion Attribution (DCA) turns the report into blame. For each ping it computes three deviations from the calibrated baseline (marked with a hat):
差分壅塞歸因(DCA)把報告轉成歸責。對每個 ping,它計算相對於校準基準(加帽號者)的三個偏差:
A ping deviates if any passes its threshold: , while and are "much smaller" (no values given). For a deviating ping, DCA checks each link on its path. Only if every ping that crosses , the set , deviates is a common congestion point, with
只要任一個 超過門檻,ping 就算偏離:,而 與 「小得多」(未給數值)。對偏離的 ping,DCA 檢查它路徑上的每條鏈路 。只有當穿過 的每個 ping(集合 )都偏離時, 才是共同的壅塞點,其指標為
The minimum makes a conservative lower bound. DCA normalizes the on the path into shares (the method is not given) and splits the ping's excess latency, . One clean ping through a link clears that link.
取最小值讓 成為保守的下界。DCA 把路徑上的 正規化成比例 (論文未給方法),再分配這個 ping 多出的延遲:。只要有一個正常的 ping 穿過某條鏈路,那條鏈路就被排除。
From a bandwidth ping's residual bandwidth , PingPoint estimates the kernel's own as , with the path's calibrated peak and the ping's own slowdown (0.174 at 10 CUs to 0.329 at 16). Because these pings cost bandwidth, two-tier monitoring keeps latency pings on and starts bandwidth pings only after a latency anomaly.
PingPoint 從頻寬 ping 量到的剩餘頻寬 估計 kernel 自己的頻寬:, 是路徑校準過的峰值, 是 ping 本身造成的變慢(10 個 CU 時 0.174,16 個時 0.329)。因為這些 ping 會吃掉頻寬,兩層監控讓延遲 ping 一直開著,只有在延遲異常後才啟動頻寬 ping。
4. Implementation4. 實作
PingPoint is a HIP library built on fused kernels and Cooperative Groups, public on GitHub (netlab-wisconsin/pingpoint); its size in lines of code is not reported. The testbed is one node of AMD's AI & HPC Cluster: 8 MI300X GPUs and an EPYC 9684X host with 2.3 TB of DDR5, frequency boost off; ROCProfiler supplies counters. Start-up takes 8.98 s, a one-time calibration 6.0 s at 10K iterations per ping (62.3 s at 100K), and memory peaks at 6 GB, about 3% of the GPU's 192 GB. MI350X needed only a few parameters, such as its 8 KB interleave, found at start-up.
PingPoint 是建立在融合 kernel 與 Cooperative Groups 上的 HIP 函式庫,公開在 GitHub(netlab-wisconsin/pingpoint);論文沒有給出程式碼行數。測試平台是 AMD AI & HPC Cluster 的一個節點:8 顆 MI300X GPU,主機為 EPYC 9684X、2.3 TB DDR5,關閉頻率加速;計數器由 ROCProfiler 提供。啟動需 8.98 秒,一次性的校準在每個 ping 1 萬次迭代時需 6.0 秒(10 萬次時 62.3 秒),記憶體峰值 6 GB,約占 GPU 192 GB 的 3%。MI350X 只需要少數參數,例如它的 8 KB 交錯粒度,在啟動時自動找出。
5. What was measured5. 量到了什麼
All results are measured (case 6 on MI350X, the rest on MI300X); nothing is simulated. The workloads are the four kernels of a Mixture-of-Experts (MoE) layer: attention (ATTN), scatter (Scat), the expert FFN and gather (Gath), with one expert per XCD and uniform or 90%-skewed routing.
所有結果都在 MI300X 上實測(案例 6 在 MI350X 上);沒有任何模擬。工作負載是 Mixture-of-Experts(MoE)層的四個 kernel:注意力(ATTN)、分散(Scat)、專家 FFN 與收集(Gath),每顆 XCD 一個專家,路由分為均勻與 90% 偏斜。
| Case | 案例 | Setup | 設定 | Measured result | 實測結果 |
|---|---|---|---|---|---|
| 1 Profiling | 1 剖析 | Four MoE kernels | 四個 MoE kernel | ACN = 53.3–67.4% of tail latency; at the highest ping intensity, ACN latency 701 / 739 / 718 / 910 ns for ATTN / FFN / Scat / Gath (2.4×, 2.2×, 1.2×, 2.7×); IO-MEM incast dominates Gath | ACN 占尾端延遲 53.3–67.4%;最高 ping 強度下 ATTN / FFN / Scat / Gath 的 ACN 延遲為 701 / 739 / 718 / 910 ns(2.4、2.2、1.2、2.7 倍);Gath 以 IO-MEM incast 為主 |
| 2 Skew | 2 偏斜 | Uniform vs skewed | 均勻 vs 偏斜 | Scat IO-MEM mean / tail 112 / 223 ns; Gath IO-MEM 2.4×, IO-IO 1.4× | Scat 的 IO-MEM 平均 / 尾端 112 / 223 ns;Gath 的 IO-MEM 2.4 倍、IO-IO 1.4 倍 |
| 3 Interference | 3 干擾 | Scat or Gath + ATTN on disjoint CUs | Scat 或 Gath + ATTN,CU 不相交 | Scat: mean 6.2×, P99 10.6×, bandwidth −58%. Gath: 6.1×, 6.2×, −85%. IO-IO part of the mean 1,826 / 2,747 ns, of P99 4,038 / 5,564 ns | Scat:平均 6.2 倍、P99 10.6 倍、頻寬 −58%。Gath:6.1 倍、6.2 倍、−85%。IO-IO 在平均中占 1,826 / 2,747 ns、在 P99 中占 4,038 / 5,564 ns |
| 4 Overhead | 4 開銷 | Estimator; LLM Prefill, Decode | 估計器;LLM Prefill、Decode | MAPE 7.2% at 384–537 GB/s of probe traffic. Slowdown: Prefill 1.6% (peak 4.2%), Decode 13.2% (27.9%), 7.9% with a bw ping every third iteration; two-tier 3.5% vs 98.2% always-on | MAPE 7.2%,探測流量 384–537 GB/s。變慢:Prefill 1.6%(峰值 4.2%)、Decode 13.2%(27.9%),每三次迭代一個 bw ping 時 7.9%;兩層 3.5% 對一直開著 98.2% |
| 5 Guidance | 5 配置建議 | ANN search (10 µs P99 SLO) + Vector Scan | ANN 搜尋(P99 SLO 10 µs)+ Vector Scan | SLO capacity (M q/s): unmanaged 1.1, random migration 1.33, throttling ≤ 1.4, guided 1.43, alone 1.45 (guided is 1.4% below alone) | SLO 容量(百萬次查詢/秒):不管理 1.1、隨機搬移 1.33、節流 ≤ 1.4、依建議 1.43、單獨 1.45(依建議比單獨低 1.4%) |
| 6 MI350X | 6 MI350X | 8 XCDs, 2 IODs | 8 顆 XCD、2 顆 IOD | Hop 96 ns (1.8×); ACN 486 of 853 ns loaded (57.0%); remote 3.6 vs local 6.1 TB/s | 每跳 96 ns(1.8 倍);負載下 ACN 占 853 ns 中的 486 ns(57.0%);遠端 3.6 對本地 6.1 TB/s |
Case 3 matters for anyone who shares a GPU: separate streams and CUs still left Scat with a 10.6× P99, mostly on IO-IO links. CU isolation does not isolate the ACN. In case 5, PingPoint found the Vector Scan datapaths that met the search traffic; moving those threads and vectors gave 30% more SLO capacity than unmanaged, while throttling cost 30.3–47.6% of Vector Scan throughput. Appendix F (not peer-reviewed, the paper notes) adds that the per-cluster memory mode NPS4 gave an XCD 13.0% more bandwidth than NPS1.
對共用 GPU 的人來說,案例 3 很重要:分開的 stream 與 CU 仍讓 Scat 的 P99 增加 10.6 倍,主要在 IO-IO 鏈路上。CU 隔離不能隔離 ACN。在案例 5,PingPoint 找出與搜尋流量相遇的 Vector Scan 資料路徑;把那些執行緒與向量移開,SLO 容量比不管理多 30%,而節流則犧牲 Vector Scan 30.3–47.6% 的吞吐。附錄 F(論文註明未經同儕審查)補充:以 cluster 劃分記憶體的 NPS4 模式讓一顆 XCD 比 NPS1 多得 13.0% 的頻寬。
6. Limits and open questions6. 限制與未解的問題
- Indirect evidence. Link state, deep buffers and backpressure are inferred from timing and counters, not confirmed by AMD; DCA gives a lower bound.間接證據。鏈路狀態、深緩衝與反壓都是從計時與計數器推論而來,AMD 並未證實;DCA 給的是下界。
- Not fully reproducible. , and the normalization of are missing. The paper counts its 320 bandwidth pings as 8 × 8 × 7, which is 448.無法完全重現。缺少 、 與 的正規化方法。論文把 320 個頻寬 ping 算成 8 × 8 × 7,那其實是 448。
- Scope. One vendor, two GPUs; NVIDIA's B100/B200 are not measured. Synthetic MoE kernels, an unnamed dataset, no end-to-end model throughput.範圍。一家廠商、兩款 GPU;NVIDIA 的 B100/B200 沒有量測。合成的 MoE kernel、未寫出的資料集,沒有端到端的模型吞吐。
- Numbers that do not line up. IO-IO bandwidth appears as 2.4 TB/s (Figure 3c), 820 GB/s per link and 1.2/1.5 TB/s per cluster (Table 1), unreconciled; the loaded ACN share is 43.1% in the text, 46% by division.對不上的數字。IO-IO 頻寬分別以 2.4 TB/s(圖 3c)、每條鏈路 820 GB/s 與每個 cluster 1.2/1.5 TB/s(表 1)出現,論文沒有交代關係;負載下 ACN 的占比在文中是 43.1%,相除則是 46%。
- The off-package side is open. IO-EXT links (PCIe, xGMI, the NICs) were not measured; whether ACN congestion slows RCCL collectives or NIC DMA is untested.封裝外的一側仍是空白。IO-EXT 鏈路(PCIe、xGMI、NIC)沒有量測;ACN 壅塞是否拖慢 RCCL 集體操作或 NIC 的 DMA,尚未驗證。
7. How it connects7. 與其他內容的關聯
In this chapter, FabricPerf probes one level up, on NVLink domains without NICs, and InfiniteHBD sizes such domains. PingPoint's vocabulary carries up to the RoCE fabric:
在本章中,FabricPerf 在上一層、沒有 NIC 的 NVLink 網域上探測,InfiniteHBD 則決定這種網域的大小。PingPoint 的詞彙也能往上用到 RoCE 網路:
| Mechanism | 機制 | Inside the MI300X package | MI300X 封裝內 | In the RoCE fabric | RoCE 網路中 |
|---|---|---|---|---|---|
| Shared queue, HoL blocking | 共用佇列、隊頭阻塞 | 16 sprayed COM-IO channels act as one FIFO | 16 個噴灑的 COM-IO 通道如同一條 FIFO | PFC pauses a whole port and priority (t07 §3) | PFC 暫停整個埠的整個優先權(t07 第 3 節) |
| Fixed routes | 固定路徑 | YX: path set by source XCD and address | YX:路徑由來源 XCD 與位址決定 | ECMP hash; HPN's dual-plane removes the choice (t06 §4) | ECMP 雜湊;HPN 的 dual-plane 拿掉選擇(t06 第 4 節) |
| Deep buffers | 深緩衝 | IO-IO egress SRAM: about 4 µs on a full link | IO-IO 出口 SRAM:滿載鏈路約 4 µs | Deep-buffer spine chassis (t02 §04) | 深緩衝 spine 機箱(t02 第 04 節) |
| Flow-blind backpressure | 不看流的反壓 | IO-MEM throttles its IOD; +139 ns on a link-disjoint flow | IO-MEM 節流整顆 IOD;不共用鏈路的流 +139 ns | Pause storms (Microsoft RoCE); a victim flow fell from 20 to 4.5 Gb/s (DCQCN) | 暫停風暴(Microsoft RoCE);受害者流從 20 掉到 4.5 Gb/s(DCQCN) |
| Active probing | 主動探測 | Pings fused into the kernel; DCA | 融合進 kernel 的 ping;DCA | Pingmesh, R-Pingmesh voting | Pingmesh、R-Pingmesh 投票 |
| The fix | 解法 | Place threads and pages off shared links | 把執行緒與分頁放到共用鏈路之外 | Place jobs and ranks (t10 §2) | 配置任務與 rank(t10 第 2 節) |
What it means for the fabric above對上層網路的意義
The hierarchy gains a level below the server. The numbers do not transfer, but the pathologies do. "HBM latency" is not a constant: 372 ns idle, 949 ns loaded, and the memory phases of collectives cross the same thin pipes (not measured in the paper). Sharing a GPU, like sharing a fabric, needs topology-aware placement; CU quotas alone left a 10.6× tail. And a careful reader should ask whether some slow ranks blamed on the fabric are congested inside their own package.
階層在伺服器之下又多了一層。數字不能跨層搬用,但病徵可以。「HBM 延遲」不是常數:閒置 372 ns、負載下 949 ns,而集體操作中的記憶體階段也要穿過同樣的細管子(論文未量測)。共用一顆 GPU 就像共用一個網路,需要感知拓樸的配置;只分配 CU 配額留下了 10.6 倍的尾端延遲。細心的讀者也該問:有些被歸咎於網路的慢 rank,是否其實在自己的封裝內壅塞。
Key numbers關鍵數字
| Number | 數字 | Meaning (MI300X, measured, unless noted) | 意義(除另註外皆為 MI300X 實測) |
|---|---|---|---|
| 372 ns, ACN 54 | Idle memory access, average of four patterns | 閒置記憶體存取,四種模式平均 | |
| 949 ns, ACN 436 | Loaded access; IO-IO alone 324 ns | 負載下的存取;光 IO-IO 就 324 ns | |
| 2.4 vs 5.9 TB/s | IO-IO vs HBM bandwidth | IO-IO 對 HBM 的頻寬 | |
| 53 ns, 820 GB/s | One IO-IO hop; one IO-IO link | 一次 IO-IO 跳躍;一條 IO-IO 鏈路 | |
| ≈ 4 µs (16–17×) | Request latency over a nearly full IO-IO link | 經過幾乎滿載 IO-IO 鏈路的請求延遲 | |
| +139 ns | Link-disjoint flow in a backpressure storm | 反壓風暴中不共用鏈路的流 | |
| 10.6×, −58% | Scat P99 and bandwidth beside ATTN on disjoint CUs | Scat 與 ATTN 在不相交 CU 上的 P99 與頻寬 | |
| 3.5% vs 98.2% | Decode slowdown: two-tier vs always-on bw pings | Decode 變慢:兩層 vs 一直開著 bw ping | |
| 1.43 vs 1.45 M q/s | SLO capacity, PingPoint-guided vs alone (1.1 M unmanaged) | SLO 容量,依建議 vs 單獨(不管理 1.1 M) | |
| 486 of 853 ns | MI350X: ACN part of a loaded access | MI350X:負載下存取中 ACN 的部分 |
Terms used on this page本頁用到的術語
- Chiplet / ACN
- A die joined with others in one package; the Accelerator Chiplet Network links compute dies, IO dies and memory.
- 與其他晶粒在同一封裝內接合的晶粒;加速器 chiplet 網路(ACN)連接運算晶粒、IO 晶粒與記憶體。
- XCD / IOD / CC
- Compute die, IO die, and chiplet cluster (one IOD, two XCDs, two HBM stacks).
- 運算晶粒、IO 晶粒,以及 chiplet cluster(一顆 IOD、兩顆 XCD、兩個 HBM 堆疊)。
- COM-IO / IO-IO / IO-MEM
- Links compute–IO die, IO die–IO die, IO die–memory.
- 運算–IO 晶粒、IO 晶粒之間、IO 晶粒–記憶體的鏈路。
- YX routing
- Move along Y, then X; deterministic, blind to load.
- 先沿 Y、再沿 X;確定且不看負載。
- Hose model
- A link described by aggregate rate limits, not per-flow demands.
- 以總速率上限而非個別流的需求描述鏈路。
- Ping (lat / bw)
- Pointer chasing on 1 CU, or a reduction on 10–16 CUs, over one XCD-to-HBM path.
- 在一條 XCD 到 HBM 路徑上,1 個 CU 的指標追逐或 10–16 個 CU 的歸約。
- DCA
- Blame a link only if every ping through it deviates.
- 只有當穿過鏈路的每個 ping 都偏離時才歸咎它。
- Backpressure storm
- An IO-MEM hotspot throttles its IOD, then every IOD.
- IO-MEM 熱點節流它的 IOD,再擴及每一顆 IOD。