The Llama 3 Herd of Models — §3.3 Infrastructure, Scaling, and EfficiencyThe Llama 3 Herd of Models — §3.3 基礎設施、擴展與效率
Section 3.3 of the Llama 3 paper is the most detailed public account of one training run at 16,000 GPUs. It describes the machine (H100 GPUs on Grand Teton servers, the Tectonic storage system, and a 24K-GPU RoCE Clos built from Minipack2 rack switches and Arista 7800 spines in pods of 3,072 GPUs with 1:7 oversubscription between pods), the four-dimensional parallelism arranged in the order [TP, CP, PP, DP] so that the most bandwidth-hungry traffic stays on NVLink and the most tolerant traffic crosses pods, the custom NCCLX library needed because stock NCCL assumed a low-latency fabric, and a table of all 466 interruptions over 54 days: 419 unexpected, 78% hardware, 58.7% GPU-related as printed (64.0% by the table's own counts), 8.4% network switches and cables. Despite a failure every few hours, effective training time stayed above 90% because recovery was automated; only three interruptions needed a human. The run used 16 flows per GPU pair with enhanced ECMP and no DCQCN, exactly the design of Meta's SIGCOMM paper, confirming it at four times the scale.
Llama 3 論文的 §3.3 是公開文獻中對單一次 16,000 顆 GPU 訓練運行最詳盡的記述。它描述了機器(Grand Teton 伺服器上的 H100、Tectonic 儲存系統,以及由 Minipack2 機櫃交換器與 Arista 7800 spine 組成、每個 pod 3,072 顆 GPU、pod 之間 1:7 超額認購的 24K GPU RoCE Clos)、依 [TP, CP, PP, DP] 順序安排的四維平行化(讓最吃頻寬的流量留在 NVLink、最能忍耐的流量跨 pod)、因為原版 NCCL 假設低延遲網路而不得不自製的 NCCLX,以及 54 天內全部 466 次中斷的表格:419 次非預期、78% 是硬體、依印刷值 58.7% 與 GPU 相關(依表中次數是 64.0%)、8.4% 是網路交換器與線纜。儘管每幾小時就有一次故障,有效訓練時間仍高於 90%,因為恢復已自動化;只有三次中斷需要人介入。這次運行使用每對 GPU 16 條流、enhanced ECMP、不用 DCQCN,正是 Meta SIGCOMM 論文的設計,在四倍的規模上得到驗證。
Reading plan (35 minutes)閱讀計畫(35 分鐘)
§3.3 is ten pages inside a 90-page model paper. Read it after the Meta RoCE paper: that paper is the design, this one is the design in use. Four sub-sections: 3.3.1 the machine, 3.3.2 the parallelism, 3.3.3 the collective library, 3.3.4 the failures. The two tables (4 and 5) carry most of the information and are reproduced below.
§3.3 是一篇 90 頁模型論文裡的十頁。請在 Meta RoCE 論文之後讀:那篇是設計,這篇是設計的實際使用。四個小節:3.3.1 機器、3.3.2 平行化、3.3.3 集體通訊函式庫、3.3.4 故障。兩張表(4 與 5)承載了大部分資訊,下面都有重現。
1. The machine1. 機器
Compute. Llama 3 405B was pre-trained on up to 16,000 NVIDIA H100 GPUs, each with 80 GB of HBM3 memory and a 700 W power rating, in Meta's Grand Teton servers: 8 GPUs and 2 CPUs per server, with the GPUs joined by NVLink. Jobs were placed by Meta's scheduler, MAST.
計算。Llama 3 405B 在最多 16,000 顆 NVIDIA H100 GPU 上預訓練,每顆有 80 GB HBM3 記憶體與 700 W 的額定功率,裝在 Meta 的 Grand Teton 伺服器:每台 8 顆 GPU 與 2 顆 CPU,GPU 之間以 NVLink 連接。任務由 Meta 的排程器 MAST 配置。
Storage. Checkpoints and data live in Tectonic, Meta's distributed file system: 240 PB on 7,500 SSD servers, delivering 2 TB/s sustained and 7 TB/s peak. Checkpoints range from 1 MB to 4 GB per GPU depending on how the model is sharded. The peak figure is what matters: when 16,000 GPUs write a checkpoint at the same moment, the file system must absorb the burst fast enough that GPUs do not sit idle. The paper calls bursty checkpoint writes a major challenge, and it later notes that the synchronized power swing of tens of thousands of GPUs pausing and resuming together reaches tens of megawatts, enough to strain the power grid.
儲存。檢查點與資料放在 Meta 的分散式檔案系統 Tectonic:7,500 台 SSD 伺服器上的 240 PB,提供 2 TB/s 持續與 7 TB/s 峰值吞吐。依模型分片方式不同,每顆 GPU 的檢查點從 1 MB 到 4 GB。峰值數字才是重點:當 16,000 顆 GPU 在同一瞬間寫檢查點,檔案系統必須夠快吸收這波突發,GPU 才不會閒置。論文稱突發的檢查點寫入是主要挑戰,後面並指出數萬顆 GPU 同時暫停與恢復造成的同步功率擺動達數十兆瓦,足以對電網造成壓力。
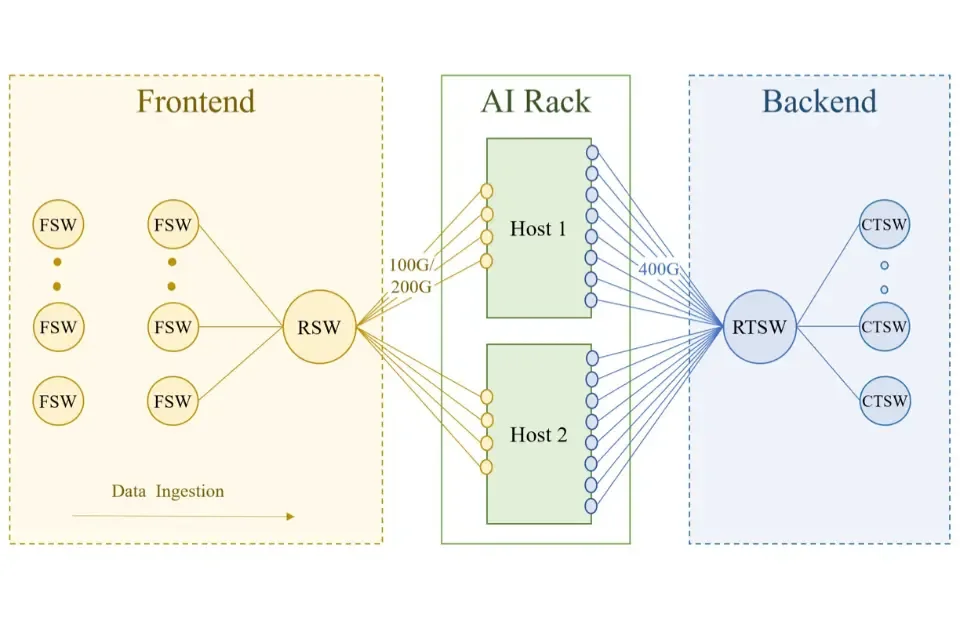
Network. Meta ran two clusters, both with 400 Gb/s per GPU. Smaller Llama 3 models trained on an NVIDIA Quantum2 InfiniBand fabric; the 405B model trained on the RoCE fabric, which is the one described in detail. It is a three-layer Clos of 24,000 GPUs built from Arista 7800 spine switches and Minipack2 rack switches (an Open Compute Project design). A rack holds two servers, 16 GPUs, under one Minipack2 ToR. 192 racks are joined by cluster switches into a pod of 3,072 GPUs with full bisection bandwidth: any half of the pod can talk to the other half at full rate. Eight pods make the 24K cluster, but the aggregation layer that joins pods is oversubscribed 1:7: there is one-seventh as much bandwidth across pods as inside them. The model-parallel layout and the scheduler are made topology-aware so that the traffic crossing pods is the kind that tolerates it. Load balancing uses 16 network flows between each pair of GPUs and enhanced ECMP hashing on extra RoCE header fields, the QP-scaling scheme from the SIGCOMM paper. For congestion, the spine switches have deep buffers to absorb transient bursts, and the paper states that with E-ECMP the 24K cluster runs without traditional congestion control such as DCQCN.
網路。Meta 運行兩個叢集,每顆 GPU 都是 400 Gb/s。較小的 Llama 3 模型在 NVIDIA Quantum2 InfiniBand 上訓練;405B 模型在 RoCE 網路上訓練,詳細描述的也是這一個。它是由 Arista 7800 spine 交換器與 Minipack2 機櫃交換器(Open Compute Project 設計)組成、24,000 顆 GPU 的三層 Clos。一個機櫃放兩台伺服器、16 顆 GPU,在一台 Minipack2 ToR 之下。192 個機櫃由叢集交換器連成一個 3,072 顆 GPU、具完整對分頻寬的 pod:pod 的任何一半都能以全速與另一半通訊。八個 pod 組成 24K 叢集,但連接各 pod 的聚合層是 1:7 超額認購:跨 pod 的頻寬只有 pod 內的七分之一。模型平行的配置與排程器都做成拓樸感知,讓跨 pod 的流量是能忍受這點的那種。負載平衡使用每對 GPU 之間 16 條網路流與對額外 RoCE 標頭欄位做雜湊的 enhanced ECMP,即 SIGCOMM 論文中的 QP scaling 方案。壅塞方面,spine 交換器有深緩衝吸收瞬間突發,論文並陳述搭配 E-ECMP 後,24K 叢集不使用 DCQCN 之類的傳統壅塞控制。
2. The parallelism order is a bandwidth order2. 平行化的順序就是頻寬的順序
Llama 3 uses four kinds of parallelism at once. Tensor parallelism (TP) splits each weight matrix across GPUs, so every layer needs collectives in the middle of its computation. Context parallelism (CP) splits a long input sequence across GPUs for the attention computation. Pipeline parallelism (PP) gives each GPU a slice of layers and passes activations stage to stage. Data parallelism (DP), implemented as FSDP, gives each group a different slice of the batch and shards the model, optimizer state and gradients across the group. The GPUs are arranged in the order [TP, CP, PP, DP], innermost first. The innermost dimension gets the fastest link: TP groups of 8 sit inside one server on NVLink. The outermost dimension gets the slowest path and can tolerate it: DP traffic can be prefetched asynchronously, so it is the one allowed to cross the 1:7 links between pods. PP sits in between; its point-to-point transfers are small and can be made asynchronous.
Llama 3 同時使用四種平行化。張量平行(TP)把每個權重矩陣切到多顆 GPU,所以每一層的計算中途都需要集體操作。上下文平行(CP)把很長的輸入序列切到多顆 GPU 做注意力計算。管線平行(PP)給每顆 GPU 一段層,把激活值一階段一階段傳下去。資料平行(DP)以 FSDP 實作,給每個群組不同的批次切片,並把模型、最佳化器狀態與梯度分片到群組內。GPU 依 [TP, CP, PP, DP] 的順序排列,最內層在前。最內層得到最快的鏈路:8 顆一組的 TP 群組落在同一台伺服器的 NVLink 上。最外層走最慢的路徑、也最能忍受:DP 的流量可以非同步預先抓取,所以它是被允許跨越 pod 之間 1:7 鏈路的那一個。PP 介於兩者之間;它的點對點傳輸很小,可以做成非同步。
Table 4 gives the three configurations used. All three keep TP=8 and PP=16 and a global batch of 16M tokens; what changes is the sequence length and how the remaining GPUs are split between CP and DP.
Table 4 給出使用的三種配置。三者都維持 TP=8、PP=16 與 16M token 的全域批次;改變的是序列長度,以及剩餘的 GPU 如何在 CP 與 DP 之間分配。
| GPUs | TP | CP | PP | DP | Seq. len. | 序列長度 | Batch / DP | 每 DP 批次 | TFLOPs/GPU | BF16 MFU |
|---|---|---|---|---|---|---|---|---|---|---|
| 8,192 | 8 | 1 | 16 | 64 | 8,192 | 32 | 430 | 43% | ||
| 16,384 | 8 | 1 | 16 | 128 | 8,192 | 16 | 400 | 41% | ||
| 16,384 | 8 | 16 | 16 | 8 | 131,072 | 16 | 380 | 38% |
Read the first two rows together: doubling the GPUs from 8K to 16K at the same sequence length doubled DP from 64 to 128 and dropped MFU from 43% to 41%, a small loss for a doubling. The third row is the long-context phase: 128K-token sequences require CP=16, which takes GPUs away from DP (down to 8) and costs another 3 points, because the and all-gathers of context parallelism are exposed in every attention layer.
把前兩行放在一起讀:在相同序列長度下 GPU 從 8K 加倍到 16K,DP 從 64 加倍到 128,MFU 從 43% 降到 41%,加倍只損失一點。第三行是長上下文階段:128K token 的序列需要 CP=16,從 DP 拿走 GPU(降到 8),再損失 3 個百分點,因為上下文平行的 、 all-gather 在每個注意力層都暴露在外。
Pipeline fixes. Three problems in the standard pipeline schedule were fixed. Existing schedules forced the number of micro-batches in flight to equal either the number of stages or the total micro-batch count; Llama's schedule makes it a free parameter. The first stage holds the embedding table and the most warm-up micro-batches, so it ran out of memory first; the fix removes one transformer layer from both the first and the last stage. The last stage computes the output projection and the loss, so it was the slowest; the interleaved schedule with chunks per rank and micro-batches brings the bubble fraction to
管線修正。標準管線排程的三個問題被修正。現有排程強迫在途的 micro-batch 數等於階段數或等於 micro-batch 總數;Llama 的排程讓它成為自由參數。第一階段持有 embedding 表與最多的暖機 micro-batch,所以最先用完記憶體;修法是從第一與最後階段各移除一層 transformer。最後階段計算輸出投影與損失,所以最慢;每個 rank 有 個 chunk、共 個 micro-batch 的交錯排程把氣泡比例降到
Point-to-point communication was made asynchronous and tensors are freed as soon as they are no longer needed, which allowed 8K-token sequences without activation checkpointing (recomputing activations in the backward pass to save memory).
點對點通訊改為非同步,張量一旦不再需要就立刻釋放,這讓 8K token 的序列不需要激活值檢查點(在反向時重算激活值以節省記憶體)。
Context parallelism and FSDP. CP uses an all-gather approach: each GPU gathers the key and value tensors of the whole sequence, then computes attention for its own chunk of queries. A ring-style scheme would overlap better, but all-gather handles irregular attention masks (such as the document mask) more easily, and grouped-query attention keeps and small so the exposed cost is modest. Sequences are split into chunks so that causal attention gives every GPU equal work. In FSDP, model shards are not re-sharded after the forward pass, which saves one all-gather in the backward pass; gradients are accumulated across micro-batches in FP32 and reduce-scattered in FP32 for numerical stability.
上下文平行與 FSDP。CP 採 all-gather 做法:每顆 GPU 收集整個序列的 key 與 value 張量,再對自己那段 query 計算注意力。環狀方案重疊得更好,但 all-gather 更容易處理不規則的注意力遮罩(例如文件遮罩),而 grouped-query attention 讓 、 很小,暴露的成本不大。序列切成 段,使因果注意力下每顆 GPU 的工作量相等。在 FSDP 中,模型分片在正向之後不再重新分片,省下反向的一次 all-gather;梯度跨 micro-batch 以 FP32 累加、以 FP32 做 reduce-scatter 以確保數值穩定。
Take row 2: , , , on 16,384 GPUs. A TP group is one server. Place the blocks on the 3,072-GPU pods (16 GPUs per rack), one question per row:
取第二行:16,384 顆 GPU 上 、、、。一個 TP 群組就是一台伺服器。把 區塊放進 3,072 顆 GPU 的 pod(每機櫃 16 顆 GPU),逐列計算如下:
| Question問題 | Calculation算式 | Result結果 |
|---|---|---|
| GPUs in one block一個 區塊的 GPU 數 | GPUs 顆 GPU | |
| Racks per block, at 16 GPUs per rack每個區塊的機櫃數(每機櫃 16 顆 GPU) | racks 個機櫃well inside a pod遠在一個 pod 之內 | |
| Blocks on 16,384 GPUs16,384 顆 GPU 上的區塊數 | blocks 個區塊one per DP rank每個 DP rank 一個 | |
| Blocks per 3,072-GPU pod每個 3,072 顆 GPU 的 pod 容納的區塊數 | blocks 個區塊 | |
| Pods spanned by the DP group of 128128 的 DP 群組橫跨的 pod 數 | pods 個 podrounded up: 6 pods進位為 6 個 pod |
So every block sits inside one pod, and the DP group of 128 spans 6 pods. The only traffic that must cross the 1:7 links is the FSDP reduce-scatter and all-gather, which is exactly the traffic the paper says can be prefetched.
所以每個區塊都落在一個 pod 內,而 128 的 DP 群組橫跨 6 個 pod。唯一必須跨越 1:7 鏈路的流量是 FSDP 的 reduce-scatter 與 all-gather,正好是論文說可以預先抓取的那種。
3. NCCLX3. NCCLX
Meta trained with NCCLX, its own fork of NVIDIA's NCCL. The reason given is latency. NCCL's algorithms move data in chunks through staged copies and exchange small control messages; these choices were made for fabrics where a round trip takes a few microseconds. In this cluster, pipeline-parallel and data-parallel traffic crosses several switches and can see tens of microseconds of latency, and at that latency NCCL's chunk sizes and copies leave the 400 Gb/s links idle between transfers. NCCLX tunes the chunking and data-transfer sizes to the measured latency and gives the small control messages priority so they are not delayed behind bulk data; this is the same clear-to-send prioritization that the SIGCOMM paper reports. The authors say deeper changes to NCCLX were still in progress.
Meta 用自己的 NCCL 分支 NCCLX 訓練。給出的理由是延遲。NCCL 的演算法透過分段複製把資料切成多個 chunk 傳送,並交換小的控制訊息;這些選擇是為往返只需幾微秒的網路而做的。在這個叢集中,管線平行與資料平行的流量跨越數台交換器,延遲可達數十微秒;在這樣的延遲下,NCCL 的 chunk 大小與複製讓 400 Gb/s 鏈路在傳輸之間閒置。NCCLX 依實測延遲調校分段與傳輸大小,並讓小的控制訊息優先、不被大量資料拖延;這與 SIGCOMM 論文報告的 clear-to-send 優先化相同。作者說 NCCLX 更深層的改動仍在進行中。
4. The failure table4. 故障表
During a 54-day snapshot of pre-training there were 466 job interruptions: 47 planned (firmware and kernel upgrades, configuration changes, dataset updates) and 419 unexpected. Of the unexpected ones, about 78% were confirmed or suspected hardware problems, and GPU-related causes alone were 58.7% as printed; the table's own counts give 268 of 419, 64.0%, and its first row, 148 faulty GPUs, is 35.3% of 419 rather than the printed 30.1%. Only three interruptions in the whole period needed significant manual intervention; the rest were handled by automation. Table 5 is reproduced in full.
在預訓練的 54 天快照期間有 466 次任務中斷:47 次預期內(韌體與核心升級、設定變更、資料集更新)與 419 次非預期。非預期中約 78% 是確認或疑似的硬體問題,單是 GPU 相關依印刷值就占 58.7%;依表中次數則是 419 次中的 268 次、64.0%,而第一列 148 次 GPU 故障是 419 次的 35.3%,不是印出的 30.1%。整個期間只有三次中斷需要顯著的人工介入;其餘由自動化處理。Table 5 完整重現如下。
| Component | 元件 | Category | 類別 | Count | 次數 | % |
|---|---|---|---|---|---|---|
| Faulty GPU | GPU 故障 | GPU | 148 | 30.1% | ||
| GPU HBM3 memory | GPU HBM3 記憶體 | GPU | 72 | 17.2% | ||
| Software bug | 軟體錯誤 | Dependency | 依賴 | 54 | 12.9% | |
| Network switch / cable | 網路交換器 / 線纜 | Network | 網路 | 35 | 8.4% | |
| Host maintenance (unplanned) | 主機維護(非預期) | Maintenance | 維護 | 32 | 7.6% | |
| GPU SRAM memory | GPU SRAM 記憶體 | GPU | 19 | 4.5% | ||
| GPU system processor | GPU 系統處理器 | GPU | 17 | 4.1% | ||
| NIC | Host | 主機 | 7 | 1.7% | ||
| NCCL watchdog timeouts | NCCL watchdog 逾時 | Unknown | 不明 | 7 | 1.7% | |
| Silent data corruption | 靜默資料損毀 | GPU | 6 | 1.4% | ||
| GPU thermal interface + sensor | GPU 熱介面 + 感測器 | GPU | 6 | 1.4% | ||
| SSD / power supply / chassis / IO board / CPU / system memory / other dependency | SSD / 電源 / 機箱 / IO 板 / CPU / 系統記憶體 / 其他依賴 | Host | 主機 | 16 | 3.9% |
How to read it. Group the rows by category. GPU hardware (faulty GPU, HBM3, SRAM, system processor, thermal, silent data corruption) is 58.7%. Software bugs are 12.9%. The network, switches and cables plus NICs, is about 10%. Hosts other than GPUs are a few percent. Two conclusions follow. First, the network is a minority cause of interruptions, which agrees with HPN's monthly failure rates and MegaScale's experience. Second, it does not matter which component fails: every one of these 466 events stopped all 16,000 GPUs, because synchronous training cannot continue with a missing rank. That is why the engineering effort goes into fast automated recovery rather than into eliminating failures. The paper also mentions silent data corruption separately: six interruptions were traced to GPUs that computed wrong answers without reporting an error, the hardest failure to detect.
怎麼讀。把行依類別分組。GPU 硬體(GPU 故障、HBM3、SRAM、系統處理器、熱、靜默資料損毀)占 58.7%。軟體錯誤 12.9%。網路——交換器與線纜加 NIC——約 10%。GPU 以外的主機元件只有幾個百分點。兩個結論。第一,網路是中斷的少數原因,與 HPN 的每月故障率及 MegaScale 的經驗一致。第二,哪個元件故障並不重要:這 466 次事件的每一次都讓全部 16,000 顆 GPU 停下,因為同步訓練少了一個 rank 就無法繼續。這就是為什麼工程心力放在快速的自動恢復,而非消除故障。論文也單獨提到靜默資料損毀:六次中斷追查到 GPU 算出錯誤答案卻沒有回報錯誤,是最難偵測的故障。
Three operational observations. Effective training time, the share of wall-clock time spent making progress, stayed above 90% even though automated maintenance caused at least one interruption every day. Throughput varied by 1–2% over each day in step with mid-day temperature: hotter GPUs lower their clock through dynamic voltage and frequency scaling. And a single straggler can slow thousands of GPUs, so Meta built tooling that ranks suspect communications from chosen process groups and lets engineers inspect the top few; the PyTorch NCCL flight recorder, which keeps a ring buffer of recent collective calls, and the ability to change configuration online supported this.
三個營運觀察。有效訓練時間——真正在前進的牆上時鐘時間比例——維持在 90% 以上,儘管自動化維護每天至少造成一次中斷。吞吐每天隨正午溫度有 1–2% 的變化:較熱的 GPU 透過動態電壓與頻率調節降低時脈。而單一 straggler 就能拖慢數千顆 GPU,所以 Meta 建了工具,對選定行程群組的可疑通訊排序,讓工程師檢查前幾名;保留近期集體呼叫環形緩衝的 PyTorch NCCL flight recorder 以及線上修改設定的能力支持了這件事。
5. Critique and context5. 評論與脈絡
This section is a report, not an analysis: it tells you what was built and what happened, with almost no explanation of alternatives considered. The topology description leaves out oversubscription inside a pod beyond "full bisection" and does not say how many flows or what buffer sizes made running without DCQCN safe; for that you need the SIGCOMM paper. The failure table covers 54 days of one run and the categories are coarse. What makes it valuable is that it is a complete, consistent snapshot: topology, parallelism, library and failures from the same run. Place it next to the SIGCOMM paper (same network, design rationale), HPN (a competing topology with 15:1 instead of 1:7 and dual-ToR instead of single ToR), and MegaScale (a comparable operations story at 12K GPUs). Meta's 2026 SIGCOMM paper describes the next network, for 100K+ GPUs, and replaces the E-ECMP-and-no-DCQCN transport this section describes.
這一節是報告而非分析:它告訴你建了什麼、發生了什麼,幾乎不解釋曾考慮過的替代方案。拓樸描述除了「完整對分」之外沒有說 pod 內的超額認購,也沒有說多少流、多大的緩衝讓不用 DCQCN 是安全的;這些要看 SIGCOMM 論文。故障表只涵蓋一次運行的 54 天,分類也粗。它的價值在於是一份完整、一致的快照:同一次運行的拓樸、平行化、函式庫與故障。把它放在 SIGCOMM 論文(同一個網路、設計理由)、HPN(競爭的拓樸,15:1 而非 1:7、dual-ToR 而非單 ToR)與 MegaScale(12K 顆 GPU 上可比較的營運故事)旁邊讀。Meta 2026 年的 SIGCOMM 論文描述下一代、十萬顆以上 GPU 的網路,並取代了這一節描述的 E-ECMP 加不用 DCQCN 的傳輸層。
Key numbers關鍵數字
| Number | 數字 | Meaning | 意義 |
|---|---|---|---|
| 16K / 24K | H100 GPUs used for 405B pre-training / GPUs in the RoCE cluster | 405B 預訓練使用的 H100 數 / RoCE 叢集的 GPU 數 | |
| 700 W / 80 GB | H100 power rating / HBM3 memory | H100 額定功率 / HBM3 記憶體 | |
| 240 PB / 7,500 / 2 → 7 TB/s | Tectonic capacity / SSD servers / sustained → peak throughput | Tectonic 容量 / SSD 伺服器數 / 持續 → 峰值吞吐 | |
| 16 / 192 / 3,072 / 8 | GPUs per rack / racks per pod / GPUs per pod / pods per cluster | 每機櫃 GPU / 每 pod 機櫃 / 每 pod GPU / 每叢集 pod | |
| 1:7 | Oversubscription at the aggregation layer between pods | pod 之間聚合層的超額認購 | |
| 16 flows | Network flows per GPU pair, spread by E-ECMP; no DCQCN | 每對 GPU 的網路流數,由 E-ECMP 分散;不用 DCQCN | |
| [TP, CP, PP, DP] | Parallelism order, innermost first; TP=8, PP=16 in all runs | 平行化順序,最內層在前;所有運行 TP=8、PP=16 | |
| 43% / 41% / 38% | BF16 MFU at 8K GPUs / 16K GPUs / 16K with 128K-token context (CP=16) | 8K GPU / 16K GPU / 16K 加 128K token 上下文(CP=16)的 BF16 MFU | |
| 466 / 47 / 419 | Interruptions in 54 days / planned / unexpected | 54 天的中斷 / 預期 / 非預期 | |
| 78% / 58.7% / 8.4% | Unexpected interruptions from hardware / from GPUs / from switches and cables | 非預期中斷來自硬體 / GPU / 交換器與線纜的比例 | |
| 3 / >90% / 1–2% | Interruptions needing manual work / effective training time / diurnal throughput swing | 需要人工的中斷次數 / 有效訓練時間 / 每日吞吐擺動 |
Terms used in this section本節用到的術語
- Pod
- 192 racks, 3,072 GPUs, joined with full bisection bandwidth; eight pods form the cluster with 1:7 oversubscription between them.
- 192 個機櫃、3,072 顆 GPU,以完整對分頻寬連接;八個 pod 組成叢集,彼此之間 1:7 超額認購。
- Full bisection bandwidth
- Any half of a set of GPUs can send to the other half at full rate simultaneously.
- 一組 GPU 的任何一半都能同時以全速送給另一半。
- Context parallelism (CP)
- Splitting one long sequence across GPUs for attention; Llama 3 gathers and and computes attention for the local chunk.
- 把一條長序列切到多顆 GPU 做注意力;Llama 3 收集 、 並對本地的 段計算注意力。
- FSDP
- Fully sharded data parallelism: model, gradients and optimizer state are sharded across the DP group and gathered just in time.
- 完全分片的資料平行:模型、梯度與最佳化器狀態分片到 DP 群組,在需要時才收集。
- NCCLX
- Meta's fork of NCCL with chunk sizes and control-message priority tuned for a multi-hop, tens-of-microseconds fabric.
- Meta 的 NCCL 分支,針對多跳、數十微秒延遲的網路調校 chunk 大小與控制訊息優先權。
- Effective training time
- The share of wall-clock time during which the job makes forward progress; above 90% in this run.
- 任務真正在前進的牆上時鐘時間比例;這次運行高於 90%。
- Silent data corruption
- A GPU producing wrong results without signaling an error; six interruptions were attributed to it.
- GPU 產生錯誤結果卻不發出錯誤訊號;六次中斷歸因於此。