R-Pingmesh: A Service-Aware RoCE Network Monitoring and Diagnostic SystemR-Pingmesh:服務感知的 RoCE 網路監控與診斷系統
After reading, you can explain how R-Pingmesh decides within 20 seconds whether a slow training job is the network's fault, and which RNIC or switch link is to blame.讀完後,你能說明 R-Pingmesh 如何在 20 秒內判斷訓練任務變慢是不是網路的錯,以及該怪哪一張 RNIC 或哪一條交換器鏈路。
A training job on thousands of GPUs slows or stops when one RNIC or switch port flaps. Is the network to blame? NCCL's error 12 also appears when a remote GPU process dies, and the RTT of a TCP ping rises with host CPU load. R-Pingmesh, the monitor of ByteDance's RoCE training clusters, sends RoCE probes between RNICs. Timestamps that the RNICs record split each round trip into network time and host time. Probes among the RNICs under one ToR separate a bad RNIC from a bad switch, and probes that copy the job's 5-tuples follow the job's ECMP paths. Every 20 s an Analyzer classifies each timeout, votes on the faulty link and grades the problem by its impact on the job. In one month on a cluster of thousands of GPU servers it located 207 problems. All 157 switch reports were right, but only 20 of the 50 RNIC reports: 85% overall.
跨數千顆 GPU 的訓練任務,只要一張 RNIC 或一個交換器埠抖動(flap),就會變慢或停下。該怪網路嗎?遠端 GPU 行程死掉時也會出現 NCCL 的 error 12,而 TCP ping 的 RTT 會隨主機 CPU 負載上升。R-Pingmesh 是字節跳動 RoCE 訓練叢集的監控系統,在 RNIC 之間發送 RoCE 探測。RNIC 記錄的時間戳把每次往返拆成網路時間與主機時間。同一台 ToR 下各 RNIC 之間的探測,把壞掉的 RNIC 與壞掉的交換器分開;複製任務 5-tuple 的探測,走的就是任務的 ECMP 路徑。Analyzer 每 20 秒把每個逾時分類、對故障鏈路投票,並依對任務的影響為問題分級。在一個有數千台 GPU 伺服器的叢集上,一個月內它定位了 207 個問題。157 個交換器報告全部正確,50 個 RNIC 報告卻只有 20 個正確:整體 85%。
1. Where this paper sits1. 這篇論文的位置
Section 10.4 explains MegaScale's recovery loop. A heartbeat with RDMA traffic counters raises an alarm, and then loopback, NIC-to-NIC and NCCL tests run on the suspect nodes. In the overhead formula , this loop is the detection term : under 10 minutes on average, diagnosis included. The loop does not give an always-on answer, before anyone stops the job, to two questions. Is the network to blame? If it is, which RNIC or which link? Tests of single RNICs miss the job's real paths, because ECMP puts the job on only some of the links. R-Pingmesh extends Pingmesh, Microsoft's TCP latency monitor (SIGCOMM 2015), to RDMA. Queue pairs and PFC are in Chapter 7, ECMP hashing in Chapter 8.
第 10.4 節說明 MegaScale 的恢復迴圈:帶著 RDMA 流量計數器的心跳發出警報,接著在可疑節點上執行迴路、NIC 對 NIC 與 NCCL 測試。在開銷公式 中,這個迴圈就是偵測項 :平均低於 10 分鐘,含診斷。這個迴圈無法在任何人停下任務之前,持續回答兩個問題:該怪網路嗎?如果是,是哪一張 RNIC 或哪一條鏈路?單張 RNIC 的測試測不到任務真正走的路徑,因為 ECMP 只把任務放在部分鏈路上。R-Pingmesh 把 Pingmesh(Microsoft 的 TCP 延遲監控系統,SIGCOMM 2015)延伸到 RDMA。queue pair 與 PFC 見第 7 章,ECMP 雜湊見第 8 章。
2. The problem, measured2. 問題,用量測說話
ByteDance's RoCE network grew from hundreds of RNICs to tens of thousands in one year. Training has a barrel effect: the job runs at the speed of its weakest part. The paper's Figure 1 shows a cluster's training throughput falling, at times to zero, while one switch port or RNIC flaps. Four things make this hard to manage:
字節跳動的 RoCE 網路在一年內從數百張 RNIC 成長到數萬張。訓練有木桶效應(barrel effect):任務以最弱零件的速度前進。論文的 Figure 1 顯示,一個交換器埠或一張 RNIC 抖動時,叢集的訓練吞吐下跌,有時跌到零。有四件事讓它難以管理:
- Symptoms do not name the cause. NCCL error 12, an RDMA timeout, comes from a dead RNIC but also from a remote process whose GPU failed. A compute slowdown looks like lower network throughput.症狀不會說出原因。NCCL error 12 是 RDMA 逾時,可能來自死掉的 RNIC,也可能來自 GPU 故障而結束的遠端行程。計算變慢看起來也像網路吞吐變低。
- Failure drops are frequent. PFC stops congestion drops, but flapping ports, aged fiber and misconfigured switches still drop packets.故障丟包很常見。PFC 擋住壅塞丟包,但抖動的埠、老化的光纖與設定錯誤的交換器仍會丟包。
- Bottlenecks hide, for example in ECMP hash collisions, or in one host that CPU-heavy TCP model loading overloads.瓶頸會躲起來,例如 ECMP 雜湊碰撞,或一台被吃 CPU 的 TCP 模型載入壓垮的主機。
- TCP Pingmesh cannot see RoCE. Its probes use other switch queues. It cannot tell an RNIC drop from a switch drop; operators needed several to tens of minutes to place a drop. Its software RTT includes the CPUs of both hosts.TCP Pingmesh 看不到 RoCE。它的探測走其他交換器佇列;它分不出 RNIC 丟包與交換器丟包,營運人員要花數分鐘到數十分鐘才能確認丟包位置;它的軟體 RTT 混入了兩端主機的 CPU。
The last point is measured. The paper's Figure 2 (below) shows Pingmesh's P99 TCP RTT in a production cluster rising and falling with the average host load over about 16 hours. RoCE RTT is typically tens of microseconds, so an RTT that follows the CPU can neither blame nor clear the network.
最後一點有量測佐證。論文的 Figure 2(下圖)顯示,一個生產叢集約 16 小時內 Pingmesh 的 P99 TCP RTT 隨主機平均負載起落。RoCE 的 RTT 通常是數十微秒,所以跟著 CPU 起伏的 RTT,既不能把錯推給網路,也不能替網路洗清嫌疑。
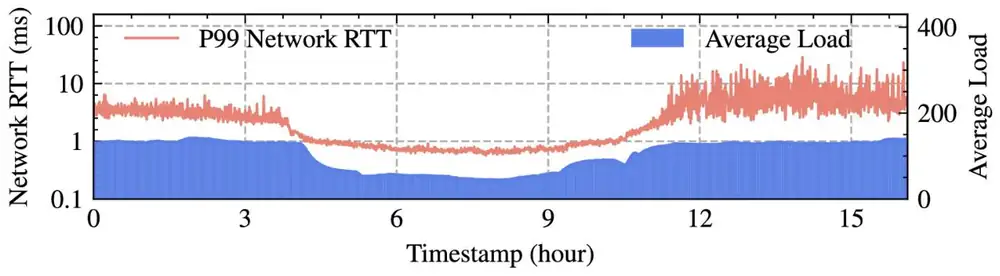
The paper also defines what an answer contains. A problem on the job's paths is P0 if its impact passes the threshold set by the job's team (fix at once), and P1 if not (fix by cost and benefit). A problem outside the job's paths is P2: real, but not this job's cause. If a job is slow and no P0 or P1 problem exists, the network is innocent.
論文也定義了答案的內容。在任務路徑上的問題,若影響超過任務團隊所訂的門檻就是 P0(立即修復),否則是 P1(依成本效益決定)。在任務路徑之外的問題是 P2:真實存在,但不是這個任務的原因。如果任務變慢而沒有任何 P0 或 P1 問題,網路就是清白的。
3. The design3. 設計
An Agent on every host sends probes, answers probes, traces paths and uploads the results. A Controller stores each RNIC's GID and QPN, the RDMA address and port, and builds the probe lists, called pinglists. An Analyzer turns the uploads into verdicts every 20 s.
每台主機上的 Agent 發送探測、回應探測、追蹤路徑並上傳結果。Controller 儲存每張 RNIC 的 GID 與 QPN(RDMA 世界的位址與埠號),並建立探測清單,稱為 pinglist。Analyzer 每 20 秒把上傳的資料變成判定。
3.1 Six timestamps on one queue pair3.1 一個 queue pair 上的六個時間戳
Commodity RNICs timestamp only their completion queue entries (CQEs), the records an RNIC writes when a work request finishes, and the RNIC clock is not synchronized with the CPU. R-Pingmesh uses six instants (Figure 1). The prober's application posts the probe () and its RNIC sends it (). The responder RNIC receives it () and sends a reply, ACK1 (). The prober RNIC receives ACK1 (), and the prober's application sees it ().
一般商用 RNIC 只在完成佇列項目(CQE,RNIC 在工作請求完成時寫下的紀錄)上加時間戳,而且 RNIC 時鐘與 CPU 不同步。R-Pingmesh 使用六個時刻(圖 1)。探測端應用程式送出探測(),它的 RNIC 把探測送出()。回應端 RNIC 收到探測(),並送出回覆 ACK1()。探測端 RNIC 收到 ACK1(),探測端應用程式看到它()。
Each difference subtracts two readings of one clock, so no synchronization is needed:
每個差值都是同一個時鐘的兩個讀數相減,所以不需要同步:
The responder learns only after ACK1 has left, so a second reply, ACK2, carries . A reply later than 500 ms makes the probe a timeout. The type of queue pair matters (Table 1 of the paper). A Reliable Connection (RC) writes its send CQE only after the ACK returns, so and do not exist. An Unreliable Datagram (UD) writes it when the packet leaves:
回應端要等 ACK1 送出後才知道 ,所以由第二個回覆 ACK2 帶回 。回覆晚於 500 ms,這次探測就算逾時。queue pair 的類型很重要(論文 Table 1)。Reliable Connection(RC)要等 ACK 回來才寫下送出的 CQE,所以 與 不存在。Unreliable Datagram(UD)在封包離開時就寫下:
| Queue pairQueue pair | Network RTT網路 RTT | Connection cost連線成本 |
|---|---|---|
| RC | not accurate不準確 | one per destination: fills the RNIC's context cache每個目的地一個:塞滿 RNIC 的情境快取 |
| UC | accurate準確 | one per destination每個目的地一個 |
| UD | accurate準確 | one per RNIC reaches every peer每張 RNIC 一個就能到達所有同伴 |
3.2 Three probe lists3.2 三種探測清單
Every Agent probes from three pinglists (Figure 2), each for a different question. The Controller builds the first two; the Agent builds the third itself from the job's own connections.
每個 Agent 依三份 pinglist 探測(圖 2),各自回答不同的問題。前兩份由 Controller 建立;第三份由 Agent 依任務自己的連線建立。
ToR-mesh. Every RNIC probes every other RNIC under its top-of-rack switch (ToR), at 10 probes per second per RNIC. Such a probe crosses only two host links and the ToR. If many probes to one RNIC fail together, the fault is in that RNIC, its cable or its ToR port, which the paper calls an "RNIC problem".
ToR-mesh。每張 RNIC 探測同一台機櫃頂端交換器(ToR)下的每一張其他 RNIC,每張 RNIC 每秒 10 次。這種探測只經過兩條主機鏈路與那台 ToR。若送往某張 RNIC 的探測大量同時失敗,故障就在那張 RNIC、它的線纜或它的 ToR 埠,論文稱之為「RNIC 問題」。
Inter-ToR. Random 5-tuples between ToRs cover the links above the ToRs. ECMP hashes each one onto one of the parallel paths between two ToRs. To cover all paths with probability , a ToR needs the smallest for which the chance of missing a path, counted by inclusion–exclusion, is at most (Equation 1 of the paper, a coupon-collector bound):
Inter-ToR。ToR 之間的隨機 5-tuple 涵蓋 ToR 以上的鏈路。ECMP 把每個 5-tuple 雜湊到兩台 ToR 之間 條平行路徑中的一條。要以機率 涵蓋全部路徑,一台 ToR 需要最小的 ,使以排容原理算出的「漏掉某條路徑」機率不超過 (論文 Equation 1,集券問題的界):
The paper uses . Our exact solution is for and for , close to : twice the paths need more than twice the tuples. The Controller replaces 20% of the tuples every hour, so a fault that drops only some 5-tuples cannot hide for long.
論文用 。我們算出的精確解是 時 、 時 ,接近 :路徑加倍,需要的 tuple 不只加倍。Controller 每小時換掉 20% 的 tuple,讓只丟某些 5-tuple 的故障無法長期躲藏。
Service Tracing. RoCE lets the sender choose the UDP source port, and ECMP hashes the 5-tuple. So a probe that copies a job's 5-tuple takes the job's path (Section 8.6). The Agent captures the job's RC connections with eBPF hooks on the kernel calls modify_qp and destroy_qp, which set up and close them. Connections change rarely, so the hooks cost little. Agents also traceroute every probe path in advance, so the Analyzer can localize at once.
Service Tracing。RoCE 讓發送端選擇 UDP 來源埠,而 ECMP 依 5-tuple 雜湊。所以複製任務 5-tuple 的探測,走的就是任務的路徑(第 10 章 06 第 6 節)。Agent 用 eBPF 掛在建立與關閉 RC 連線的核心呼叫 modify_qp 與 destroy_qp 上,取得任務的連線。連線很少變動,所以掛鉤成本很低。Agent 也事先對每條探測路徑執行 traceroute,讓 Analyzer 能立刻定位。
3.3 The Analyzer: classify, vote, grade3.3 Analyzer:分類、投票、分級
Every 20 s the Analyzer sorts the period's timeouts in a fixed order (Figure 3):
Analyzer 每 20 秒以固定順序整理這個週期的逾時(圖 3):
- Host down: the target's Agent has uploaded nothing for more than 20 s.主機當機:目標的 Agent 超過 20 秒沒有上傳任何東西。
- Stale QPN: the target restarted, so its queue-pair number changed. This is probe noise.過時的 QPN:目標重啟過,queue pair 編號已改變。這是探測雜訊。
- RNIC problem: more than 10% of the probes to one RNIC timed out. For one minute, its timeouts are charged to it and kept out of step 4.RNIC 問題:送往某張 RNIC 的探測有超過 10% 逾時。接下來一分鐘,它的逾時都算在它身上,也不進入第 4 步。
- Switch problem: the rest go to Algorithm 1, a binary network tomography. Each link on a failing probe or ACK path gets one vote, and the most-voted link is the suspect.交換器問題:其餘的交給 Algorithm 1,一種二元網路斷層掃描(binary network tomography)。失敗的探測或 ACK 路徑上的每條鏈路得一票,票數最多的鏈路就是嫌疑者。
- Impact: a problem on the job's paths is P0 or P1 by the job's metric; any other problem is P2.影響:在任務路徑上的問題依任務指標定為 P0 或 P1;其他問題是 P2。
The panel runs these steps on a small fabric. Pick a fault and see which step catches it.
下面的面板在一個小型網路上執行這些步驟。選一個故障,看哪一步抓到它。
4. Implementation4. 實作
The Controller and the Analyzer were adapted from the Pingmesh code. The Agent was written from scratch on the rdma-core verbs library, with four threads per RNIC: ToR-mesh, inter-ToR, Service Tracing and responding. The settings: probes and ACKs carrying 50 bytes of data; a 500 ms timeout; Service Tracing every 10 ms; more than 10 probes per second in each direction on every link above the ToR; uploads every 5 s; pinglists rebuilt every 5 minutes.
Controller 與 Analyzer 改寫自 Pingmesh 的程式碼。Agent 以 rdma-core verbs 函式庫從頭撰寫,每張 RNIC 執行四個執行緒:ToR-mesh、inter-ToR、Service Tracing 與回應。設定值:探測與 ACK 各帶 50 位元組的資料;500 ms 逾時;Service Tracing 每 10 ms 一次;ToR 以上每條鏈路每個方向每秒超過 10 次探測;每 5 秒上傳;每 5 分鐘重建 pinglist。
5. What was measured5. 量到了什麼
R-Pingmesh had run for more than six months on clusters with tens of thousands of RNICs. The evaluation cluster has thousands of 8-RNIC GPU servers in a three-tier Clos of Tomahawk 4 switches (64 ports of 400 Gb/s, 1:1). Every result is a production observation that operators confirmed. There is no baseline system and no fault injection. The paper's Figure 5 (below) shows one job over about 75 minutes.
R-Pingmesh 已在共有數萬張 RNIC 的叢集上執行超過六個月。評估叢集有數千台各帶 8 張 RNIC 的 GPU 伺服器,組成 Tomahawk 4 交換器的三層 Clos(64 個 400 Gb/s 埠,1:1)。每個結果都是營運人員確認過的生產環境觀察。沒有對照系統,也沒有故障注入。論文的 Figure 5(下圖)顯示一個任務約 75 分鐘的紀錄。
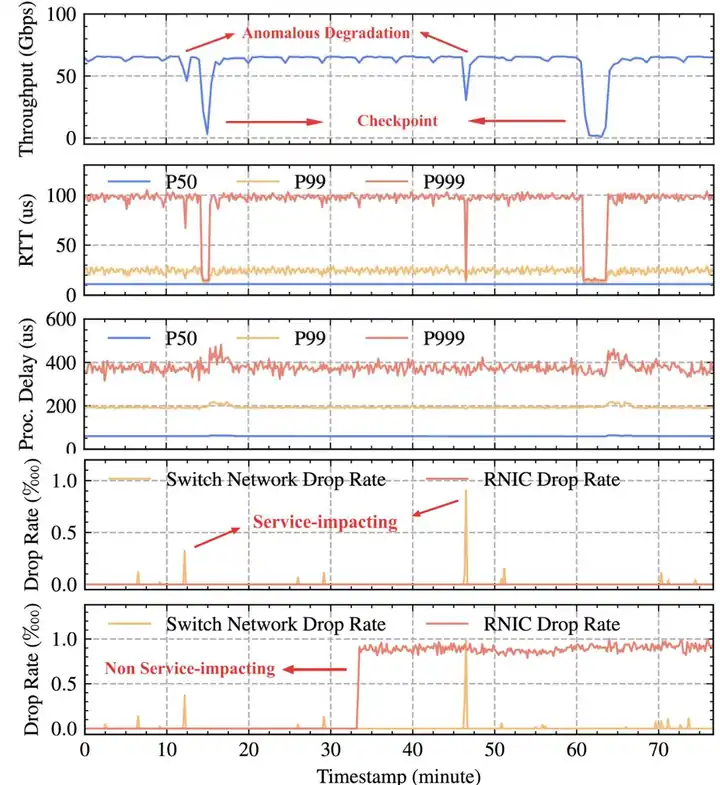
In that trace, two throughput dips match switch drops that both Service Tracing and the cluster lists saw within one 20 s period, so they are P0 or P1. An RNIC that dropped packets all the time sat outside the job's network, so it was P2.
在那段紀錄裡,兩次吞吐下降對上 Service Tracing 與叢集清單都在同一個 20 秒週期內看到的交換器丟包,所以是 P0 或 P1。一張持續丟包的 RNIC 位於任務網路之外,所以是 P2。
| Test測試 | Measured實測結果 |
|---|---|
| Localization, one month定位,一個月 | 207 problems, each located within one 20 s period; 157 switch-network problems, all confirmed; 50 RNIC problems, 20 confirmed207 個問題,每個都在一個 20 秒週期內定位;157 個交換器網路問題全部確認;50 個 RNIC 問題,20 個確認 |
| Agent cost, 8-RNIC host, 15 daysAgent 成本,8 張 RNIC 主機,15 天 | about 3% of one core and 18.5 MB; under 150 probes/s and 300 Kb/s per RNIC約一顆核心的 3% 與 18.5 MB;每張 RNIC 每秒不到 150 次探測、不到 300 Kb/s |
| "Not the network" (Figure 9)「不是網路」(Figure 9) | training rate fell while network RTT also fell and processing delay stayed flat; the cause was a bug in the training code訓練速率下降,網路 RTT 也下降,處理延遲持平;原因是訓練程式碼的錯誤 |
| Tail RTT (Figure 11)尾端 RTT(Figure 11) | under DCQCN, AllReduce 35 µs and 99 µs, All2All 537 µs and 3.4 ms; All2All with the authors' own congestion control 153 µs and 322 µs (P99, P999 as we read the figure)DCQCN 下 AllReduce 35 µs 與 99 µs、All2All 537 µs 與 3.4 ms;All2All 改用作者自己的壅塞控制為 153 µs 與 322 µs(依我們對圖的判讀為 P99、P999) |
The localization counts give two ratios:
定位的計數給出兩個比例:
| Question問題 | Calculation算式 | Result結果 |
|---|---|---|
| Share of the 207 reports that were right207 份報告中正確的比例 | ||
| Precision of the RNIC reportsRNIC 報告的精確度 |
The 30 false RNIC reports had one cause: the training job kept the Agent's CPU busy, so ACKs left late. Probes to several RNICs of one host then time out together and briefly, which real RNIC faults rarely do. The Analyzer now treats that pattern as suspect and checks the responder's processing delay.
30 個 RNIC 誤報只有一個原因:訓練任務占住了 Agent 的 CPU,使 ACK 晚送出。於是送往同一主機多張 RNIC 的探測一起、短暫地逾時,而真正的 RNIC 故障很少如此。Analyzer 現在把這種模式視為可疑,並檢查回應端的處理延遲。
Six months of deployment found 14 problem types (Table 2 of the paper), and six of them make a job fail. Flapping RNIC or switch ports were the most common hardware failure. Others were packet corruption, PFC deadlock, a lost GID index, ACL errors, wrong PFC headroom, ECMP congestion, CPU overload and PCIe downgrades. In one case a PCIe downgrade or misconfiguration starved an RNIC, whose PFC pauses grew into a PFC storm. Service Tracing saw a high P99 RTT, and the ToR-mesh pointed at the RNIC.
六個月的部署找到 14 類問題(論文 Table 2),其中 6 類會讓任務失敗。RNIC 或交換器埠抖動是最常見的硬體故障。其他包括封包損毀、PFC 死結、GID index 遺失、ACL 錯誤、PFC headroom 錯誤、ECMP 壅塞、CPU 過載與 PCIe 降級。有一次 PCIe 降級或設定錯誤餓死了一張 RNIC,它的 PFC 暫停擴散成 PFC 風暴。Service Tracing 看到很高的 P99 RTT,ToR-mesh 則指向那張 RNIC。
6. Limits and open questions6. 限制與未解的問題
- GPUs are invisible (the paper's own limit). Probes start from host memory, and probing from GPU memory would need a GPU process, which takes at least a few hundred MB of GPU memory.看不到 GPU(論文自述)。探測從主機記憶體出發;改從 GPU 記憶體探測需要一個 GPU 行程,而它至少占用數百 MB 的 GPU 記憶體。
- A location, not a cause (own). An RNIC, its cable and its ToR port look the same, and operators still read counters and logs. Automatic isolation is future work.只有位置,沒有原因(論文自述)。RNIC、它的線纜與 ToR 埠看起來一樣,營運人員仍要讀計數器與日誌。自動隔離是未來工作。
- Path tracing (own). Traceroute depends on switch CPUs, and InfiniBand's adaptive routing breaks it.路徑追蹤(論文自述)。Traceroute 依賴交換器 CPU,InfiniBand 的自適應路由會讓它失效。
- 40% precision for RNIC reports. The busy-CPU check came after the evaluation, and nobody measured accuracy again. Recall was never measured.RNIC 報告精確度只有 40%。忙碌 CPU 的檢查是評估之後才加的,沒有人重新量測準確度。召回率從未量測。
- 20 s is the analysis period, which sets how often reports come out, not a measured distribution of the time to report.20 秒是分析週期,決定多久產生一次報告,不是量到的回報時間分布。
- Copying 5-tuples needs eBPF in the host kernel. The SkeletonHunter digest shows why that fails in a container cloud.複製 5-tuple 需要在主機核心裡執行 eBPF。SkeletonHunter 導讀說明為何它在容器雲裡行不通。
7. How it connects7. 與其他內容的關聯
- Chapter 10, sections 1 and 4: the network caused about 10% of Llama 3's interruptions, and R-Pingmesh separates those from faults that only look like them. It is an always-on form of MegaScale's NIC-to-NIC tests, but it does not evict anything.第 10 章 第 1 與第 4 節:Llama 3 的中斷約 10% 由網路造成,R-Pingmesh 把這些與只是看起來像的故障分開。它是 MegaScale NIC 對 NIC 測試的常駐版本,但不逐出任何東西。
- Section 10.5: the RDMA retry count raised to its maximum, 7, matches MegaScale's flap fix, and HPN's dual-ToR survives the link that R-Pingmesh finds.第 10 章 09 第 5 節:把 RDMA 重試次數調到上限 7,與 MegaScale 對抖動的修正一致;HPN 的 dual-ToR 能撐過 R-Pingmesh 找到的那條壞鏈路。
- Chapter 7: UD versus RC is queue-pair semantics at work, the PFC storm is a production case, and Figure 11 measures DCQCN tail RTT under all-to-all.第 7 章:UD 與 RC 的選擇是 queue pair 語意的應用,PFC 風暴是生產環境的案例,Figure 11 量到 all-to-all 下 DCQCN 的尾端 RTT。
- The next digests: SkeletonHunter brings probe-and-vote to a multi-tenant container cloud. Minder, from the same ByteDance team, finds the faulty machine from host metrics. TPUv4 resiliency needs no probes, because its links report their own health.接下來的導讀:SkeletonHunter 把探測加投票帶到多租戶容器雲。Minder 出自同一個字節跳動團隊,從主機指標找出故障機器。TPUv4 resiliency 不需要探測,因為它的鏈路自己回報健康狀態。
Key numbers關鍵數字
| Number | 數字 | Meaning (production unless noted) | 意義(除非另註,皆為生產環境) |
|---|---|---|---|
| 207 / 157 / 50 | Problems in one month / switch, all confirmed / RNIC, 20 confirmed | 一個月的問題 / 交換器,全部確認 / RNIC,20 個確認 | |
| 85% / 40% | Overall accuracy / precision of RNIC reports | 整體準確度 / RNIC 報告的精確度 | |
| 20 s | Analysis period; each problem was located within one | 分析週期;每個問題都在一個週期內定位 | |
| 3% / 18.5 MB | Agent CPU (one core) and memory, 8-RNIC host | 8 張 RNIC 主機上 Agent 的 CPU(單核)與記憶體 | |
| 537 µs / 3.4 ms | All2All tail RTT under DCQCN (AllReduce: 35 / 99 µs) | DCQCN 下 All2All 的尾端 RTT(AllReduce:35 / 99 µs) | |
| 255 | 5-tuples to cover 32 paths at (our analysis) | 以 涵蓋 32 條路徑所需的 5-tuple(我們的分析) |
Terms used on this page本頁用到的術語
- CQE
- Completion queue entry: the record an RNIC writes when a work request finishes, with a timestamp.
- 完成佇列項目:RNIC 在工作請求完成時寫下的紀錄,附時間戳。
- RC / UD
- Reliable Connection: acknowledged, one queue pair per destination. Unreliable Datagram: one queue pair reaches any peer.
- Reliable Connection:有確認,每個目的地一個 queue pair。Unreliable Datagram:一個 queue pair 可到達任何同伴。
- ToR-mesh
- Probing among all RNICs under one ToR, to pin a fault on an RNIC, its cable or its ToR port.
- 在同一台 ToR 下所有 RNIC 之間探測,把故障釘在某張 RNIC、它的線纜或 ToR 埠上。
- Service Tracing
- Probing with a running job's own 5-tuples, so that probes take the job's paths.
- 用執行中任務自己的 5-tuple 探測,讓探測走任務的路徑。
- Network tomography
- Inferring bad links from failing end-to-end paths; here, the link that most failing paths share.
- 從失敗的端到端路徑推斷壞鏈路;這裡是最多失敗路徑共用的鏈路。
- P0 / P1 / P2
- On the job's paths and past its threshold / on its paths, below the threshold / outside its network.
- 在任務路徑上且超過門檻 / 在路徑上但未達門檻 / 在任務網路之外。