SkeletonHunter: Diagnosing and Localizing Network Failures in Containerized Large Model TrainingSkeletonHunter:診斷與定位容器化大模型訓練中的網路故障
After reading, you can explain how SkeletonHunter infers, from outside the container, which paths a training job uses, probes only those, and places each failure in the overlay, the underlay or the RNIC.讀完後,你能說明 SkeletonHunter 如何從容器外推斷訓練任務用了哪些路徑、只探測這些路徑,並把每個故障歸到 overlay、underlay 或 RNIC。
Alibaba Cloud rents RDMA-connected GPU containers for training. A network failure there is hard to catch. Containers live for minutes, each one binds up to eight RNICs, and every path crosses a virtual overlay on top of the physical fabric. Probing every pair costs too much, and random sampling misses the pairs that matter. SkeletonHunter probes only the job's traffic skeleton, the pairs that the job really uses. It infers them without seeing inside the tenant's container: it keeps same-rail pairs, waits until each container is ready, and then clusters RNICs by the spectrum of their traffic bursts to recover the parallelism groups. It tests latency at two time scales and places each failure in the overlay, the underlay or the RNIC's offloaded flow table. In six months of production it detected 4,816 failures with 98.2% precision and 99.3% recall, in about 8 s on average.
阿里雲出租以 RDMA 互連的 GPU 容器供訓練使用。在那裡,網路故障很難抓:容器只存活幾分鐘,每個容器綁定最多八張 RNIC,每條路徑都穿過疊在實體網路上的虛擬 overlay。探測每一對成本太高,隨機抽樣又會漏掉真正重要的配對。SkeletonHunter 只探測任務的流量骨架(traffic skeleton),也就是任務真正使用的配對。它不必看進租戶的容器就能推斷出這些配對:保留同一 rail 的配對、等每個容器就緒,再依流量突發的頻譜把 RNIC 分群,還原出平行群組。它在兩個時間尺度上檢驗延遲,並把每個故障歸到 overlay、underlay 或 RNIC 卸載的流表。在六個月的生產運行中,它偵測到 4,816 次故障,精確度 98.2%、召回率 99.3%,平均約 8 秒偵測到。
1. Where this paper sits1. 這篇論文的位置
The R-Pingmesh digest showed probing and voting on ByteDance's own hosts, where an eBPF hook in the host kernel copies each job's 5-tuples. In a container cloud that fails. The provider cannot modify or hook the RDMA stack inside a tenant's container, and it does not know the job's structure. The detection term of Section 10.4 matters just as much here: the paper notes that a connectivity loss longer than 4 s can time out a collective and fail the task.
R-Pingmesh 導讀展示了在字節跳動自己的主機上探測與投票,主機核心裡的 eBPF 掛鉤可以複製每個任務的 5-tuple。在容器雲裡這行不通:服務商不能修改或掛鉤租戶容器內的 RDMA 協定堆疊,也不知道任務的結構。第 10.4 節的偵測項 在這裡同樣重要:論文指出,連線中斷超過 4 秒就可能讓集體通訊逾時、任務失敗。
Two terms are needed. The underlay is the physical fabric: RNICs, cables and switches. The overlay is the tenant's virtual network on top of it. Each container gets a virtual function (VF) of an RNIC through SR-IOV, Open vSwitch (OVS) holds the forwarding rules, and VXLAN wraps tenant packets in UDP. Most rules and the encapsulation are offloaded into the RNIC's embedded switch, so the RNIC is where the two layers meet. Rails (Chapter 6, section 3) and parallelism groups (Chapter 3) are the other prerequisites.
需要兩個術語。underlay 是實體網路:RNIC、線纜與交換器。overlay 是疊在上面的租戶虛擬網路。每個容器透過 SR-IOV 取得 RNIC 的一個虛擬功能(VF),Open vSwitch(OVS)保存轉送規則,VXLAN 把租戶封包包進 UDP。大部分規則與封裝都卸載到 RNIC 的內建交換器,所以 RNIC 就是兩層交會的地方。rail(第 6 章 第 3 節)與平行群組(第 3 章)是另外的先備知識。
2. The problem, measured2. 問題,用量測說話
Alibaba's platform has more than 40K RNICs and 40K GPUs and has served about 5M training tasks over three years. Its RoCE target is an RTT under 20 µs with zero loss. Four production measurements explain why the network is hard to watch (Figure 1).
阿里的平台有超過 4 萬張 RNIC 與 4 萬顆 GPU,三年來服務了約 500 萬個訓練任務。它的 RoCE 目標是 RTT 低於 20 µs 且零丟包。四項生產環境量測說明為何這個網路難以監看(圖 1)。
The four facts multiply. In the paper's example, 1K containers × 8 RNICs × 16 virtual components make 128K components to check in each training round of about 30 s. Monitoring every virtual switch fully is too heavy. Random sampling, as in Pingmesh, misses the pairs that the job uses and so gives false negatives. A container that is still starting looks broken if it is probed.
這四項事實會相乘。論文的例子是:1K 個容器 × 8 張 RNIC × 16 個虛擬元件,每個約 30 秒的訓練回合就有 128K 個元件要檢查。完整監看每個虛擬交換器太重。像 Pingmesh 那樣隨機抽樣,會漏掉任務實際使用的配對,造成漏報。還在啟動中的容器若被探測,看起來就像壞了。
3. The design3. 設計
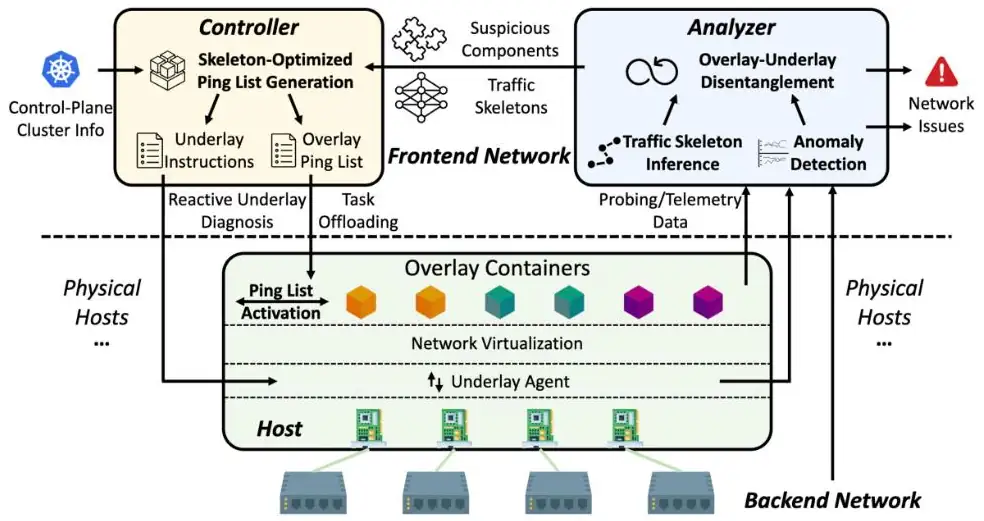
As in R-Pingmesh, a controller builds ping lists, agents probe and report latency and loss, and an analyzer decides. An overlay agent runs as a sidecar container in each training container's network namespace, and an underlay agent runs on each host. Clocks are synchronized with PTP, so that latency can be measured end to end.
和 R-Pingmesh 一樣,controller 建立探測清單,agent 探測並回報延遲與丟包,analyzer 做判斷。overlay agent 以 sidecar 容器的形式執行,共用每個訓練容器的網路命名空間;underlay agent 則在每台主機上執行。時鐘以 PTP 同步,所以能量測端到端延遲。
3.1 Inferring the traffic skeleton3.1 推斷流量骨架
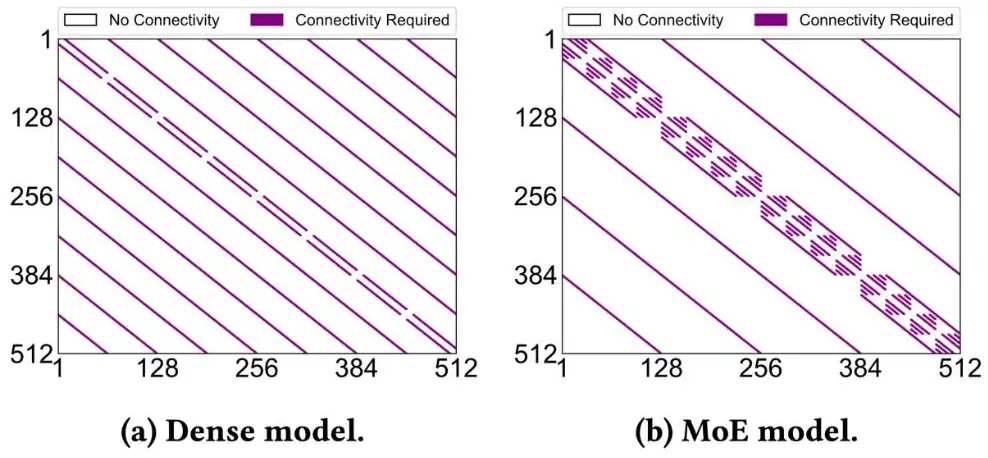
Training traffic is sparse and regular. Only RNICs in the same parallelism group exchange data, and tensor parallelism usually stays on NVLink inside a host. The paper's Figure 9 shows how sparse the result is. The ping list shrinks in three phases, listed after the figure.
訓練流量稀疏而規律。只有同一平行群組裡的 RNIC 會交換資料,而張量平行通常留在主機內的 NVLink 上。論文的 Figure 9 顯示結果有多稀疏。探測清單分三個階段縮小,列在圖後。
- Preload, at task submission: keep only pairs on the same rail, that is, RNICs with the same index on different hosts. Collective libraries move cross-rail data over NVLink first and then send it on its own rail, so cross-rail RNIC pairs carry nothing. With 8 RNICs per host, the list shrinks 8×.預載,在任務提交時:只保留同一 rail 的配對,即不同主機上索引相同的 RNIC。集體通訊函式庫會先把跨 rail 的資料經 NVLink 搬過去,再在自己的 rail 上送出,所以跨 rail 的 RNIC 配對沒有流量。每台主機 8 張 RNIC 時,清單縮小 8 倍。
- Incremental activation, at startup: an agent probes a destination only after it has registered as ready. Containers come up over minutes, and a central controller that pushed every change would choke at about 2,000 creations per minute.逐步啟用,在啟動時:agent 要等目的地登記為就緒後才探測它。容器要花數分鐘陸續啟動,而中央 controller 若推送每一次變更,會在每分鐘約 2,000 次建立時被塞爆。
- Skeleton, at run time: each RNIC's throughput, sampled every second, bursts at every gradient synchronization. SkeletonHunter computes a short-time Fourier transform (STFT) of each series and clusters the RNICs whose spectra match.骨架,在執行時:每張 RNIC 每秒取樣的吞吐,在每次梯度同步時出現突發。SkeletonHunter 對每條序列計算短時傅立葉轉換(STFT),把頻譜相近的 RNIC 分在一群。
The paper's Figure 7 shows these burst cycles on the four NICs of one container over 900 s: near idle between layers, then a burst at each synchronization.
論文的 Figure 7 顯示一個容器的四張 NIC 在 900 秒內的突發週期:層與層之間幾乎閒置,每次同步時出現一次突發。
In a 512-GPU job with TP = PP = DP = 8, the same-rail list gives each GPU 64 destinations, but the job uses only 9 of them (Figure 2), so 85.9% of the list is waste. Over production jobs the final list is more than 95% shorter than the same-rail list.
在 TP = PP = DP = 8 的 512 GPU 任務中,同 rail 清單給每顆 GPU 64 個目的地,但任務只用到其中 9 個(圖 2),所以清單的 85.9% 是浪費。在生產任務中,最終清單比同 rail 清單短了 95% 以上。
The clustering uses the layout rules of training jobs as constraints. With groups of mean size , RNICs and hosts (Equations 1–3 of the paper):
分群把訓練任務的佈局規則當作限制條件。設 個群組 、平均大小 、 張 RNIC、主機 (論文 Equations 1–3):
The groups should be equal in size, because every pipeline has the same scale. must divide by the rounded group size. No group may hold two RNICs of one host, because all RNICs of a host belong to one data-parallel replica. Each group is then one position across the replicas, so its size is the DP degree and . Pipeline stages show the same burst shifted in time. The panel computes the list sizes for any job shape.
群組應該一樣大,因為每條管線的規模相同。 必須能被四捨五入後的群組大小整除。任何群組都不能含同一主機的兩張 RNIC,因為一台主機的所有 RNIC 都屬於同一個資料平行副本。於是每個群組就是各副本中的同一個位置,群組大小即 DP 度數,且 。管線階段則呈現相同但時間錯開的突發。下面的面板計算任意任務形狀的清單大小。
3.2 Two clocks for anomalies3.2 偵測異常的兩個時鐘
Latency is collected per RNIC pair and tested at two time scales (Figure 3). Short term: each 30 s window is summarized by seven features: the 25th, 50th and 75th percentiles, minimum, mean, standard deviation and maximum. A local outlier factor (LOF) scores the window against a 5-minute look-back that spans several burst cycles. Long term: a slow drift hides inside a 5-minute window, so latency is also collected every 30 minutes. Healthy latency is modelled as log-normal, . The parameters fitted at time are checked with a Z-test at h, h and h. The paper gives neither the LOF threshold nor the significance level.
延遲以 RNIC 配對為單位收集,並在兩個時間尺度上檢驗(圖 3)。短期:每個 30 秒視窗用七個特徵摘要:第 25、50、75 百分位數、最小值、平均、標準差與最大值。局部離群因子(LOF)以涵蓋數個突發週期的 5 分鐘回看,為這個視窗打分。長期:緩慢的漂移會藏在 5 分鐘視窗裡,所以延遲也每 30 分鐘彙總一次。健康的延遲建模為對數常態分布 。在時間 擬合的參數,於 h、 h 與 h 以 Z 檢定檢查。論文沒有給出 LOF 門檻與顯著水準。
3.3 Overlay first, then underlay, then the RNIC3.3 先 overlay,再 underlay,最後 RNIC
The analyzer assumes that overlay faults come from software and underlay faults from hardware, and that neither spreads to the other layer. Algorithm 1 splits each failing path into encapsulated links (overlay) and plain links (underlay) and tests them in order (Figure 4):
analyzer 假設 overlay 故障來自軟體、underlay 故障來自硬體,而且兩者不會擴散到另一層。Algorithm 1 把每條失敗路徑分成封裝的鏈路(overlay)與未封裝的鏈路(underlay),並依序檢驗(圖 4):
- Overlay: walk the virtual forwarding chain from the source. A missing next hop is a break, and a hop seen before is a loop. Either one marks the faulty hop.Overlay:從來源沿虛擬轉送鏈走。下一跳不存在是斷開,走到已走過的跳是迴圈。兩者都標出故障的那一跳。
- Underlay: count the failing paths that cross each physical link, using traceroute as R-Pingmesh does. If no link is on two failing paths, the underlay is clear; otherwise the most-shared link is the suspect.Underlay:像 R-Pingmesh 一樣用 traceroute,計算經過每條實體鏈路的失敗路徑數。若沒有鏈路出現在兩條失敗路徑上,underlay 就沒有問題;否則出現最多次的鏈路就是嫌疑者。
- RNIC: if both layers are clear, the host agent dumps the flow table that OVS offloaded to the RNIC and compares it with OVS's own. The dump can slow the RNIC briefly, so it comes last. If it finds nothing, engineers check by hand.RNIC:若兩層都沒問題,主機 agent 傾印 OVS 卸載到 RNIC 的流表,並與 OVS 自己的流表比對。傾印可能讓 RNIC 短暫變慢,所以放在最後。若什麼都沒找到,就由工程師手動檢查。
Faults in both layers at once break the assumption. The paper calls them rare and handles them by hand.
兩層同時故障會打破這個假設。論文說這種情況很少,並以人工處理。
4. Implementation4. 實作
The controller is about 6,350 lines of Java on two servers, and the agents are about 5,400 lines of Go. Because the overlay agent is a sidecar, the team updated the agents more than 20 times in ten months without touching any training job. The analyzer runs on Alibaba's log service and Flink. The two servers handle the data of more than 40K endpoints across about 2K concurrent tasks. One obstacle was SR-IOV: once virtual functions are on, the RNIC's physical function cannot run RDMA, so host-side RDMA tools had to be reworked.
controller 約 6,350 行 Java,執行在兩台伺服器上;agent 約 5,400 行 Go。因為 overlay agent 是 sidecar,團隊在十個月內更新 agent 超過 20 次,完全不必動到訓練任務。analyzer 建在阿里的日誌服務與 Flink 上。兩台伺服器處理約 2K 個同時執行的任務、超過 4 萬個端點的資料。一個障礙是 SR-IOV:一旦啟用虛擬功能,RNIC 的實體功能就不能執行 RDMA,所以主機端的 RDMA 工具都得改寫。
5. What was measured5. 量到了什麼
The evaluation covers one production cluster of more than 4K hosts, each with 8 RNICs at 200 or 400 Gb/s, every RNIC in SR-IOV mode with 128 virtual functions. The data span March to August 2024 and more than 2M tasks. Engineers checked every detection by hand, and misses came from user reports. Only the probe counts have baselines: full mesh, and deTector, a generic method that shrinks probe matrices.
評估涵蓋一個超過 4K 台主機的生產叢集,每台 8 張 200 或 400 Gb/s 的 RNIC,每張 RNIC 都在 SR-IOV 模式下開 128 個虛擬功能。資料期間為 2024 年 3 月到 8 月,超過 200 萬個任務。每次偵測都由工程師人工核對,漏報來自使用者回報。只有探測數量有對照組:full mesh,以及 deTector(一種縮小探測矩陣的通用方法)。
At 2,048 RNICs, the ratios are:
在 2,048 張 RNIC 時,比例如下:
| Question問題 | Calculation算式 | Result結果 |
|---|---|---|
| Sweep time saved by the skeleton over the same-rail list骨架相對同 rail 清單省下的掃描時間 | ||
| Sweep time saved over full mesh相對 full mesh 省下的掃描時間 | ||
| Probes per round kept, skeleton over full mesh每輪保留的探測,骨架對 full mesh |
| Result結果 | Measured (production, March–August 2024)實測(生產環境,2024 年 3–8 月) |
|---|---|
| Detection偵測 | 4,816 failures; precision 98.2%, recall 99.3%4,816 次故障;精確度 98.2%、召回率 99.3% |
| Localization定位 | 1,302 faulty components, 95.7% localized correctly1,302 個故障元件,95.7% 定位正確 |
| Time to detect偵測時間 | about 8 s on average, against a training round of about 30 s平均約 8 秒,相對於約 30 秒的訓練回合 |
| Agent costAgent 成本 | about 1% CPU; about 35 MB in the text, while the plot shows 20–32 MBCPU 約 1%;記憶體正文寫約 35 MB,圖上卻是 20–32 MB |
| Outcome成效 | 98% of the 1,302 components fixed by September 2024; monthly network failure rate down 99.1% in October–December 20241,302 個元件中 98% 在 2024 年 9 月前修復;2024 年 10–12 月每月網路故障率下降 99.1% |
The failures fall into 19 types (Table 1 of the paper), from CRC errors and flapping switch ports to RNIC firmware, a GID change after a network-service restart, GPUDirect RDMA errors, flows that do not use RDMA, flows offloaded in the wrong order, and hugepage settings. Link faults go to an automated repair pipeline, host faults isolate the host, and software faults are fixed by a restart, in minutes instead of hours. The paper's Figure 18 shows the hardest case.
這些故障分為 19 類(論文 Table 1),從 CRC 錯誤、交換器埠抖動,到 RNIC 韌體、網路服務重啟後 GID 改變、GPUDirect RDMA 錯誤、沒有走 RDMA 的流、卸載順序錯誤的流,以及 hugepage 設定。鏈路故障送進自動修復流程,主機故障就隔離主機,軟體故障以重啟修復,從數小時縮短到數分鐘。論文的 Figure 18 是最難的案例。
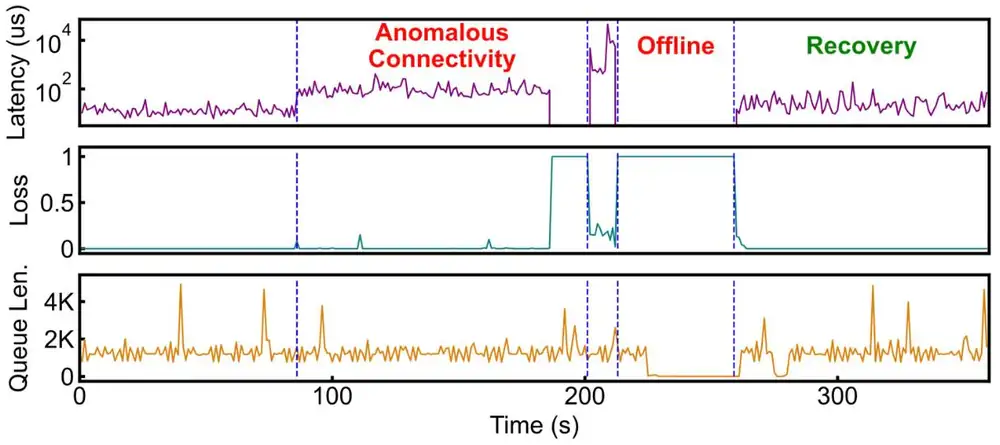
Latency on one pair rose from about 16 µs to about 120 µs, with loss under 0.1% and a flat switch queue, so this was not congestion. The long-term test flagged it, the overlay walk and the vote found nothing, and the flow-table dump found the inconsistency. The RNIC had not updated its flow counters in time. The control plane judged active flows idle and removed them from the RNIC, so packets fell back to the slow software path. Isolated, the RNIC recovered in about 60 s.
某一配對的延遲從約 16 µs 升到約 120 µs,丟包低於 0.1%,交換器佇列平穩,所以不是壅塞。長期檢定標記了它,overlay 走訪與投票都沒找到問題,流表傾印找到了不一致。原來這張 RNIC 沒有及時更新流計數器,控制平面以為活躍的流已閒置,把它們從 RNIC 移除,封包就退回緩慢的軟體路徑。隔離後,這張 RNIC 約 60 秒恢復。
The paper's Figure 18 (below) shows the whole episode, until the RNIC goes offline and the pair recovers.
論文的 Figure 18(下圖)畫出整段過程,直到 RNIC 離線、配對恢復為止。
6. Limits and open questions6. 限制與未解的問題
- Atypical jobs (the paper's own limit). Debugging jobs, ad hoc containers and new parallelism such as expert parallelism can give a wrong skeleton or a larger list. Proposed fixes: check the skeleton against live bursts, let users opt out, add hooks in intra-host libraries.非典型任務(論文自述)。除錯任務、臨時容器與專家平行之類的新平行方式,可能得到錯誤的骨架或更大的清單。提出的對策:以即時突發驗證骨架、讓使用者選擇退出、在主機內函式庫加入掛鉤。
- Blind spots (own). GPU-to-GPU and GPU-to-PCIe faults are out of scope and cause most false cases. An agent that crashes or answers late makes a healthy link look broken.盲點(論文自述)。GPU 對 GPU 與 GPU 對 PCIe 的故障不在範圍內,也是多數誤判的來源。agent 當掉或回應太慢,會讓健康的鏈路看起來壞了。
- Recovery (own) is still alert and blacklist; live migration is in development.恢復(論文自述)仍是警報加黑名單;即時遷移還在開發中。
- Counts need care. "Probes per round" is not defined: 60,430 is far below the 2,048 × 2,047 ≈ 4.2M ordered pairs. The STFT, clustering, LOF and Z-test settings are not given.計數要小心。「每輪探測數」沒有定義:60,430 遠低於 2,048 × 2,047 ≈ 420 萬個有序配對。STFT、分群、LOF 與 Z 檢定的設定都沒有給出。
- Accuracy needs care. How localization was verified is not described, and recall relies on users reporting misses. The 99.1% drop measures the repairs, against an undefined earlier period.準確度要小心。定位如何驗證並未說明,召回率仰賴使用者回報漏報。99.1% 的下降衡量的是修復的成效,而對照的較早期間沒有定義。
- The rail filter assumes a relay. A container that binds fewer than 8 RNICs (about 17% of them) may have no RNIC on a peer's rail, and Chapter 11 notes that a tenant cannot relay through a GPU it does not own. The paper does not discuss this case.rail 過濾假設可以轉送。綁定少於 8 張 RNIC 的容器(約 17%)在同伴的 rail 上可能沒有 RNIC,而第 11 章 指出租戶不能經由不屬於自己的 GPU 轉送。論文沒有討論這種情況。
7. How it connects7. 與其他內容的關聯
- R-Pingmesh: the same probe, traceroute and vote. R-Pingmesh traces the job's 5-tuples and separates RNICs with a ToR-mesh; SkeletonHunter infers the job's pairs and adds an overlay layer. Both find flapping, CRC, GID and PCIe problems.R-Pingmesh:同樣的探測、traceroute 與投票。R-Pingmesh 追蹤任務的 5-tuple,用 ToR-mesh 分離 RNIC;SkeletonHunter 推斷任務的配對,並多了 overlay 這一層。兩者都找到抖動、CRC、GID 與 PCIe 問題。
- Chapter 10: an 8 s average detection fills far below the "under 10 minutes" of MegaScale, though that figure includes diagnosis. Table 1 adds virtualization failures that Llama 3's Table 5 does not have.第 10 章:平均 8 秒的偵測讓 遠低於 MegaScale 的「低於 10 分鐘」,不過那個數字含診斷。Table 1 補上 Llama 3 Table 5 沒有的虛擬化故障。
- Deep dives 03, 05 and 10: the parallelism shape is recovered from throughput alone; rails make the 8× cut; and per-tenant observability is a cost of sharing. HPN is the same company's physical fabric under these containers.第 10 章 03、05 與 10:只從吞吐就還原出平行形狀;rail 帶來 8 倍的縮減;逐租戶的可觀測性是共享的代價。HPN 是這些容器底下、同一家公司的實體網路。
- Minder also exploits how alike training machines behave, but in host metrics. TPUv4 resiliency runs single-tenant slices with per-link health, so it needs no skeleton.Minder 同樣利用訓練機器彼此相似的行為,但用的是主機指標。TPUv4 resiliency 的切片是單一租戶、有逐鏈路的健康資訊,所以不需要骨架。
Key numbers關鍵數字
| Number | 數字 | Meaning (production) | 意義(生產環境) |
|---|---|---|---|
| 4,816 | Network failures detected in six months | 六個月內偵測到的網路故障 | |
| 98.2% / 99.3% | Detection precision / recall | 偵測精確度 / 召回率 | |
| 1,302 / 95.7% | Faulty components / localization accuracy | 故障元件 / 定位準確度 | |
| ≈ 8 s | Average time to detect a failure | 偵測故障的平均時間 | |
| 240.54 → 25.09 s | One probing sweep at 2,048 RNICs: same-rail list → skeleton | 2,048 張 RNIC 掃描一次:同 rail 清單 → 骨架 | |
| 64 → 9 | Destinations per GPU in a 512-GPU job: same rail → used | 512 GPU 任務中每顆 GPU 的目的地:同 rail → 實際使用 | |
| 99.1% | Drop in the monthly network failure rate after the fixes | 修復後每月網路故障率的降幅 |
Terms used on this page本頁用到的術語
- Overlay / underlay
- The tenant's virtual network (VFs, OVS rules, VXLAN tunnels) / the physical fabric under it.
- 租戶的虛擬網路(VF、OVS 規則、VXLAN 隧道)/ 其下的實體網路。
- SR-IOV, VF
- NIC virtualization: one physical RNIC exposes many virtual functions that containers use directly.
- NIC 虛擬化:一張實體 RNIC 提供許多虛擬功能,讓容器直接使用。
- Traffic skeleton
- The endpoint pairs that a training job's traffic really uses.
- 訓練任務流量真正使用的端點配對。
- STFT
- Short-time Fourier transform: the spectrum of a signal over a sliding window.
- 短時傅立葉轉換:訊號在滑動視窗上的頻譜。
- LOF
- Local outlier factor: how much sparser a point's neighbourhood is than its neighbours'.
- 局部離群因子:某點的鄰域比其鄰居的鄰域稀疏多少。
- Flow-table offload
- Moving a virtual switch's per-flow rules into the RNIC; a lost rule sends packets to the slow software path.
- 把虛擬交換器的逐流規則搬進 RNIC;規則遺失時,封包會走緩慢的軟體路徑。