Minder: Faulty Machine Detection for Large-scale Distributed Model TrainingMinder:大規模分散式模型訓練的故障機器偵測
After reading, you can explain how Minder names the one faulty machine of a training task by comparing machines with each other, and why its alert takes minutes when each call takes seconds.讀完後,你能說明 Minder 如何藉由機器之間互相比較,指出訓練任務中那一台故障機器,以及為何每次呼叫只要數秒,警報卻要數分鐘。
At ByteDance, a training task meets about two faults a day. Finding the faulty machine by hand took over half an hour on average, sometimes days, while every GPU of the task waited. Minder answers one question automatically: which machine is it? It does not ask why. In data-, pipeline- and tensor-parallel training all machines do the same work at the same rhythm, so their per-second monitoring metrics look alike. Minder denoises each metric with its own small neural network, adds up each machine's distances to all the others, and names the most dissimilar machine, but only if that machine stays the most dissimilar for 4 minutes. It tries the metrics in a learned order, with the rate of PFC pause frames first. In production for over a year, on 150 real faults, it reached a precision of 0.904 and a recall of 0.883, against 0.788 and 0.767 for a statistical baseline. One detection call takes 3.6 s of computing; the alert itself waits for the 4-minute rule.
在字節跳動,一個訓練任務平均每天遇到約兩次故障。靠人工找出故障機器平均要半小時以上,有時要好幾天,而任務的每一顆 GPU 都在等。Minder 自動回答一個問題:是哪一台機器?它不問原因。在資料、管線與張量平行訓練中,所有機器以相同的節奏做相同的工作,所以它們每秒的監控指標看起來很像。Minder 為每項指標各用一個小型神經網路去除雜訊,把每台機器到其他所有機器的距離加總,指出最不相似的那台,但前提是它持續 4 分鐘都是最不相似的。它依學習得到的順序嘗試各項指標,PFC 暫停幀的速率排第一。在生產環境運行超過一年、以 150 次真實故障評估,它的精確率達 0.904、召回率 0.883,統計基準則為 0.788 與 0.767。一次偵測呼叫只花 3.6 秒運算;警報本身則要等 4 分鐘的規則。
1. Where this paper sits1. 這篇論文的位置
Section 10.4 describes MegaScale's recovery loop. A heartbeat carries each node's RDMA traffic counters, a drop raises an alert, diagnostics run on the suspect nodes, and a failing node is evicted and replaced from a standby pool. Section 2 of Chapter 10 puts a detection term into the cost of every interruption,
第 10.4 節描述 MegaScale 的恢復迴圈。心跳帶著每個節點的 RDMA 流量計數器,計數下降就發出警報,對可疑節點執行診斷,失敗的節點被逐出並由備用池替換。第 10.2 節把偵測項 放進每次中斷的成本:
and fills with MegaScale's "under 10 minutes" for detection plus diagnosis. Two gaps remain. First, a slow machine drags down the traffic of every machine in its collectives, so a drop in traffic does not say which machine to evict. Second, many faults do not stop the job. They slow it, and Section 10.6 shows that a synchronous job runs at the speed of its slowest rank. Nothing in the loop names that rank automatically. Minder fills the step "which machine?" in both cases. The other digests of this chapter ask different questions: R-Pingmesh and SkeletonHunter ask whether the network is to blame, and where in the fabric.
並以 MegaScale「低於 10 分鐘」的偵測加診斷時間填入 。還有兩個缺口。第一,一台慢機器會拖慢它所在集體通訊中每台機器的流量,所以流量下降並不說明該逐出哪一台。第二,許多故障不會讓任務停下,只會讓它變慢,而第 10.6 節說明同步任務以最慢 rank 的速度前進。迴圈裡沒有任何東西會自動指出那個 rank。Minder 在這兩種情況下補上「是哪一台機器?」這一步。本章其他導讀問的是別的問題:R-Pingmesh 與 SkeletonHunter 問的是網路是否該負責,以及問題在網路的哪裡。
2. The problem, measured2. 問題,用量測說話
Every number in this section comes from ByteDance production over seven months of 2023.
本節每個數字都來自字節跳動 2023 年七個月的生產環境。
Frequency and delay. Faults per day grow with task size, and tasks can exceed 1,024 machines (more than 10,000 GPUs). The average task meets two faults a day. Engineers took over half an hour on average to find the faulty machine, and sometimes days (the paper's Figures 1 and 2). Three things made it slow. The alert came only when the task stopped, so a slowdown went unnoticed. Logs were incomplete: GPU power, temperature and NVLink bandwidth appear in no log. And the search needed several teams.
頻率與延遲。每天的故障數隨任務規模增加,而任務可超過 1,024 台機器(超過 10,000 顆 GPU)。平均每個任務每天遇到兩次故障。工程師平均要半小時以上才找到故障機器,有時要好幾天(論文的 Figures 1 與 2)。有三件事讓它很慢。只有任務停下時才會發出警報,所以變慢不會被察覺。日誌不完整:GPU 功耗、溫度與 NVLink 頻寬不出現在任何日誌中。而且搜尋需要好幾個團隊。
One case. A 128-machine task ran slowly for 40 minutes. The cause was one machine whose PCIe link had degraded. The chain below traces how one host fault became a slowdown of the whole task.
一個案例。一個 128 台機器的任務緩慢運行了 40 分鐘。原因是一台機器的 PCIe 鏈路降速。下圖追蹤一個主機故障如何變成整個任務的變慢。
The training, network, storage and hardware teams each checked their own items: parallelism settings, RDMA traffic, HDFS and SSD use, NIC health. Nobody looked at the PFC rates in time, and the search took the whole 40 minutes. The paper's introduction puts a price on the case. With 8 GPUs per machine and the paper's V100 price:
訓練、網路、儲存與硬體團隊各自檢查自己的項目:平行設定、RDMA 流量、HDFS 與 SSD 使用量、NIC 健康狀態。沒有人及時查看 PFC 速率,搜尋花掉了整整 40 分鐘。論文的引言為這個案例估了價。以每台機器 8 顆 GPU 與論文的 V100 價格計算:
| Question問題 | Calculation算式 | Result結果 |
|---|---|---|
| GPU-hours of the task during the 40-minute slowdown40 分鐘變慢期間任務的 GPU-小時 | GPU-hGPU-小時 | |
| Their cost at $2.48 per V100 GPU-hour以每 V100 GPU-小時 2.48 美元計的成本 | USD美元the paper's §1: "more than $1700"論文 §1:「超過 1700 美元」 |
What faults look like in the metrics. Table 1 of the paper maps each fault type to the metrics that showed it, at per-second sampling. Intra-host hardware causes 55.8% of faults, and GPU-memory ECC errors alone cause 38.9%. Intra-host software causes 28.0%, the inter-host network 6.0%, and other causes 10.3%. The network share is small because the table counts only faults that can be blamed on one machine. The heat map below draws the table.
故障在指標上的樣子。論文的 Table 1 以每秒取樣,把每種故障類型對應到顯示出它的指標。主機內硬體造成 55.8% 的故障,光是 GPU 記憶體的 ECC 錯誤就占 38.9%。主機內軟體占 28.0%、主機間網路占 6.0%、其他原因占 10.3%。網路占比小,是因為這張表只計入能歸咎於某一台機器的故障。下面的熱圖把這張表畫出來。
No single metric catches every fault. CPU and GPU metrics show most faults, because a failing machine's utilization drops while its peers wait for it. PCIe downgrading shows in PFC every time, because a starved NIC fills its buffer and sends pause frames. NIC dropout is the reverse: it shows in CPU, GPU, throughput and memory, never in PFC.
沒有任何單一指標能抓到每一種故障。CPU 與 GPU 指標顯示出大多數故障,因為故障機器的使用率下降,而同儕在等它。PCIe 降速每次都顯示在 PFC 上,因為吃不飽的 NIC 塞滿緩衝並送出暫停幀。NIC 消失則相反:它顯示在 CPU、GPU、吞吐與記憶體上,從不顯示在 PFC 上。
Why fixed thresholds fail. The paper names four challenges. Any component can fail. "Normal" depends on the task: a GPU at 70 °C is abnormal at a 1,350 MHz clock but normal at 1,800 MHz, so labels for supervised learning are inconsistent. Faults and metrics are many-to-many. And monitoring data is noisy: jitter, sensor errors, misaligned timestamps and gaps.
為什麼固定門檻行不通。論文列出四項挑戰。任何元件都可能故障。「正常」取決於任務:GPU 在 1,350 MHz 時脈下 70 °C 算異常,在 1,800 MHz 下卻是正常,所以監督式學習的標籤並不一致。故障與指標是多對多的關係。而監控資料有雜訊:jitter、感測器誤差、時間戳記不一致以及資料缺漏。
3. The design3. 設計
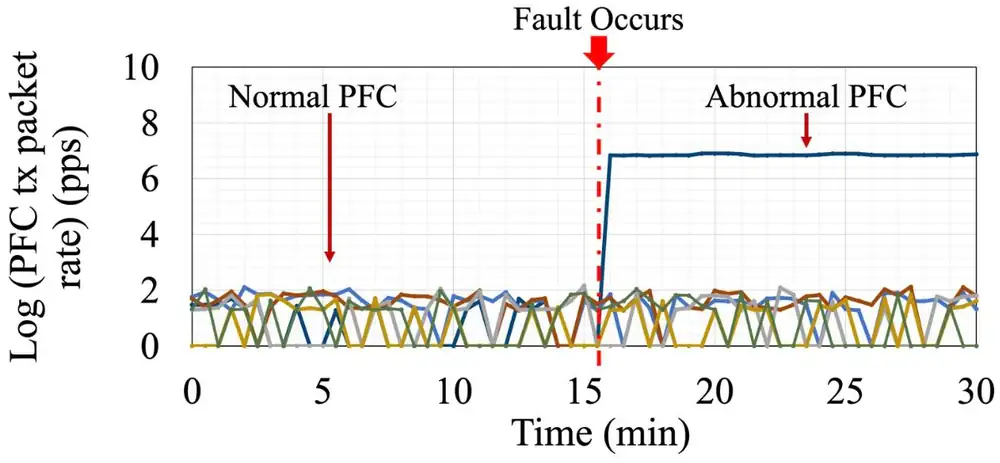
Minder rests on two observations from the same production data. The first is machine-level similarity. In 3D-parallel training the load is balanced, so all machines' metrics fluctuate alike at second granularity, and a faulty machine is the one that looks different. In the paper's Figure 3, one machine's PFC transmit rate surges after a fault while all the others stay together. Tensor parallelism stays inside a machine, and data- and pipeline-parallel groups cross machines, so the machine is the natural unit to blame.
Minder 建立在同一批生產資料的兩個觀察上。第一個是機器層級的相似性(machine-level similarity)。在 3D 平行訓練中負載是均衡的,所以所有機器的指標在秒級尺度上一起起伏,而故障機器就是看起來不一樣的那台。在論文的 Figure 3 中,故障發生後一台機器的 PFC 送出速率暴增,其他機器則維持在一起。張量平行留在一台機器之內,資料平行與管線平行群組則跨越機器,所以機器是歸咎責任的自然單位。
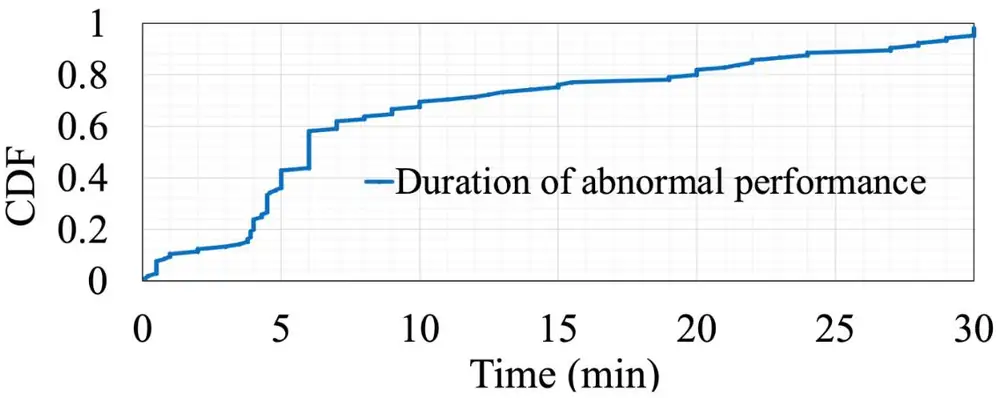
The second is machine-level continuity. After a fault the abnormal pattern lasts for minutes, most often for over five (the paper's Figure 4), while jitter is brief.
第二個是機器層級的連續性(machine-level continuity)。故障發生後異常模式會持續數分鐘,最常超過五分鐘(論文的 Figure 4),而 jitter 很短暫。
The pipeline below turns these two observations into an alert. One call runs it for each metric in a learned order, until a metric names a machine.
下面的流程把這兩個觀察變成警報。每次呼叫依學到的順序對每項指標執行它,直到某項指標指出一台機器為止。
3.1 Prepare the data3.1 準備資料
Minder reads metrics that the monitoring service already collects every second, so the training job needs no change. Samples are aligned by timestamp across machines, and a missing sample takes the value of the nearest sampling time. Each metric is scaled to the range 0 to 1 with min–max normalization, using that metric's upper and lower limits. Each machine's series is then cut into windows of samples that slide by one sample.
Minder 讀取監控服務本來就每秒收集的指標,所以訓練任務不需要任何修改。各機器的取樣依時間戳記對齊,缺少的取樣以最接近的取樣時間的值補上。每項指標用 min–max 正規化縮放到 0 到 1,使用該指標的上下限。接著每台機器的序列被切成 個取樣的視窗,每次滑動一個取樣。
3.2 One denoiser per metric3.2 每項指標一個去雜訊器
A variational autoencoder (VAE) compresses its input to a small random code and then reconstructs the input from it. Trained on mostly normal data, it learns what normal windows look like: it reconstructs them closely and smooths away noise. Minder uses an LSTM encoder and decoder, a recurrent design that suits time series, with the paper's example sizes: hidden size 4, latent size 8, one LSTM layer. The mean squared error between input and reconstruction was below 0.0001. There is one model per metric, trained on the first three months of data. One joint model would let a metric that is irrelevant to the current fault drown out the one that matters.
變分自編碼器(variational autoencoder,VAE)把輸入壓縮成一個小的隨機編碼,再從編碼重建輸入。以大多為正常的資料訓練後,它學會正常視窗長什麼樣子:能把它們重建得很接近,並把雜訊抹平。Minder 使用 LSTM 編碼器與解碼器(一種適合時間序列的遞迴設計),採論文的範例大小:隱藏層大小 4、潛在空間大小 8、一層 LSTM。輸入與重建之間的均方誤差低於 0.0001。每項指標一個模型,以前三個月的資料訓練。若用單一聯合模型,與當前故障無關的指標會淹沒真正重要的那一項。
3.3 Score each window, then demand continuity3.3 為每個視窗評分,再要求連續性
For one metric and one window, every machine gives a reconstructed embedding . Minder computes all pairwise Euclidean distances and each machine's dissimilarity
對一項指標的一個視窗,每台機器 給出一個重建後的嵌入 。Minder 計算所有成對的歐氏距離,以及每台機器的不相似度
The sum grows with the number of machines, so Minder converts into a "normal score" that removes this effect. The machine with the highest score becomes the window's candidate if its score exceeds a similarity threshold. The paper gives neither the normalization formula nor the threshold value. Then comes the continuity check: Minder declares a machine faulty only if it stays the candidate in consecutive windows for longer than the continuity threshold of 4 minutes. The authors chose 4 minutes from the fault-duration data, because most faults last longer than that before the task halts, and short jitter does not. If the metric names no machine, Minder moves to the next metric; if no metric does, it reports no fault. The panel below runs this rule on synthetic traces.
這個總和會隨機器數成長,所以 Minder 把 轉換成去除此效應的「正常分數」。分數最高的機器若超過相似度門檻,就成為該視窗的候選機器。論文沒有給出正規化公式,也沒有給出門檻值。接著是連續性檢查:只有當同一台機器在連續的視窗中持續當候選超過 4 分鐘的連續性門檻,Minder 才宣告它故障。作者依故障持續時間的資料選了 4 分鐘,因為大多數故障在任務停擺前持續得比這更久,而短暫的 jitter 不會。若這項指標沒有指出任何機器,Minder 就換下一項指標;若所有指標都沒有,就回報沒有故障。下面的面板在合成的資料上執行這條規則。
3.4 Ask the most informative metric first3.4 先問最有資訊量的指標
Minder does not merge the metrics into one score. It tries them one at a time and stops at the first one that names a machine. The order is learned offline in two steps. First, for metric in a window, each machine gets a Z-score, its distance from the mean over all machines in units of their standard deviation , and the window keeps the largest:
Minder 不把各項指標合併成一個分數。它一次試一項,在第一項指出機器的指標處停下。順序分兩步離線學得。第一步,對視窗中的指標 ,每台機器 得到一個 Z 分數(Z-score),即它與所有機器平均值的距離,以標準差 為單位,而視窗保留其中最大者:
Second, each pair of a window and a task becomes one training instance. Its features are the per-metric scores, and engineers label it normal or abnormal. A decision tree trained on these instances puts the most useful metric at its root; its if-then structure resembles operators' own rules. The learned order is the PFC transmit-packet rate, then CPU usage, GPU duty cycle, GPU power draw, GPU graphics-engine activity, GPU tensor-core activity and NVLink bandwidth (the bottom row of the pipeline figure above).
第二步,每一組(視窗、任務)成為一筆訓練實例。它的特徵是各項指標的分數,由工程師標記為正常或異常。用這些實例訓練的決策樹把最有用的指標放在根部;它的 if-then 結構類似營運人員自己的規則。學到的順序是 PFC 送出封包速率,接著是 CPU 使用率、GPU 忙碌率(duty cycle)、GPU 功耗、GPU 繪圖引擎活動、GPU tensor core 活動與 NVLink 頻寬(上面流程圖的最下面一列)。
4. Implementation4. 實作
Minder has run in ByteDance production for about a year as a backend service on one dedicated machine (128 Xeon CPUs, 512 GB of memory), so it does not slow the training. It is called for each task at fixed intervals, every 8 minutes in the paper's example, and each call pulls the last 15 minutes of 21 metrics for all machines of the task (the paper's Table 2). An alert goes to engineers and to a driver, which blocks the machine's IP address and hands its pod to Kubernetes for eviction and replacement; training resumes from a recent checkpoint. The tasks run on 4 to more than 1,000 machines with identical GPUs and NICs, on a rail-optimized fabric of up to three switch tiers. The paper gives no code size.
Minder 以後端服務的形式在字節跳動生產環境運行約一年,跑在一台專用機器上(128 個 Xeon CPU、512 GB 記憶體),所以不會拖慢訓練。它以固定間隔為每個任務被呼叫一次,論文的例子是每 8 分鐘,每次呼叫拉取任務所有機器最近 15 分鐘的 21 項指標(論文的 Table 2)。警報送給工程師與一個 driver;driver 封鎖該機器的 IP 位址,把它的 pod 交給 Kubernetes 逐出並替換,訓練則從最近的檢查點恢復。這些任務跑在 4 到超過 1,000 台 GPU 與 NIC 型號一致的機器上,網路是最多三層交換器的 rail-optimized 架構。論文沒有給出程式碼規模。
5. What was measured5. 量到了什麼
Setup. The test set has 150 fault instances from production 3D-parallel training tasks over nine months, on 4 to more than 1,500 machines with up to 10,000 NVIDIA Ampere GPUs; 30% of the tasks had at least 600 machines. Only single-machine faults are included; they are 99% of production cases, and ECC errors are the largest group (25.7%). The true faulty machine was confirmed offline by log checks, nccl-tests or hardware tests. The models were trained on the first three months and tested on the rest, as an offline replay of production data. The baseline uses the same pipeline with Mahalanobis distance over statistical features (mean, variance, skewness, kurtosis) instead of the LSTM-VAE. Precision is the share of alerts that named the right machine; recall is the share of faults for which the right machine was found. The dot plot below compares Minder with the baseline and with three changes to Minder itself.
設定。測試集有 150 次故障實例,來自九個月內生產環境的 3D 平行訓練任務,規模 4 到超過 1,500 台機器、最多 10,000 顆 NVIDIA Ampere GPU;30% 的任務至少有 600 台機器。只納入單一機器的故障;它們占生產案例的 99%,其中 ECC 錯誤是最大的一群(25.7%)。真正的故障機器以離線的日誌檢查、nccl-tests 或硬體測試確認。模型以前三個月訓練、以其餘時間測試,是生產資料的離線重播。基準使用同一流程,但以統計特徵(平均、變異數、偏態、峰度)上的 Mahalanobis 距離取代 LSTM-VAE。精確率(precision)是指對機器的警報所占比例;召回率(recall)是找到正確機器的故障所占比例。下面的點圖比較 Minder 與基準,以及 Minder 本身的三種變更。
Three results stand out. Denoising matters: Minder beats the baseline by 0.116 in F1 score. The metric set matters in both directions: fewer metrics lose key signals, and more metrics raise recall slightly but lower precision through interference. Continuity matters most for precision: without it, precision falls to 0.757, because short jitter triggers false alarms. Replacing the per-metric models with raw data, with concatenated embeddings, or with one joint model lowered recall and F1 (the paper prints no values). The distance measure hardly matters: Manhattan and Chebyshev distances scored within 0.02 of Euclidean on every measure.
有三個結果特別突出。去雜訊很重要:Minder 的 F1 分數比基準高 0.116。指標集合在兩個方向上都重要:指標太少會漏掉關鍵訊號,指標太多則略微提高召回率、卻因互相干擾而降低精確率。連續性對精確率最重要:沒有它,精確率掉到 0.757,因為短暫的 jitter 觸發錯誤警報。把每項指標的模型換成原始資料、串接的嵌入或單一聯合模型,都會降低召回率與 F1(論文未印出數值)。距離的種類幾乎無關緊要:Manhattan 與 Chebyshev 距離在每項指標上都與歐氏距離相差不到 0.02。
Speed. One call took 3.6 s on average over 500 tasks, including pulling the data, preprocessing and inference (the paper's Figure 8). The paper compares this with the half hour of manual diagnosis and claims a 99% (500×) reduction. That compares compute time with human search time. It is not the delay from fault onset to alert, which the paper does not measure. The paper's own parameters bound that delay:
速度。在 500 個任務上,一次呼叫平均花 3.6 秒,包含拉取資料、前處理與推論(論文的 Figure 8)。論文拿它與半小時的人工診斷比較,宣稱縮短 99%(500 倍)。這是拿運算時間與人工搜尋時間相比,而不是從故障開始到警報的延遲;論文沒有量測後者。論文自己的參數可以界定這個延遲:
| Question問題 | Calculation算式 | Result結果 |
|---|---|---|
| Manual diagnosis (30 min) against one call人工診斷(30 分鐘)對一次呼叫 | the paper's claim論文的宣稱 | |
| Earliest alert after fault onset: the continuity rule故障開始後最早的警報:連續性規則 | min分鐘 | |
| Latest alert, with calls every 8 minutes最晚的警報,每 8 分鐘呼叫一次 | min分鐘 |
By fault type and count. Recall is lower for GPU execution errors and PCIe downgrading. In some of these instances several GPUs or PCIe links in one machine failed at once, and 3D parallelism spreads the impact through the DP and PP groups within a second. Errors of AOC (active optical cables) are partly missed because no optical-cable counters are collected yet. Accuracy did not depend on how many faults a task met in its life; 70% of tasks met at most five and over 15% met more than eight.
依故障類型與次數。GPU 執行錯誤與 PCIe 降速的召回率較低。其中一些實例是同一台機器上好幾顆 GPU 或好幾條 PCIe 鏈路同時故障,而 3D 平行會在一秒內把影響擴散到 DP 與 PP 群組。AOC(主動光纜)錯誤有部分漏抓,因為目前還沒有收集光纜計數器。準確度與任務一生中遇到幾次故障無關;70% 的任務最多遇到五次,超過 15% 遇到八次以上。
Concurrent faults. In production these come only from automatic switch reboots or switch AOC errors: under 1% of faults, and sometimes none in a month. When a switch reboots, 32 of 600 machines go offline together, their traffic touches at most 256 DP groups, and the impact spreads within a second. With 32 outliers at once there is no single most dissimilar machine. On a 4-machine testbed the authors injected PCIe downgrading on two machines and sampled NIC throughput every millisecond; the two degraded NICs had the largest distances, and Minder flagged both. Millisecond data is the paper's proposed way out.
同時發生的故障。在生產環境中,這類故障只來自交換器自動重開機或交換器的 AOC 錯誤:不到故障的 1%,有些月份一次也沒有。交換器重開機時,600 台機器中有 32 台同時離線,它們的流量最多牽涉 256 個 DP 群組,影響在一秒內擴散。同時有 32 個離群者,就沒有單一一台最不相似的機器。作者在 4 台機器的測試平台上對其中兩台注入 PCIe 降速,並每毫秒取樣 NIC 吞吐;兩張降速 NIC 的距離最大,Minder 把兩台都標了出來。毫秒級資料就是論文提出的出路。
6. Limits and open questions6. 限制與未解的問題
The paper names its limits. Minder finds the machine, not the root cause. Second-level data cannot separate concurrent faults; finer data, optical-cable counters and in-band traces are future work. A flagged machine may only have had temporary jitter. Inference and fine-tuning are untested, and a new fault type is found only if it makes a machine look different. A careful reader should add:
論文自己列出了限制。Minder 找的是機器而不是根本原因。秒級資料無法分開同時發生的故障;更細的資料、光纜計數器與頻內追蹤留待未來。被標出的機器可能只是暫時的 jitter。推論與微調沒有測試過,而新的故障類型只有在讓機器看起來不同時才會被找到。細心的讀者還應該補上:
- The delay is minutes, not seconds. The 4-minute rule plus the call interval set it (section 5). A fault that halts the job sooner is left to heartbeats and timeouts.延遲是分鐘而不是秒。4 分鐘規則加上呼叫間隔決定了它(第 5 節)。更早讓任務停擺的故障,留給心跳與逾時處理。
- Key values are missing. The similarity threshold, the normal-score formula and how the tree's order is applied across tasks are not given, so the method is hard to reproduce exactly.關鍵數值缺漏。相似度門檻、正常分數的公式,以及決策樹的順序如何套用到各任務,都沒有給出,所以這個方法很難精確重現。
- The test set is small. It has 150 single-machine faults. Precision is reported, but not false alarms per day of normal running.測試集很小。它只有 150 次單一機器故障。論文報告了精確率,卻沒有報告正常運行時每天的錯誤警報數。
- Homogeneity is assumed. The first and last pipeline stages hold the embeddings and the loss, and MoE expert loads are uneven. The paper does not discuss such built-in differences between machines.假設機器同質。管線的第一與最後一個 stage 負責嵌入與 loss,MoE 的專家負載也不均。論文沒有討論機器之間這種與生俱來的差異。
- Fabric faults hide. A fault that slows every machine equally makes no outlier. That is why ByteDance runs R-Pingmesh beside Minder.網路內部的故障會躲起來。讓每台機器同等變慢的故障不會產生離群者。這就是字節跳動在 Minder 旁邊還跑 R-Pingmesh 的原因。
- Two printed numbers need care. The PCIe and NIC rates are printed in "Gbps", so we quote only their ratios. A later section prints a lower cost for the same 40-minute case than the introduction; the arithmetic in section 2 supports the introduction's figure.兩個印出的數字要小心。PCIe 與 NIC 速率印成「Gbps」,所以我們只引用它們的比值。後面一節為同一個 40 分鐘案例印出比引言更低的成本;第 2 節的算術支持的是引言的數字。
7. How it connects7. 與其他內容的關聯
- Deep dive, section 4: Minder is the "which node to evict" step of MegaScale's loop, made automatic and multi-signal. MegaScale's heartbeat watches RDMA counters for a drop; Minder compares 21 metrics across machines.第 10.4 節:Minder 是 MegaScale 迴圈中「逐出哪個節點」這一步,變成自動且多訊號。MegaScale 的心跳盯著 RDMA 計數器是否下降;Minder 則在機器之間比較 21 項指標。
- Deep dive, section 6: a chronic straggler is the outlier in a population that should be identical, like MegaScale's 0.5% of slow machines. The continuity rule is the line between a chronic straggler and jitter.第 10.6 節:長期 straggler 是一群本該相同的機器中的離群者,就像 MegaScale 那 0.5% 的慢機器。連續性規則就是長期 straggler 與 jitter 之間的分界線。
- Deep dive, section 1: Table 1 is a second production failure table beside Llama 3's Table 5. Both put GPU and host hardware first (55.8% intra-host hardware here, 58.7% GPUs there) and the network at about a tenth or less.第 10.1 節:Table 1 是 Llama 3 Table 5 之外的第二張生產環境故障表。兩者都把 GPU 與主機硬體排第一(這裡主機內硬體 55.8%,那裡 GPU 58.7%),網路約占十分之一或更少。
- Chapter 7: the PCIe-downgrade case is a PFC chain. A slow receiver sends pause frames, ECN marks and CNPs rise, and throughput falls across the cluster. Meta's RoCE paper watches the same pause signal with a fixed 200 ms watchdog; Minder compares it across machines.第 7 章:PCIe 降速案例是一條 PFC 連鎖。慢的接收端送出暫停幀,ECN 標記與 CNP 增加,整個叢集的吞吐下降。Meta 的 RoCE 論文用固定 200 ms 的 watchdog 盯著同一個暫停訊號;Minder 則在機器之間比較它。
- R-Pingmesh comes from the same ByteDance team, and Minder names it as a companion. Probes find faults inside the fabric but cannot see a GPU fault; host metrics see GPU faults but not a fabric fault that hits every machine.R-Pingmesh 出自同一個字節跳動團隊,Minder 把它列為搭配的工具。探測能找到網路內部的故障,卻看不到 GPU 故障;主機指標看得到 GPU 故障,卻看不到同時打擊每台機器的網路故障。
- SkeletonHunter shares the premise that training traffic is regular, but probes the network of a multi-tenant cloud.SkeletonHunter 同樣以「訓練流量很規律」為前提,但探測的是多租戶雲端的網路。
- TPUv4 resiliency: Google's health daemon and preflight checks compare metrics with fixed "golden" thresholds, the approach Minder rejects. Both can be right: link quality and firmware state do not depend on the task, but GPU temperature and utilization do.TPUv4 韌性:Google 的健康 daemon 與預檢把指標與固定的「黃金」門檻比較,正是 Minder 拒絕的做法。兩者都可能是對的:鏈路品質與韌體狀態不取決於任務,GPU 溫度與使用率卻會。
Key numbers關鍵數字
| Number | 數字 | Meaning | 意義 | Setup | 設定 |
|---|---|---|---|---|---|
| 2 / day | Faults per training task, on average | 每個訓練任務的平均故障數 | Production, 7 months of 2023 | 生產環境,2023 年 7 個月 | |
| > 30 min | Average manual search for the faulty machine (up to days) | 人工找出故障機器的平均時間(可達數天) | Same | 同上 | |
| 55.8% / 38.9% / 6.0% | Faults from intra-host hardware / ECC errors / inter-host network | 來自主機內硬體 / ECC 錯誤 / 主機間網路的故障 | Same, Table 1 | 同上,Table 1 | |
| 0.904 / 0.883 / 0.893 | Minder precision / recall / F1 | Minder 的精確率 / 召回率 / F1 | 150 production faults, 9 months, offline replay | 150 次生產故障,9 個月,離線重播 | |
| 0.788 / 0.767 / 0.777 | Mahalanobis-distance baseline | Mahalanobis 距離基準 | Same | 同上 | |
| 0.757 / 0.777 / 0.767 | Minder without the continuity check | 沒有連續性檢查的 Minder | Same | 同上 | |
| 3.6 s | Compute per detection call (pull, preprocess, infer) | 每次偵測呼叫的運算(拉取、前處理、推論) | 500 tasks, one dedicated server | 500 個任務,一台專用伺服器 | |
| 4 min | Continuity threshold (a configured value) | 連續性門檻(設定值) | Chosen from fault durations | 依故障持續時間選定 | |
| 32 of 600 | Machines knocked offline together by one switch reboot | 一次交換器重開機同時讓其離線的機器 | Production example | 生產環境案例 |
Terms used on this page本頁用到的術語
- Machine-level similarity機器層級的相似性
- Under balanced 3D parallelism, all machines' metrics fluctuate alike at second granularity.
- 在均衡的 3D 平行下,所有機器的指標在秒級尺度上一起起伏。
- Machine-level continuity機器層級的連續性
- A real fault keeps the same machine abnormal for minutes; jitter is brief.
- 真正的故障讓同一台機器異常數分鐘;jitter 很短暫。
- Continuity threshold連續性門檻
- How long the same machine must stay the most dissimilar before Minder alerts: 4 minutes.
- 同一台機器必須持續最不相似多久,Minder 才發出警報:4 分鐘。
- LSTM-VAE
- A variational autoencoder with LSTM encoder and decoder; trained on normal time series, it reconstructs normal patterns and smooths noise.
- 編碼器與解碼器都是 LSTM 的變分自編碼器;以正常時間序列訓練後,能重建正常模式並抹平雜訊。
- Z-scoreZ 分數
- A value's distance from the mean in units of the standard deviation.
- 一個值與平均值的距離,以標準差為單位。
- Decision tree決策樹
- A classifier made of nested if-then splits; here it ranks metrics by how well they reveal abnormal windows.
- 由巢狀 if-then 分支組成的分類器;在這裡用來依「多能揭露異常視窗」為指標排序。
- Mahalanobis distanceMahalanobis 距離
- A distance that accounts for correlations between features; the baseline's outlier measure.
- 考慮特徵之間相關性的距離;基準方法用它衡量離群程度。
- Precision / recall精確率 / 召回率
- Share of alerts that named the right machine / share of faults whose machine was found.
- 指對機器的警報所占比例 / 找到故障機器的故障所占比例。
- PCIe downgradingPCIe 降速
- A PCIe link running below its intended speed or width, which starves the NIC or GPU behind it.
- PCIe 鏈路以低於預定的速度或寬度運作,讓後面的 NIC 或 GPU 吃不飽。
- PFC Tx packet ratePFC Tx 封包速率
- How many PFC pause frames a NIC sends per second; a surge means it cannot drain its receive buffer.
- NIC 每秒送出多少 PFC 暫停幀;暴增代表它清不完接收緩衝。
- ECC errorECC 錯誤
- A GPU-memory error caught by error-correcting codes; the most common fault type (38.9%).
- 被錯誤更正碼抓到的 GPU 記憶體錯誤;最常見的故障類型(38.9%)。