OmniPath Ping: Active Network Measurement in the Era of Packet SprayingOmniPath Ping:封包噴灑時代的主動網路量測
After reading, you can explain why packet spraying breaks Ping and Traceroute, and how switches that copy one probe onto every path and merge the answers restore diagnosis.讀完後,你能說明封包噴灑為何讓 Ping 與 Traceroute 失效,以及交換器如何把一個探測封包複製到每條路徑、再合併回覆,讓診斷恢復可行。
Operators find network faults with Ping, Traceroute and systems built on them, such as Pingmesh and R-Pingmesh. R-Pingmesh's service tracing sends probes with a live flow's own 5-tuple, so under ECMP the probe follows the flow's path and a TTL names one switch. Packet spraying breaks both. One probe now takes one random path of , a TTL maps to a set of switches, and covering all paths with random probes is a coupon-collector problem that needs about probes. OmniPath Ping (OPP) moves probing into programmable switches. A switch where paths branch copies one probe to every equal-cost port; a switch where they merge forwards only the first copy. ACKs come back along the same tree and merge, and per-hop timers name the link that never answered. On a 4-switch Tofino testbed (2 leaves, 2 spines, 4 servers, 100 Gb/s), one probe per task covered 100% of paths, against about 66.5% for Ping-based baselines, with 576 probe and ACK packets per switch against 2,688. Every result at scale comes from NS-3 simulation and is not shown here.
營運者用 Ping、Traceroute 以及建立在其上的系統(例如 Pingmesh 與 R-Pingmesh)找出網路故障。R-Pingmesh 的服務追蹤(service tracing)用一條實際流量自己的 5-tuple 發送探測,所以在 ECMP 下探測走的就是那條流的路徑,而一個 TTL 指的就是一台交換器。封包噴灑把兩者都打破了。一個探測現在只走 條路徑中隨機的一條,一個 TTL 對應到一組交換器,而用隨機探測涵蓋全部 條路徑是集郵問題(coupon collector),約需 個探測。OmniPath Ping(OPP)把探測移進可程式化交換器。路徑分岔處的交換器把一個探測複製到每個等價埠;路徑匯合處的交換器只轉送第一份。ACK 沿同一棵樹返回並合併,逐跳計時器則指出那條沒有回應的鏈路。在 4 台交換器的 Tofino 測試平台上(2 台 leaf、2 台 spine、4 台伺服器、100 Gb/s),每個任務一個探測就涵蓋 100% 的路徑,基於 Ping 的基準約 66.5%;每台交換器處理 576 個探測與 ACK 封包,基準為 2,688 個。所有大規模結果都來自 NS-3 模擬,本頁不列出。
1. Where this paper sits1. 這篇論文的位置
Section 8.5 prices packet spraying in reordering and NIC state. A third price is observability. Under ECMP a 5-tuple names a path and a TTL names a switch, and the monitors of Chapter 10 rely on both. R-Pingmesh copies a training job's 5-tuples into its probes so that they take the job's paths every 10 ms, and it finds a faulty link by voting over failed paths. Under spraying the job's packets use every path, but a probe still takes only one. Alibaba's Stellar names this cost when it explains why it sprays in the NIC and not in the switch: packets with identical headers on many paths make monitoring and diagnosis harder. OPP accepts switch-side spraying and rebuilds probing for it. Host-side spraying, where the NIC still controls the path, gets only an appendix sketch (App. G).
第 8.5 節以亂序與 NIC 狀態來計算封包噴灑的代價。第三個代價是可觀測性。在 ECMP 下,5-tuple 指定一條路徑,TTL 指定一台交換器,而第 10 章 的監控系統兩者都依賴。R-Pingmesh 把訓練任務的 5-tuple 複製進探測,讓探測每 10 ms 走一次任務的路徑,並對失敗路徑投票找出故障鏈路。噴灑之下,任務的封包使用每一條路徑,探測卻仍只走一條。阿里的 Stellar 在解釋為何在 NIC 而不在交換器噴灑時點出了這個代價:標頭相同的封包分散在多條路徑上,使監控與診斷更困難。OPP 接受交換器端的噴灑,並為它重建探測。由主機端噴灑、NIC 仍控制路徑的情況,只在附錄中略述(App. G)。
2. The problem: one probe, one random path2. 問題:一個探測,一條隨機路徑
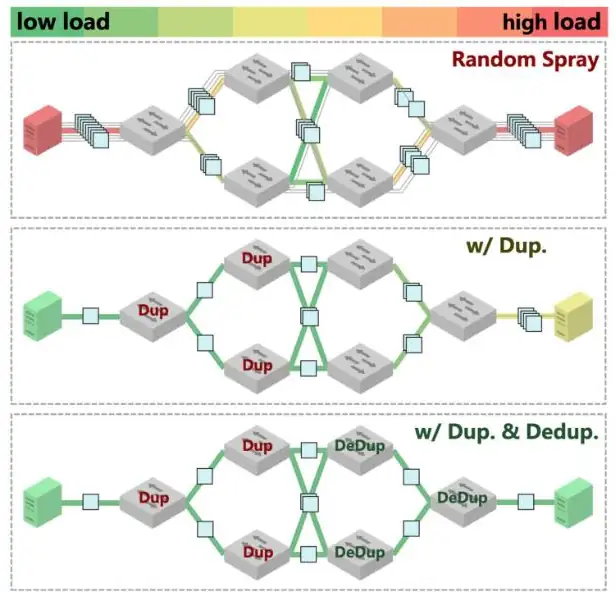
The paper lists two kinds of failure (Table 1). Device-level failures hit all traffic through a component: link flaps, a port down, a bad transceiver, congestion. Flow-level failures hit only flows that match certain table entries: a policer typed as 1 Gb/s instead of 10 Gb/s, a wrong DSCP in an ACL, an ACL drop rule, a routing loop, a missing PFC setting, or a table entry corrupted by a memory bit flip. Only a probe that copies the flow's headers catches the second kind, which is why service tracing exists. Spraying then causes two problems (Figure 1). Path ambiguity: a Traceroute probe that dies after TTL 2 could have died at any spine. Costly coverage: random probes revisit paths they have already seen.
論文列出兩類故障(Table 1)。裝置層級的故障影響通過某個元件的全部流量:鏈路抖動、埠失效、光模組故障、壅塞。流層級的故障只影響符合特定表項的流:把 10 Gb/s 打成 1 Gb/s 的 policer、ACL 中錯誤的 DSCP、ACL 丟棄規則、路由迴圈、漏設的 PFC,或被記憶體位元翻轉損壞的表項。只有複製流量標頭的探測抓得到第二類,這正是服務追蹤存在的原因。噴灑接著帶來兩個問題(圖 1)。路徑模糊:在 TTL 2 之後消失的 Traceroute 探測,可能死在任何一台 spine。涵蓋代價高:隨機探測會重複走已經看過的路徑。
How many random probes are enough? If each probe takes one of equal-cost paths at random, probes cover, on average, a fraction
多少個隨機探測才夠?若每個探測隨機走 條等價路徑中的一條, 個探測平均涵蓋的比例是
of them, and seeing every path takes probes on average, where is the -th harmonic number. This is the coupon-collector problem, the twin of the birthday arithmetic in chapter 06 §2. The table applies it to the paper's two scales; it is our arithmetic, not the paper's.
而看遍每條路徑平均需要 個探測, 是第 個調和數。這就是集郵問題,是第 8 章 06 第 2 節生日問題算術的孿生兄弟。下表把它套用到論文的兩種規模;這是我們的計算,不是論文的。
| Question問題 | Calculation算式 | Result結果 |
|---|---|---|
| Testbed, 1 random probe per task: a third of the tasks stay in the rack (1 path), two thirds cross it (2 paths)測試平台,每個任務 1 個隨機探測:三分之一的任務留在機櫃內(1 條路徑),三分之二跨機櫃(2 條路徑) | measured: about 66.5%實測:約 66.5% | |
| Same, 3 probes per task同上,每個任務 3 個探測 | measured: about 91%實測:約 91% | |
| 64-ary fat tree, paths between pods: probes for 99% average coverage64-ary fat tree,pod 之間 條路徑:平均涵蓋 99% 所需的探測數 | ||
| Same, expected probes to see every path同上,看遍每條路徑的期望探測數 |
If the testbed's four servers sit two per leaf, as its in-rack and cross-rack RTTs suggest, the formula reproduces the baselines' measured coverage curve. At , thousands of probes per flow every tracing period are out of reach.
若測試平台的四台伺服器每台 leaf 下兩台(它的機櫃內與跨機櫃 RTT 暗示如此),這個公式就重現了基準實測的涵蓋曲線。在 時,每個追蹤週期每條流數千個探測是做不到的。
3. The design3. 設計
OPP rests on one observation: under spraying, only the switch knows where a packet went. So the switch must record what each probe saw and decide how probes spread (Figure 1 of the paper).
OPP 建立在一個觀察上:噴灑之下,只有交換器知道封包去了哪裡。所以交換器必須記錄每個探測看到了什麼,並決定探測如何分散(論文 Figure 1)。
3.1 The OP cache and the probe3.1 OP cache 與探測封包
Every switch keeps an OmniPath (OP) cache, a table in the ingress pipeline indexed directly by a Token_ID that concurrency control assigns (§3.5), so entries never collide. A Token_Seq_No separates probe generations. An entry holds the flow ID, bitmaps of input and output ports, a path count, the largest queueing delay seen and its link, a faulty-link field, an expiration time and a loop flag: 42 bytes on Tofino. A probe copies the service flow's headers exactly; for RoCE that is the 5-tuple with destination port 4791 and a valid PSN. A reserved BTH value marks it, and the destination ToR rewrites its UDP ports so that the receiving host's queue pair never sees it. A few extra fields at the start of the payload carry the token, the source QP number for the return trip, the remaining hop count, and the previous hop's queueing delay and link.
每台交換器維護一個 OmniPath(OP)cache,這是入口管線中的表,直接以並行控制所分配的 Token_ID 為索引(第 3.5 節),所以表項永不碰撞。Token_Seq_No 區分探測的世代。一個表項存放流 ID、輸入與輸出埠的位圖、路徑數、看到的最大排隊延遲及其鏈路、故障鏈路欄位、到期時間與迴圈旗標:在 Tofino 上共 42 位元組。探測完全複製服務流的標頭;對 RoCE 而言就是目的埠 4791 的 5-tuple 與一個有效的 PSN。BTH 中的保留值標記它是探測,目的 ToR 會改寫它的 UDP 埠,讓接收主機的 queue pair 永遠看不到它。載荷開頭的幾個額外欄位帶著 token、回程用的來源 QP 編號、剩餘跳數,以及上一跳的排隊延遲與鏈路。
3.2 Copy where paths branch, drop where they merge3.2 分岔處複製,匯合處丟棄
A switch compares the probe's Token_Seq_No with its entry. A newer number means a new probe: the switch fills the entry, sets Output_Ports to every equal-cost port in its routing table, and sends a copy on each. An equal number on a live entry means a duplicate that came over another path: the switch adds the ingress port to Input_Ports, keeps the larger queueing delay, sets the loop flag if the remaining hop count differs from the recorded one, and drops the copy. Older numbers are dropped. So exactly one copy crosses each equal-cost link. On egress every switch writes its own queueing delay and link into the probe and decrements the hop count.
交換器把探測的 Token_Seq_No 與表項比較。較新的編號代表新探測:交換器填好表項,把 Output_Ports 設為路由表中的每個等價埠,並在每個埠上各送一份。在有效表項上編號相同,代表從另一條路徑來的副本:交換器把入口埠加入 Input_Ports,保留較大的排隊延遲,若剩餘跳數與記錄不同就設定迴圈旗標,然後丟棄這份副本。較舊的編號直接丟棄。所以每條等價鏈路恰好只有一份副本通過。在出口,每台交換器把自己的排隊延遲與鏈路寫進探測,並把跳數減一。
3.3 ACKs merge on the way back3.3 ACK 在返程中合併
The ACK retraces the tree. At each switch it must match the entry's Token_Seq_No. The switch merges the ACK's results into the entry: the maximum queueing delay and its link, any faulty link, and the sum of the path counts. Then it clears the ACK's ingress port in Output_Ports. While bits remain, it drops the ACK. When Output_Ports reaches zero, every branch has answered, and the switch sends one merged ACK to every port in Input_Ports. The ACK that reaches the source host summarizes all paths: how many there are, the worst queue and where it was, and which link failed (Figure 2).
ACK 沿著樹原路返回。在每台交換器,它必須符合表項的 Token_Seq_No。交換器把 ACK 的結果合併進表項:最大排隊延遲及其鏈路、任何故障鏈路,以及路徑數的總和。接著清掉 ACK 入口埠在 Output_Ports 中的位元。只要還有位元未清,就丟棄這個 ACK。當 Output_Ports 歸零,每個分支都已回覆,交換器便向 Input_Ports 中的每個埠送出一個合併後的 ACK。抵達來源主機的 ACK 總結了所有路徑:共有幾條、最糟的佇列在哪裡,以及哪條鏈路故障(圖 2)。
3.4 Timers that point at the fault3.4 指向故障的計時器
If a branch never answers, the entry expires. Its deadline is the arrival time plus the remaining hop count times , a per-hop budget sized to the largest queueing delay, for example 10 ms, so that congestion is not taken for loss. A switch nearer the destination has fewer hops left and expires sooner, so the switch just upstream of a lost probe or ACK fires first (Figure 3). It marks the entry expired, names a port still set in Output_Ports as Faulty_Link, and sends an ACK upstream. A scanner packet from the switch's packet generator, recirculated to visit one entry per pass, finds expired entries. The host agent then reports congestion if the maximum queueing delay passes a threshold, and loss on Faulty_Link if that field is set.
若某個分支始終沒有回覆,表項就會到期。到期時間是抵達時間加上剩餘跳數乘以 ,這是依最大排隊延遲設定的每跳預算,例如 10 ms,避免把壅塞誤當成遺失。越靠近目的地的交換器剩餘跳數越少、越早到期,所以緊鄰遺失探測或 ACK 上游的那台交換器最先觸發(圖 3)。它把表項標為到期,把 Output_Ports 中仍為 1 的埠記為 Faulty_Link,並向上游送出 ACK。交換器封包產生器發出的掃描封包經重新循環、每輪走訪一個表項,找出到期的表項。主機代理程式接著在最大排隊延遲超過門檻時回報壅塞,在 Faulty_Link 有值時回報該鏈路遺失。
3.5 Copies that use the unicast table, and tokens3.5 使用單播表的副本,以及 token
Native multicast would copy a probe in the switch's replication engine, with its own group table. A unicast routing error, such as a forwarding loop, could then go unseen, because the copies never use the unicast table that the service flow uses. OPP's unicast-based simulated multicast (USM) repeats ordinary unicast lookups instead. It forwards the probe on the chosen port, clears that port's bit, and mirrors a copy into the recirculation port to look up again, until every equal-cost port is covered (Figure 3 of the paper).
原生多播會在交換器的複製引擎中、用它自己的群組表複製探測。這樣一來,單播路由錯誤(例如轉送迴圈)可能看不出來,因為副本從不使用服務流所用的單播表。OPP 的單播模擬多播(USM)改為反覆做一般的單播查表。它把探測從選中的埠送出、清掉該埠的位元,並把一份副本鏡像到重新循環埠再查一次,直到每個等價埠都涵蓋為止(論文 Figure 3)。
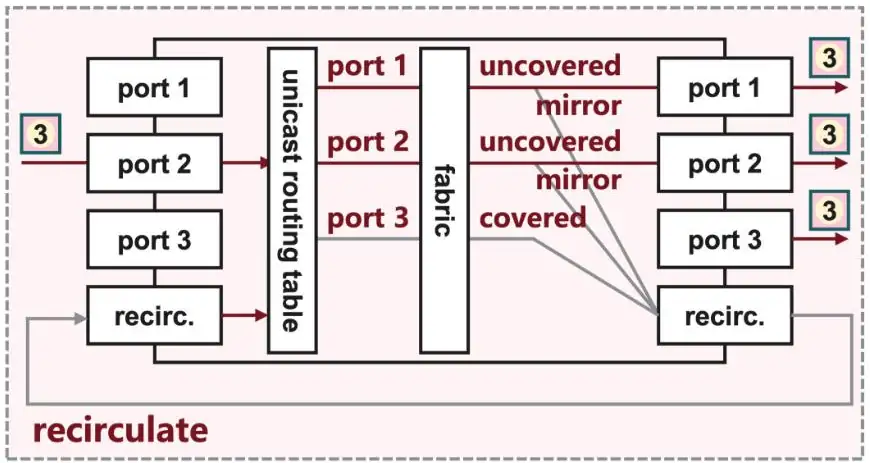
Recirculation costs bandwidth and delay, so only a sampled share of probes uses USM, 10% by default; round-robin gives every task a USM probe every periods, and the rest use native multicast. Tokens bound memory. Each task group, such as one source ToR and one destination pod in a fat tree, gets as many tokens as entries the switches reserve for it, and a probe holds its token until its ACK returns. For a -ary fat tree a core switch would need entries, 131,072 at with (App. D.1, analysis). So core switches keep no OP cache, and the path from source aggregation switch through the core to destination aggregation switch counts as one logical link, which coarsens localization.
重新循環要花頻寬與延遲,所以只有抽樣比例 的探測使用 USM,預設 10%;以輪替方式讓每個任務每 個週期有一個 USM 探測,其餘用原生多播。token 限制記憶體用量。每個任務群組(例如 fat tree 中一台來源 ToR 加一個目的 pod)得到的 token 數等於交換器為它保留的表項數,探測在 ACK 返回之前一直持有它的 token。對 -ary fat tree,一台核心交換器需要 個表項,在 、 時是 131,072 個(App. D.1,分析)。所以核心交換器不設 OP cache,從來源聚合交換器經核心到目的聚合交換器的路徑被當成一條邏輯鏈路,定位因此變粗。
4. Implementation4. 實作
The switch side is P4 on Intel Tofino: the OP cache is a set of register arrays, and USM uses the recirculation port and mirroring. For 4,096 entries of 42 bytes, the compiler reports 3.43% of SRAM, 22.92% of the stateful ALUs and 10.48% of the exact-match crossbar (Table 8, in the appendix). The measured pipeline latency with OPP is 387 ns at ingress and 269 ns at egress. The host side is a DPDK agent that builds probes, runs the token scheme over ZeroMQ and localizes failures. Table 5 maps the three data-plane primitives (cache update, USM, expiration) to Huawei NP, Juniper Trio and Broadcom Trident chips, but only Tofino was built; Trident has no documented packet generator, so its expiration ACKs would need the control plane.
交換器端以 P4 實作在 Intel Tofino 上:OP cache 是一組暫存器陣列,USM 使用重新循環埠與鏡像。對 4,096 個 42 位元組的表項,編譯器報告用掉 3.43% 的 SRAM、22.92% 的 stateful ALU 與 10.48% 的 exact-match crossbar(Table 8,在附錄中)。加上 OPP 後量到的管線延遲是入口 387 ns、出口 269 ns。主機端是 DPDK 代理程式,負責產生探測、透過 ZeroMQ 執行 token 機制並定位故障。Table 5 把三個資料平面原語(cache 更新、USM、到期)對應到華為 NP、Juniper Trio 與 Broadcom Trident 晶片,但只實作了 Tofino;Trident 沒有公開的封包產生器,所以它的到期 ACK 得靠控制平面。
5. What was measured5. 量到了什麼
Setup. The testbed is a leaf–spine with 2 leaves, 2 spines and 4 servers, 100 Gb/s links, Mellanox ConnectX-5 NICs and OPP on Tofino. Base RTT is about 8 µs inside a rack and 11 µs across racks. All-to-all traffic repeated 32 times gives 96 service flows per server, and every probe uses USM. The baselines, R-Pingmesh* and RD-Probe*, are the authors' versions of R-Pingmesh (Ping plus Traceroute) and RD-Probe (Ping plus mirroring), adapted to spraying. The authors say the testbed mainly shows hardware feasibility.
設定。測試平台是 2 台 leaf、2 台 spine、4 台伺服器的 leaf–spine,100 Gb/s 鏈路、Mellanox ConnectX-5 網卡,OPP 跑在 Tofino 上。機櫃內的基本 RTT 約 8 µs,跨機櫃約 11 µs。all-to-all 流量重複 32 次,得到每台伺服器 96 條服務流,每個探測都使用 USM。基準 R-Pingmesh* 與 RD-Probe* 是作者把 R-Pingmesh(Ping 加 Traceroute)與 RD-Probe(Ping 加鏡像)改成適用噴灑的版本。作者表示這個平台主要證明硬體可行性。
| Quantity (testbed)項目(測試平台) | Measured實測 | Source出處 |
|---|---|---|
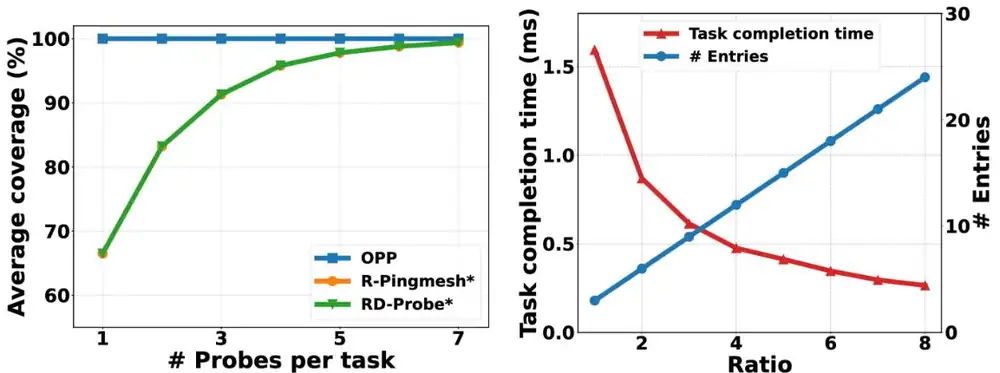
| Average path coverage, 1 probe per task平均路徑涵蓋率,每個任務 1 個探測 | OPP 100%; baselines ≈66.5%, ≈99.5% only after 7 probesOPP 100%;基準約 66.5%,要 7 個探測才約 99.5% | Fig. 12(a) |
| Time for all probe tasks of a period, and OP-cache entries一個週期內全部探測任務的完成時間,與 OP cache 表項數 | ≈1.6 ms with 3 entries; ≈0.27 ms with 243 個表項約 1.6 ms;24 個表項約 0.27 ms | Fig. 12(b) |
| Probe and ACK packets per switch at 99% coverage or more涵蓋率達 99% 以上時每台交換器的探測與 ACK 封包數 | 576 vs 2,688 for both baselines576,兩個基準皆為 2,688 | appendix table (not peer-reviewed)附錄表格(未經同儕審查) |
| Extra residence of a USM copy at the upstream ToRUSM 副本在上游 ToR 多停留的時間 | 1.31 µs average, 0.66 µs P50, 4.59 µs P99平均 1.31 µs、P50 0.66 µs、P99 4.59 µs | appendix table (not peer-reviewed)附錄表格(未經同儕審查) |
| Peak recirculation rate, 1 to 4 diagnostic instances重新循環峰值速率,1 到 4 個診斷實例 | 2.4 to 9.8 Gb/s2.4 到 9.8 Gb/s | appendix table (not peer-reviewed)附錄表格(未經同儕審查) |
Figure 12 of the paper shows the first two rows. On a fabric this small every cross-rack choice is between two spines, so the result proves that the mechanism works on real switches, not that it scales. The scale results, a 64-ary fat tree with 1,024 paths between pods, the savings in probes, traffic and SRAM, and 10-ms-level tracing, come from NS-3, as the authors state, and are not shown here.
論文 Figure 12 呈現前兩列。在這麼小的網路裡,每次跨機櫃的選擇只有兩台 spine,所以結果證明的是機制能在真實交換器上運作,而不是它能擴展。大規模結果——pod 之間 1,024 條路徑的 64-ary fat tree、探測數、流量與 SRAM 的節省,以及 10 ms 等級的追蹤——如作者所言來自 NS-3,本頁不列出。
6. Limits and open questions6. 限制與未解的問題
The paper's own limits: the testbed is too small for the scale claims; core switches keep no cache, so a fault is placed only on an aggregation–core–aggregation segment; loops need a second phase that re-sends the probe with ACLs that admit only the expected path's switches; the grouping heuristic for arbitrary topologies has no guarantee; only Tofino is built; and spraying's flow-table and reordering problems remain open. A careful reader adds five.
論文自己的限制:測試平台太小,撐不起規模上的主張;核心交換器沒有 cache,所以故障只能定位到聚合–核心–聚合的一段;迴圈需要第二階段,用只允許預期路徑上交換器的 ACL 重送探測;任意拓樸的分組啟發法沒有保證;只實作了 Tofino;噴灑帶來的流表與亂序問題仍未解決。細心的讀者還會補上五點。
- Probes are not service traffic. A duplicated probe shows that every path works, not what the flow's sprayed packets experience. A queue that builds only under the flow's own load, or adaptive routing that avoids a bad port, is invisible, and the paper does not ask whether every equal-cost port is the right target for adaptive routing.探測不是服務流量。被複製的探測證明每條路徑都通,而不是流的噴灑封包實際經歷了什麼。只在流自身負載下才形成的佇列,或避開壞埠的自適應路由,都看不到;論文也沒有討論對自適應路由而言,涵蓋每個等價埠是否就是正確的目標。
- Intermittent faults need more than one probe. A flapping link must be crossed while it is down. The paper's own simulations need several OPP probes for flapping, so "one probe" holds for persistent faults.間歇性故障需要不只一個探測。抖動的鏈路必須在它斷線時被走過。論文自己的模擬中,抖動需要好幾個 OPP 探測,所以「一個探測」只對持續性故障成立。
- A heavy switch dependency. OPP needs stateful data planes with recirculation and mirroring on every ToR and aggregation switch. Fabrics that spray in the NIC (Stellar, PSN-PATH, Falcon, Ultra Ethernet) get only the unevaluated App. G sketch. With ms per hop, a loss deep in a path is reported only after tens of milliseconds, and there is no study of against false alarms under heavy congestion.高度依賴交換器。OPP 需要每台 ToR 與聚合交換器都有支援重新循環與鏡像的有狀態資料平面。在 NIC 噴灑的網路(Stellar、PSN-PATH、Falcon、Ultra Ethernet)只有附錄 G 一段未經評估的略述。每跳 ms 時,路徑深處的遺失要數十毫秒後才回報,也沒有研究在重度壅塞下 與誤報之間的關係。
- Internal mismatches. The completion time that §6.1.2 states for the 64-ary fat tree does not match its own Figure 10(a); it fits a higher USM sampling rate in Figure 14(a). The testbed's "2 ms" is about 1.6 ms in Figure 12(b). The "under 4% of SRAM" for the fat tree's cache extrapolates the 4,096-entry Tofino build. "Full accuracy with a single probe" does not hold for link flapping.內部不一致。§6.1.2 為 64-ary fat tree 寫的完成時間與它自己的 Figure 10(a) 不符,反而符合 Figure 14(a) 中較高的 USM 抽樣率。測試平台的「2 ms」在 Figure 12(b) 中約為 1.6 ms。fat tree cache「少於 4% SRAM」是從 4,096 個表項的 Tofino 版本外推而來。「單一探測即完全準確」對鏈路抖動不成立。
- Workload and evidence. The flow sets come from a parallelism recipe, not traces, and no GPU is involved. Both baselines are the authors' adaptations, and the overhead tables come from appendices that the paper marks as not peer-reviewed.工作負載與證據。流的集合來自平行化的配方而非實際紀錄,也沒有用到 GPU。兩個基準都是作者自己的改編,開銷表格則來自論文標明未經同儕審查的附錄。
7. How it connects7. 與其他內容的關聯
- R-Pingmesh is the direct ancestor: OPP keeps its service tracing, eBPF flow discovery and 10 ms period, and replaces voting over random paths with per-hop records merged in the switch. SkeletonHunter is another service-tracing system that assumes ECMP.R-Pingmesh 是直接的前身:OPP 保留它的服務追蹤、eBPF 流發現與 10 ms 週期,並用在交換器中合併的逐跳紀錄取代對隨機路徑的投票。SkeletonHunter 是另一個假設 ECMP 的服務追蹤系統。
- Stellar rejected switch spraying partly because it hides paths. OPP answers that objection for switch spraying, but Stellar sprays in the NIC, the case OPP leaves open.Stellar 不採用交換器噴灑,部分原因是它會隱藏路徑。OPP 對交換器噴灑回應了這個疑慮,但 Stellar 是在 NIC 噴灑,正是 OPP 尚未處理的情況。
- SGLB in packet mode would create the same path ambiguity; its microsecond failure handling is the control-plane side of what OPP does for diagnosis.SGLB 的封包模式會造成同樣的路徑模糊;它微秒級的故障處理,是 OPP 診斷工作在控制平面上的對應。
- PSN-PATH steers lanes from the host over plain ECMP, the host-side case of App. G, and it would break under the switch spraying OPP assumes.PSN-PATH 由主機在一般 ECMP 上控制通道,屬於附錄 G 的主機端情況;在 OPP 所假設的交換器噴灑下,它會失效。
- Chapter 10 calls the time to notice a fault the detection term ; OPP keeps short on sprayed fabrics. The coupon-collector arithmetic of §2 is the twin of chapter 06 §2.第 10 章 把發現故障的時間稱為偵測項 ;OPP 讓噴灑網路上的 保持很短。第 2 節的集郵算術則是第 8 章 06 第 2 節的孿生兄弟。
Key numbers關鍵數字
| Number | 數字 | Meaning (testbed: 2 leaves, 2 spines, 4 servers, 100 Gb/s, Tofino) | 意義(測試平台:2 leaf、2 spine、4 伺服器、100 Gb/s、Tofino) |
|---|---|---|---|
| 100% vs ≈66.5% | Path coverage with 1 probe per task, OPP vs Ping-based baselines (measured) | 每個任務 1 個探測的路徑涵蓋率,OPP 對基於 Ping 的基準(實測) | |
| 576 vs 2,688 | Probe and ACK packets per switch at 99% coverage or more (measured; appendix) | 涵蓋率達 99% 以上時每台交換器的探測與 ACK 封包(實測;附錄) | |
| ≈1.6 ms, 3 entries | Time to finish a period's probe tasks, and OP-cache entries used (measured) | 完成一個週期探測任務的時間,與所用的 OP cache 表項(實測) | |
| 1.31 µs | Average extra switch residence of a USM copy (measured; appendix) | USM 副本在交換器多停留的平均時間(實測;附錄) | |
| 387 / 269 ns | Tofino ingress / egress pipeline latency with OPP (measured) | 加上 OPP 後 Tofino 入口 / 出口管線延遲(實測) | |
| 42 B; 3.43% | Size of one OP-cache entry; SRAM share of 4,096 entries on Tofino (compiler report) | 一個 OP cache 表項的大小;Tofino 上 4,096 個表項占用的 SRAM(編譯器報告) | |
| ≈4,714 | Random probes for 99% average coverage of 1,024 paths (our analysis) | 隨機探測平均涵蓋 1,024 條路徑的 99% 所需數量(我們的分析) | |
| 131,072 | Entries a 64-ary fat tree's core switch would need, (paper's analysis) | 64-ary fat tree 核心交換器需要的表項數 (論文的分析) |
Terms used on this page本頁用到的術語
- Service tracing
- Probing with packets that copy a live flow's headers, so that the flow's table entries are exercised.
- 用複製實際流量標頭的封包探測,使那條流所用的表項被實際走過。
- Device-level / flow-level failure
- A fault that hits all traffic through a component, versus one that hits only flows matching certain entries (ACL, policer, route, a bit-flipped entry).
- 影響通過某元件全部流量的故障,對比只影響符合特定表項之流的故障(ACL、policer、路由、位元翻轉的表項)。
- Coupon-collector problem
- The number of random draws needed to see all items, on average.
- 隨機抽取直到看遍全部 項所需的次數,平均為 。
- OP cache
- OPP's per-switch table of probe state and per-hop results, indexed by Token_ID; Token_Seq_No marks the probe generation.
- OPP 在每台交換器上存放探測狀態與逐跳結果的表,以 Token_ID 索引;Token_Seq_No 標示探測世代。
- Duplication / deduplication
- Copying a probe to every equal-cost port where paths branch / forwarding only the first copy where they merge.
- 在路徑分岔處把探測複製到每個等價埠 / 在匯合處只轉送第一份。
- USM
- Unicast-based simulated multicast: copies made by repeated unicast lookups through the recirculation port, so unicast faults stay visible.
- 以單播模擬的多播:透過重新循環埠反覆做單播查表來產生副本,讓單播故障仍看得見。
- Per-hop timeout; an entry expires after the remaining hops times and reports an unanswered port as the faulty link.
- 每跳逾時;表項在剩餘跳數乘以 後到期,並把未回覆的埠回報為故障鏈路。