Alibaba Stellar: A New Generation RDMA Network for Cloud AIAlibaba Stellar:面向雲端 AI 的新一代 RDMA 網路
After reading, you can explain how Alibaba's own RNIC sprays each RDMA connection over 128 paths under one congestion window and a 250 µs timer, and how it virtualizes RDMA for secure containers.讀完後,你能說明阿里自研的 RNIC 如何在一個壅塞窗口與 250 µs 計時器之下,把每條 RDMA 連線噴灑到 128 條路徑,以及它如何為安全容器虛擬化 RDMA。
Alibaba Cloud's AI jobs run in secure containers that use RDMA over its HPN fabric. SR-IOV virtual functions capped device counts and forced all container memory to be pinned; single-path RoCE sent each connection along one hashed path. Stellar, on Alibaba's own FPGA-based 400G RNIC, pins memory on first use (PVDMA), keeps final address translations in the RNIC (eMTT), and sprays each connection obliviously over 128 paths under one congestion window, resending lost packets on another path after a 250 µs timeout. Production monitoring reports 15× faster container start-up (30× elsewhere in the paper) and 90% shorter switch queues (baseline not stated). On 1,024 GPUs against ConnectX-7, training gained 6% on average and up to 14% with random rank placement, but only 0.72% with locality-aware placement.
阿里雲的 AI 任務在安全容器中執行,透過 HPN 網路使用 RDMA。SR-IOV 虛擬功能限制了裝置數量,並迫使容器的全部記憶體都被釘住;單路徑 RoCE 讓每條連線只走一條雜湊選出的路徑。Stellar 建在阿里自研、以 FPGA 實作的 400G RNIC 上:第一次使用時才釘住記憶體(PVDMA),把最終的位址轉換存在 RNIC 裡(eMTT),並在一個壅塞窗口之下把每條連線不看狀態地噴灑到 128 條路徑,遺失的封包在 250 µs 逾時後改走另一條路徑重送。生產監控回報容器啟動快 15 倍(論文另一處寫 30 倍),交換器佇列短 90%(未說明基準)。在 1,024 顆 GPU 上與 ConnectX-7 相比,隨機擺放 rank 時訓練平均快 6%、最多快 14%,考慮位置的擺放下只快 0.72%。
1. Where this paper sits1. 這篇論文的位置
The Chapter 7 (§6) ends with a direction: make loss and reordering cheap in the NIC, then spray packets over many paths. The Chapter 8 (§5) has "no production paper with numbers for adaptive routing on training traffic". Stellar rejects adaptive routing in switches but gives production numbers for spraying by the NIC.
第 7 章(§6)的結尾給的是方向:在 NIC 裡讓丟包與亂序變便宜,然後把封包噴灑到許多路徑。第 8 章(§5)則「沒有一篇針對訓練流量的自適應路由給出數字的生產環境論文可引」。Stellar 不採用交換器上的自適應路由,但為由 NIC 執行的噴灑給出了生產數字。
It also continues the HPN reading: HPN could not change its NIC-resident transport, so it left each ToR's 60-way uplink choice to host software. Stellar runs on that fabric (HPN7.0) with Alibaba's own RNIC. We cover the paper's container half briefly and its network half in full.
它也延續了 HPN 導讀:HPN 無法修改放在 NIC 裡的傳輸層,所以把每台 ToR 60 選 1 的上行選擇留給主機軟體。Stellar 用阿里自己的 RNIC 跑在同一個網路(HPN7.0)上。本頁簡述論文的容器那一半,網路那一半則完整講解。
2. The problem, measured2. 問題,用量測說話
Each job runs in a RunD secure container, a container inside a lightweight virtual machine. The old design passed each container an SR-IOV virtual function (VF), an RNIC slice with its own PCIe address (BDF), and gave each connection one port and one path. §3.1 lists six problems (Figure A):
每個任務都在 RunD 安全容器裡執行,也就是跑在輕量虛擬機中的容器。舊設計把一個 SR-IOV 虛擬功能(VF),即 RNIC 上有自己 PCIe 位址(BDF)的切片,傳給每個容器,並讓每條連線只用一個埠、一條路徑。§3.1 列出六個問題(圖 A):
- VFs are fixed at host start-up; each reserves 63 queues and 2.4 GB.VF 在主機啟動時固定;每個保留 63 個佇列與 2.4 GB。
- VFIO pins all container memory before start: about 390 s for 1.6 TB.VFIO 在啟動前釘住容器的全部記憶體:1.6 TB 約需 390 s。
- A PCIe switch's lookup table (LUT) holds 32 BDFs, capping GPUDirect RDMA (GDR) at 32 VFs per server; inference runs over 100 containers per server.PCIe 交換器的查找表(LUT)只容納 32 個 BDF,使 GPUDirect RDMA(GDR)每台伺服器最多 32 個 VF;推論每台伺服器超過 100 個容器。
- The IOMMU mode that GDR needs slowed host TCP.GDR 需要的 IOMMU 模式拖慢主機 TCP。
- TCP flow-steering rules in the RNIC's switch delayed RDMA.RNIC 內建交換器的 TCP 導流規則延遲了 RDMA。
- Jobs spanning pods hit "a serious hash imbalance problem" at the core layer.橫跨多個 pod 的任務在核心層遇到「嚴重的雜湊不平衡問題」。
Problems 4–6 have no numbers. A seventh is in §6: the RNIC's address translation cache (ATC) holds "tens of thousands of pages", and on a ConnectX-6 testbed GDR fell from 190 to 170 Gb/s above 2 MB messages and to about 150 Gb/s above 32 MB, an MTT-style cache miss (Section 7.1).
問題 4–6 沒有數字。§6 還有第七個:RNIC 的位址轉換快取(ATC)只容納「數萬個分頁」;在 ConnectX-6 測試平台上,GDR 吞吐在訊息超過 2 MB 時從 190 降到 170 Gb/s、超過 32 MB 時降到約 150 Gb/s,這是 MTT 式的快取失誤(第 7.1 節)。
3. The design3. 設計
3.1 Para-virtualized RDMA: vStellar, PVDMA and eMTT3.1 半虛擬化 RDMA:vStellar、PVDMA 與 eMTT
Stellar removes SR-IOV. Each container gets virtio-net for TCP, over scalable functions (SFs) made on demand, and virtio-vStellar for RDMA. Control operations pass through virtio so the host can check them; data operations bypass it with direct doorbells and memory access, as in HyV and MasQ. All virtual devices share one BDF, so VF count and LUT size no longer limit GDR (up to 64K devices, 1.5 s each).
Stellar 拿掉了 SR-IOV。每個容器拿到承載 TCP 的 virtio-net(建在隨需建立的 scalable function,SF 上)與承載 RDMA 的 virtio-vStellar。控制操作經過 virtio,讓主機可以檢查;資料操作則像 HyV 與 MasQ 一樣繞過它,直接敲 doorbell、直接存取記憶體。所有虛擬裝置共用一個 BDF,所以 VF 數量與 LUT 大小不再限制 GDR(最多 64K 個裝置,每個 1.5 s)。
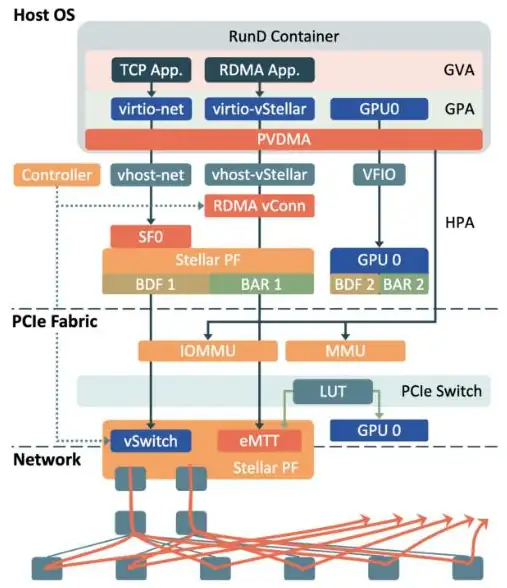
PVDMA (para-virtualized DMA) pins memory on the first DMA to a region, in 2 MiB blocks, and later DMAs hit a map cache; after a GPU queue in a shared block wrote into the 4 KiB doorbell, the doorbell moved to virtio shared memory. eMTT stores the final guest-virtual to host-physical mapping and the memory owner in the RNIC's large MTT, so a GDR write leaves marked as translated (PCIe address type 0b10) and the PCIe switch sends it straight to the GPU, past the root complex and the ATC.
PVDMA(半虛擬化 DMA)在對某區域第一次 DMA 時才以 2 MiB 區塊釘住記憶體,之後的 DMA 命中 map cache;曾有共用區塊裡的 GPU 佇列寫進 4 KiB 的 doorbell,所以 doorbell 改放在 virtio 共享記憶體。eMTT 把最終的 guest 虛擬到主機實體位址對應與記憶體擁有者存在 RNIC 容量很大的 MTT 裡,所以 GDR 寫入離開時就標記為已轉換(PCIe 位址類型 0b10),PCIe 交換器直接把它送到 GPU,不經過 root complex 與 ATC。
3.2 Where to balance: the NIC, not the switch3.2 在哪裡平衡:NIC,而不是交換器
§7.1 of the paper weighs four ways to use several paths:
論文 §7.1 衡量了使用多條路徑的四種方式:
| Option選項 | Verdict and reason結論與理由 |
|---|---|
| Traffic engineering (routing §3)流量工程(路由 §3) | Rejected: central, reactive, "best suited for single-tenant scenarios"不採用:集中式、被動反應,「最適合單一租戶的情境」 |
| Flowlet switchingFlowlet switching | Not for RDMA bulk traffic; kept on older clusters不適合 RDMA 的大量傳輸;保留在較舊的叢集 |
| Adaptive routing or spraying in switches交換器上的自適應路由或噴灑 | Rejected: receivers must reorder, and identical headers on many paths break monitoring不採用:接收端必須處理亂序,相同標頭走許多路徑也會破壞監控 |
| Multipath in the RNICRNIC 內的多路徑 | Adopted採用 |
The monitoring point is an operator's point: a tool that traces a header to one path fails when switches scatter identical headers.
監控的理由是營運者的理由:把一個標頭追到一條路徑的工具,在交換器把相同標頭四處分散時就失效了。
3.3 Oblivious spraying over 128 paths3.3 在 128 條路徑上不看狀態地噴灑
§7.2 tests BestRTT, round robin (RR), dynamic weighted round robin (DWRR), MPRDMA and oblivious packet spraying (OBS: a pseudo-random path per packet, no per-path state) against single-path RDMA. Alibaba deployed OBS with 128 paths, the simplest in hardware and the best in static and bursty tests.
§7.2 拿 BestRTT、round robin(RR)、dynamic weighted round robin(DWRR)、MPRDMA 與不看狀態的封包噴灑(OBS:每個封包一條偽隨機路徑、不保留逐路徑狀態)和單路徑 RDMA 比較。阿里部署的是 128 條路徑的 OBS,硬體上最簡單,在靜態與突發測試中也最好。
Why does the count matter more than the algorithm? In the balls-in-bins view of Section 8.2, connections of paths put balls into uplink bins, each ball carrying of the traffic. An uplink's load then has a relative spread of about
為什麼路徑數比演算法重要?用第 8.2 節 的球與箱子來看: 條連線、每條 條路徑,等於把 顆球丟進 個上行箱子,每顆球承載 的流量。一條上行的負載的相對離散度約為
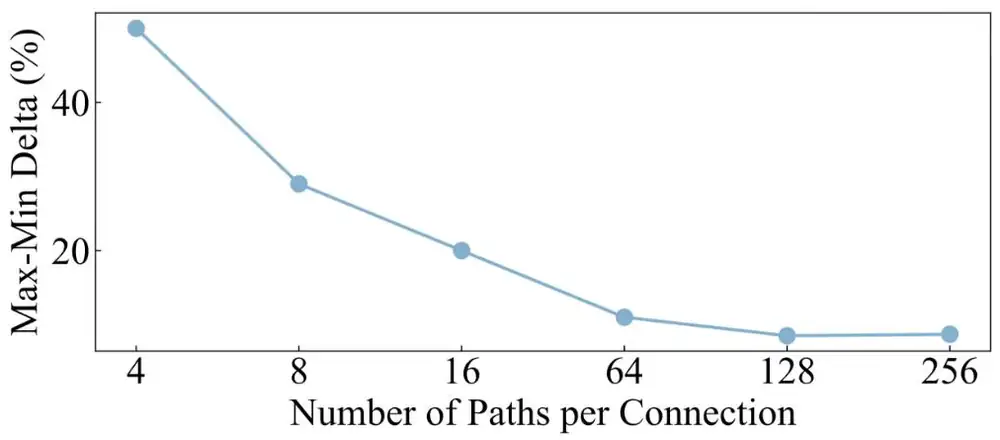
With Figure 12's and HPN's aggregation switches per plane, 4 paths per connection give a spread of about 97% and about 20 idle uplinks; 128 paths give about 17% (Figure B). Only matters: more connections help as much as more paths, which is Meta's QP scaling (Section 8.6) inside one connection.
以 Figure 12 的 與 HPN 每個平面 台聚合交換器計算:每條連線 4 條路徑時離散度約 97%,約 20 條上行閒置;128 條路徑時約 17%(圖 B)。只有 有影響:多開連線和多開路徑一樣有用,這就是 Meta 的 QP scaling(第 8.6 節),只是做在一條連線之內。
Panel 1 runs the model with the lossy-link view of §3.4 and the measured points of the paper's Figure 12.
面板 1 執行這個模型,加上 §3.4 的壞鏈路觀點與論文 Figure 12 的實測點。
3.4 One window, one 250 µs timer3.4 一個窗口、一個 250 µs 計時器
Spraying raises the state question of Section 7.6. Stellar keeps one congestion control context (CCC) per connection: one window for all 128 paths, set by an unnamed in-house algorithm from ECN and RTT. Per-path contexts would cost enough hardware to cut the paths "from 128 down to 4" (§9; Figure C). For regular training traffic Alibaba chose fan-out; a path-aware sprayer like SMaRTT-REPS or STrack gave no significant gain.
噴灑帶出第 7.6 節 的狀態問題。Stellar 每條連線只保留一個壅塞控制 context(CCC):128 條路徑共用一個窗口,由未具名的自研演算法依 ECN 與 RTT 調整。逐路徑 context 的硬體成本會讓路徑「從 128 條降到 4 條」(§9;圖 C)。面對規律的訓練流量,阿里選擇扇出;類似 SMaRTT-REPS 或 STrack 的路徑感知噴灑沒有帶來顯著增益。
Loss detection is a timer: after a 250 µs retransmission timeout (RTO), about 11 round trips of 22 µs, the RNIC resends on another path, so a dead link is bypassed until BGP reroutes. For a lossy link the paper argues dilution "by a factor of 128": if one of paths crosses a link with loss rate , the connection sees
偵測丟包靠的是計時器:250 µs 的重傳逾時(RTO,約為 22 µs 往返的 11 倍)之後,RNIC 改走另一條路徑重送,所以斷掉的鏈路會被繞開,直到 BGP 重新路由。對會丟包的鏈路,論文主張「降低 128 倍」的稀釋:若 條路徑中有一條經過丟包率 的鏈路,連線看到的是
For a 1% link and a 1 MB message (256 packets of 4 KB), one question per row:
以丟包 1% 的鏈路與 1 MB 訊息(256 個 4 KB 封包)為例,逐列計算如下:
| Question問題 | Calculation算式 | Result結果 |
|---|---|---|
| Loss seen, paper's bound: one of 128 paths crosses the link看到的丟包,論文的上界:128 條路徑中一條經過 | ||
| Our model, 60 uplinks: share of packets on the bad uplink, if used我們的模型,60 條上行:用到壞上行時,封包經過它的比例 | about 2.4 of 128 paths, not 1約為 128 條中的 2.4 條,而非 1 條 | |
| Loss seen, our model看到的丟包,我們的模型 | ||
| Losses per message, single path每則訊息的丟包數,單一路徑 | each waits for a 250 µs RTO每次都要等 250 µs 的 RTO | |
| Losses per message, paper's bound每則訊息的丟包數,論文的上界 | one in about 50 messages約每 50 則一次 | |
| Losses per message, our model每則訊息的丟包數,我們的模型 | one in about 20 messages約每 20 則一次 |
Spraying does not reduce the traffic on the bad link (about either way); it spreads the damage, from a few connections losing 1% to most losing about 0.02%. At a tier of 60 uplinks the factor is nearer 60 than 128.
噴灑並不減少經過壞鏈路的流量(兩種情況都約為 );它分散的是傷害:從少數連線各丟 1%,變成大多數連線各丟約 0.02%。在只有 60 條上行的那一層,這個因子比較接近 60 而不是 128。
4. Implementation4. 實作
The RNIC is Alibaba's FPGA-based 400G design (no board name or line count), deployed "for over one year" at an unstated scale; the host components are those of Figure 3. The testbed is two servers with 8 GPUs and 4 RNICs of 2 × 200 Gb/s each (CentOS 8, OFED 23.10); multipath tests ran on an HPN7.0 cluster of such servers, 50 GB/s per RNIC.
RNIC 是阿里以 FPGA 實作的 400G 設計(沒有板卡名稱或程式碼行數),已部署「超過一年」,規模未說明;主機端元件即論文圖 3 所示。測試平台是兩台伺服器,每台 8 顆 GPU 與 4 張 2 × 200 Gb/s 的 RNIC(CentOS 8、OFED 23.10);多路徑測試在由這種伺服器組成的 HPN7.0 叢集上進行,每張 RNIC 50 GB/s。
5. What was measured5. 量到了什麼
Stellar reports no simulation. Its production numbers come without baselines:
Stellar 沒有報告任何模擬。它的生產數字都沒有附上基準:
| Claim (production)宣稱(生產環境) | Caveat附註 |
|---|---|
| Container start-up 15× faster (abstract, §1)容器啟動快 15 倍(摘要、§1) | §4 says 30×; not reconciled§4 寫 30 倍;兩者未調和 |
| Switch queue length −90%交換器佇列長度 −90% | Baseline and method not stated未說明基準與量法 |
| Average RDMA throughput +1.37%平均 RDMA 吞吐 +1.37% | Baseline not stated未說明基準 |
| Training +14% (§1: "average")訓練 +14%(§1:「平均」) | §8.2: 14% is the maximum, 6% the average§8.2:14% 是最大值,平均是 6% |
Testbed. vStellar started a GPU pod in 9, 9 and 20 s for 32 GiB, 160 GiB and 1.6 TiB, against 14, 37 and 305 s for HyV/MasQ (Figure 6); §3.1's 390 s is VFIO pinning in the old design. GDR writes reached 393 Gb/s against 141 Gb/s. vStellar matched bare metal; a ConnectX-7 VF with VxLAN cost about 7% latency at 8 B and 9% bandwidth at 8 MB. Secure and regular containers trained in nearly identical time on 256 GPUs.
測試平台。vStellar 在 32 GiB、160 GiB 與 1.6 TiB 時分別以 9、9、20 s 啟動 GPU pod,HyV/MasQ 則為 14、37、305 s(Figure 6);§3.1 的 390 s 是舊設計中 VFIO 的釘住時間。GDR 寫入達 393 Gb/s,HyV/MasQ 為 141 Gb/s。vStellar 與裸機相當;ConnectX-7 的 VF 加 VxLAN 在 8 B 時多約 7% 延遲、在 8 MB 時少約 9% 頻寬。在 256 顆 GPU 上,安全容器與一般容器的訓練時間幾乎相同。
Multipath on HPN7.0. In a 120-flow permutation, 128 paths cut ToR queues "significantly". Beside two background 512-GPU AllReduce jobs, a third reached the RNIC's full 50 GB/s with RR or OBS over 128 paths, and under on-off background traffic OBS beat RR: its "pseudo-random nature interacts more favorably with our CC algorithm".
HPN7.0 上的多路徑。在 120 條流的置換測試中,128 條路徑讓 ToR 佇列「顯著下降」。在兩個 512 顆 GPU 的 AllReduce 背景任務旁,第三個任務以 RR 或 OBS 走 128 條路徑,用滿了 RNIC 的 50 GB/s;背景流量時開時關時,OBS 勝過 RR:它的「偽隨機性與我們的壅塞控制演算法互動得更好」。
How many paths. With 16 connections between two RNICs, ToR uplinks balanced only from 128 paths on (Figure 12). Our §3.3 model falls at about the same rate up to 128; the measurement then stops near 8.5%, which the paper explains only by its 60 aggregation switches, which make 128 paths "sufficient to uniformly cover all possible routes".
需要多少條路徑。兩張 RNIC 之間 16 條連線時,要到 128 條路徑以上 ToR 上行才均衡(Figure 12)。§3.3 的模型到 128 條為止以大致相同的速度下降;之後實測停在約 8.5%,論文只用 60 台聚合交換器解釋:它們讓 128 條路徑「足以均勻涵蓋所有可能的路由」。
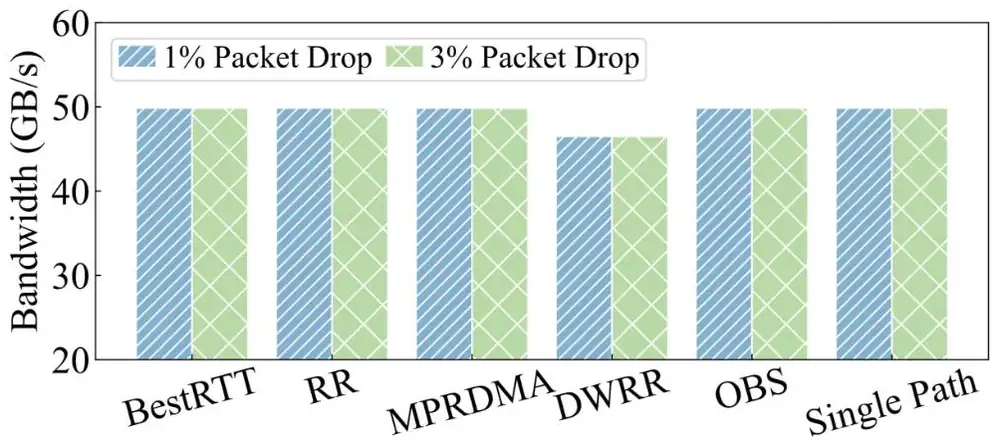
A lossy link. With one link dropping 1% or 3% of packets, a 960-GPU AllReduce over 128 paths showed "almost no observable performance degradation" for every multipath algorithm (Figure 11). The text does not explain the Single Path bar, also at 50 GB/s, so it is no evidence that single-path RDMA tolerates loss. Per HPN, a 10,000-GPU job sees a link failure every three days.
一條會丟包的鏈路。一條鏈路丟掉 1% 或 3% 的封包時,960 顆 GPU 的 AllReduce 走 128 條路徑,每種多路徑演算法都「幾乎觀察不到效能下降」(Figure 11)。內文沒有解釋同樣在 50 GB/s 的 Single Path 長條,所以它不能當作單路徑 RDMA 能承受丟包的證據。依 HPN 的數據,10,000 顆 GPU 的任務每三天遇到一次鏈路故障。
Training. On 1,024 GPUs in two segments, GPT-7B to 175B and an MoE model ran in regular containers against "a state-of-the-art (SOTA) solution based on the CX7 RNIC":
訓練。在兩個 segment 的 1,024 顆 GPU 上,GPT-7B 到 175B 與一個 MoE 模型在一般容器中執行,對手是「以 CX7 RNIC 為基礎的最先進(SOTA)方案」:
| Placement擺放方式 | What it does做法 | Stellar vs ConnectX-7Stellar 對 ConnectX-7 |
|---|---|---|
| RerankingReranking | Co-locates communicating GPUs讓互相通訊的 GPU 放在一起 | +0.72% on average平均 +0.72% |
| Random ranking隨機 ranking | "Simulates a cluster with many small, uncoordinated jobs"「模擬有許多小型、互不協調任務的叢集」 | +6% on average, +14% at most平均 +6%,最多 +14% |
Good placement leaves little heavy traffic at a hashed choice (Section 8.6), so spraying has little to fix; random placement creates the congestion it relieves. Per-model values are only in Figure 16.
擺放得好時,很少重流量會遇上雜湊選擇(第 8.6 節),噴灑沒剩多少可修;隨機擺放則製造出噴灑能紓解的壅塞。各模型的數值只在論文 Figure 16 裡。
6. Limits and open questions6. 限制與未解的問題
- The receiver is not described. The paper does not say how Stellar handles out-of-order packets, which header field selects the path, or whether PFC is on.接收端沒有被描述。論文沒有說 Stellar 如何處理亂序封包、哪個標頭欄位決定路徑,也沒說 PFC 是否開啟。
- Numbers that disagree. Start-up 15× vs 30×; 390 s vs 305 s; §1's "average" 14% vs §8.2's average 6%, maximum 14%.彼此不一致的數字。啟動 15 倍對 30 倍;390 s 對 305 s;§1 的「平均」14% 對 §8.2 的平均 6%、最多 14%。
- Missing baselines. The −90% and +1.37% have none; the ConnectX-7 baseline's paths and queue pairs and the CC algorithm are not described.缺少基準。−90% 與 +1.37% 都沒有基準;ConnectX-7 基準的路徑數與 queue pair 數,以及壅塞控制演算法,都沒有描述。
- Timers. Dilution makes losses rare, not cheaper: each still costs a 250 µs wait (Section 7.2).計時器。稀釋讓丟包變少,卻不讓它變便宜:每次仍要等 250 µs(第 7.2 節)。
- Regular traffic. One hot path shrinks the window of all 128; the authors expect path-aware spraying may be needed later. MoE results are only in Figure 16; the largest test is 1,024 GPUs.規律的流量。一條熱路徑會縮小全部 128 條的窗口;作者預期日後可能需要路徑感知的噴灑。MoE 的結果只在 Figure 16 裡;最大的測試是 1,024 顆 GPU。
7. How it connects7. 與其他內容的關聯
- Section 7.6: a deployed, loss-tolerant spraying NIC with one shared window. Section 8.5: the site's first production numbers for spraying; §6: 0.72% against 6% backs "the strongest lever is placement".第 7.6 節:一張能容忍丟包、做噴灑、只用一個共用窗口的已部署 NIC。第 8.5 節:本站第一組噴灑的生產數字;§6:0.72% 對 6% 支持「最強的槓桿是配置」。
- HPN: the same fabric; its −91.8% and Stellar's −90% have different baselines. IRN: why accepting reordering makes spraying possible. Meta RoCE: the traffic engineering Stellar rejects. Astral: Tencent keeps per-flow ECMP.HPN:同一個網路;它的 −91.8% 與 Stellar 的 −90% 基準不同。IRN:為何接受亂序讓噴灑成為可能。Meta RoCE:Stellar 不採用的流量工程。Astral:騰訊保留逐流 ECMP。
- Other transport digests here differ: Odin keeps PFC and single paths, DCP adds packet trimming in switches, Falcon uses a few congestion-aware flows.本第 7 章的其他傳輸層導讀選擇不同:Odin 保留 PFC 與單路徑,DCP 在交換器加入封包修剪,Falcon 用少數幾條感知壅塞的流。
Key numbers關鍵數字
| Number | 數字 | Meaning (setup) | 意義(設定) |
|---|---|---|---|
| 128 · 1 · 250 µs | Paths per connection, shared contexts, RTO (deployed) | 每條連線的路徑數、共用 context、RTO(已部署) | |
| 15× / 30× | Faster container start-up, abstract and §1 / §4 (production) | 容器啟動加速,摘要與 §1 / §4(生產) | |
| −90% | Switch queue length (production, no baseline) | 交換器佇列長度(生產,無基準) | |
| 0.72% · 6% · 14% | Training gain vs ConnectX-7: reranked mean, random mean, random max (1,024 GPUs) | 相對 ConnectX-7 的訓練增益:reranking 平均、隨機平均、隨機最大(1,024 顆 GPU) | |
| 50 GB/s | Full RNIC bandwidth, 512-GPU AllReduce, 128 paths (testbed) | RNIC 滿頻寬,512 顆 GPU 的 AllReduce,128 條路徑(測試) | |
| 1% / 3% | One link's drop rate with almost no slowdown (960 GPUs) | 幾乎不造成減速的單一鏈路丟包率(960 顆 GPU) |
Terms used on this page本頁用到的術語
- SR-IOV VF / BDF
- A PCIe slice of a device with its own bus-device-function address.
- 裝置的一個 PCIe 切片,有自己的 bus-device-function 位址。
- ATC / MTT / eMTT
- The device's small translation cache / the RNIC's translation table / Stellar's MTT that also holds the final address and memory owner.
- 裝置端的小型轉換快取 / RNIC 的轉換表 / 同時存放最終位址與記憶體擁有者的 Stellar MTT。
- PVDMA
- Para-virtualized DMA: pins guest memory on first use, in 2 MiB blocks.
- 半虛擬化 DMA:第一次使用時才以 2 MiB 區塊釘住 guest 記憶體。
- Oblivious packet spraying (OBS)
- Sending each packet on a pseudo-randomly chosen path, with no per-path state.
- 以偽隨機方式為每個封包選路徑,不保留逐路徑狀態。
- Congestion control context (CCC)
- Per-connection congestion state; in Stellar, one window shared by 128 paths.
- 每條連線的壅塞狀態;在 Stellar 中是 128 條路徑共用的一個窗口。