Astral: A Datacenter Infrastructure for Large Language Model Training at ScaleAstral:大規模大型語言模型訓練的資料中心基礎設施
After reading, you can explain how Tencent's Astral builds a non-oversubscribed 128-port fat tree by grouping tier 2 by rail, why MoE justified the cost, and how it finds failures in minutes.讀完後,你能說明騰訊的 Astral 如何依 rail 分組第二層、建出不超額認購的 128 埠 fat tree,為何 MoE 讓這個代價值得付,以及它如何在數分鐘內找到故障。
Tencent's Astral has carried LLM training and inference since July 2023 and now connects 128K GPUs in two Pods. It keeps HPN's 1,024-GPU tier 1, groups tier 2 by rail so that one Pod holds 64K GPUs, and oversubscribes no tier: the full non-blocking fat tree of 128-port switches, 524,288 GPUs. The paper pays for 1:1 because a 16:1 top tier cut all-to-all, the collective of MoE models, by up to 52% (training by up to 3%). In production, Hunyuan-MoE lost only 0.6% against linear scaling at 8K GPUs, and a full-stack monitor located failures up to 25× faster. Astral contradicts Chapter 13's rule that an oversubscribed top tier is unavoidable beyond about 15K GPUs.
騰訊的 Astral 自 2023 年 7 月起承載 LLM 訓練與推論,目前以兩個 Pod 連接 128K 顆 GPU。它沿用 HPN 1,024 顆 GPU 的第一層,把第二層依 rail 分組,讓一個 Pod 容納 64K 顆 GPU,而且沒有任何一層超額認購:也就是 128 埠交換器組成的完整非阻塞 fat tree,524,288 顆 GPU。論文願意為 1:1 付費,是因為 16:1 的頂層讓 all-to-all(MoE 模型的集體操作)最多損失 52%(訓練最多 3%)。在生產環境中,Hunyuan-MoE 在 8K 顆 GPU 時相對線性擴展只損失 0.6%,全堆疊監控讓故障定位最多快 25 倍。第 13 章有一條規則:超過約 15K 顆 GPU 後,超額認購的頂層無法避免。Astral 與這條規則相矛盾。
1. Where this paper sits1. 這篇論文的位置
The Chapter 13 shows four production designs that all save money at the top: Meta runs 1:7 between 3,072-GPU pods, HPN 15:1 above its 15K-GPU pod. Step 1 of its decision procedure therefore says from 15K to about 24K GPUs an oversubscribed top tier is unavoidable. The Chapter 6 (section 1) computes the limit of a non-blocking three-tier fat tree of 128-port switches, GPUs, and its section 3 records that HPN priced a rail-only tier 2 at more than 120K GPUs per pod and rejected it.
第 13 章列出的四種生產設計都在頂層省錢:Meta 在 3,072 顆 GPU 的 pod 之間用 1:7,HPN 在 15K 顆 GPU 的 pod 之上用 15:1。所以它決策程序的第 1 步說:15K 到約 24K 顆 GPU 時,超額認購的頂層無法避免。第 6 章(第 1 節)算出 128 埠交換器的非阻塞三層 fat tree 上限是 顆 GPU,它的第 3 節則記錄 HPN 算過 rail-only 第二層每個 pod 可超過 120K 顆,卻否決了它。
Astral builds exactly that fat tree. Its tier 2 is the rail-aggregated option HPN rejected, but a full-bandwidth Core keeps the cross-rail reachability that rail-only gives up. That is a fifth pattern beside Chapter 13's four: a rail-aggregated tier 2 under a non-oversubscribed Core. With 128K GPUs at 1:1 in production, by the paper's account, it contradicts step 1: past 15K, a thin top tier is the cheap choice, not the only one.
Astral 正是把這個 fat tree 建了出來。它的第二層採用 HPN 否決的依 rail 聚合,但全頻寬的 Core 保住了 rail-only 放棄的跨 rail 可達性。這是第 13 章四種模式之外的第五種:依 rail 聚合的第二層,加上不超額認購的 Core。依論文所述,它在生產環境以 1:1 運行 128K 顆 GPU,因此與第 1 步相矛盾:超過 15K 後,單薄的頂層是便宜的選擇,而不是唯一的選擇。
2. The problem, measured2. 問題,用量測說話
GPUs available in China have lower FLOPS, so Tencent wanted one network for at least half a million of them, rented as bare servers, often more than 10K GPUs per customer. Two measurements shaped it (Figure 1).
在中國能取得的 GPU FLOPS 較低,所以騰訊要一個能連接至少五十萬顆這種 GPU 的網路,以裸機伺服器出租,每位客戶常超過 10K 顆。兩項量測決定了它的形狀(圖 1)。
Placement. A 1K-GPU all-to-all spread over 32 Pods ran 19%–37% slower than inside one Pod: paths are longer, ECMP hash polarization is more frequent, and queues passed the ECN threshold. In production most traffic leaving a host stays on one rail, because NCCL's PXN first moves data over NVLink to the GPU on the destination's rail.
配置。1K 顆 GPU 的 all-to-all 分散在 32 個 Pod 時,比在單一 Pod 內慢 19%–37%:路徑較長、ECMP hash polarization 較頻繁,佇列也超過 ECN 門檻。在生產環境中,離開主機的流量多半留在同一條 rail,因為 NCCL 的 PXN 會先經 NVLink 把資料搬到目的地那條 rail 上的 GPU。
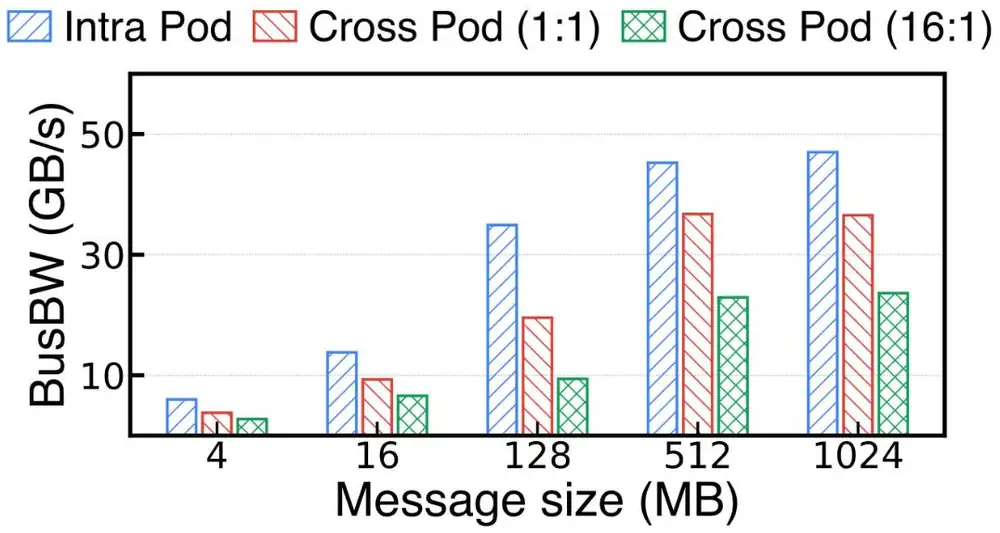
Oversubscription. A tier 3 (Agg to Core) at 16:1 cut all-to-all bandwidth by up to 52% but training by only up to 3%, because about 15% of communication time remained after overlap with computation. Dense models send mostly DP and PP traffic between same-rail switches and tolerate a thin top tier; MoE expert-parallel all-to-all crosses rails and Pods and does not. Astral treats MoE as first-class, so it buys identical bandwidth at all three tiers.
超額認購。16:1 的第三層(Agg 到 Core)讓 all-to-all 頻寬最多損失 52%,訓練卻最多只損失 3%,因為與計算重疊之後只剩約 15% 的通訊時間外露。稠密模型主要在同 rail 交換器之間傳送 DP 與 PP 流量,能忍受單薄的頂層;MoE 的專家平行 all-to-all 會跨 rail 也跨 Pod,則不能。Astral 把 MoE 當成一級工作負載,所以在三層都買足相同的頻寬。
Figure 2 of the paper (below) is the source of both all-to-all numbers: 1K GPUs, 4 MB to 1 GB messages, and a 16:1 Core for the 52%. Where the test ran, and the model and scale behind the 3% and 15%, are not stated. The paper also lists ByteDance among providers that oversubscribe tier 3; the MegaScale reading has 32 ports down and 32 up at every switch, and we follow the reading.
論文的 Figure 2(下圖)是兩個 all-to-all 數字的出處:1K 顆 GPU、4 MB 到 1 GB 的訊息,52% 則是 Core 為 16:1 的情況。測試在哪裡進行,以及 3% 與 15% 背後的模型與規模,都沒有說明。論文還把字節跳動列為在第三層超額認購的業者;MegaScale 導讀描述的是每台交換器 32 埠朝下、32 埠朝上,我們以導讀為準。
Failures. In a production taxonomy (Figure 7 of the paper), 66% of anomalies are fail-stop, 17% fail-hang and 13% fail-slow. The last two leave no error logs, and many causes end in the same NCCL timeout.
故障。在一份生產環境的分類中(論文 Figure 7),66% 的異常是 fail-stop、17% 是 fail-hang、13% 是 fail-slow。後兩者不留錯誤日誌,而且許多原因最後都是同一個 NCCL 逾時。
3. The design3. 設計
3.1 Tier 1 and tier 2: aggregate by rail3.1 第一層與第二層:依 rail 聚合
Each host has 8 GPUs and 8 NICs of 2 × 200 Gb/s, one NIC per rail, and a NIC's two ports go to two ToRs (principle P3), so a failed optical module costs one port, not the host. A block (tier 1) is 16 ToRs of 51.2 Tb/s (8 rails × 2) under 128 hosts: 1,024 GPUs. Each ToR has 64 × 2 × 200G down and 64 × 400G up, 1:1. This is HPN's segment almost unchanged.
每台主機有 8 顆 GPU 與 8 張 2 × 200 Gb/s 的 NIC,每條 rail 一張;NIC 的兩個埠接到兩台 ToR(原則 P3),所以一個光模組故障只損失一個埠,而不是整台主機。一個 block(第一層)是 16 台 51.2 Tb/s 的 ToR(8 條 rail × 2),其下 128 台主機:1,024 顆 GPU。每台 ToR 下行 64 × 2 × 200G、上行 64 × 400G,為 1:1。這幾乎就是原封不動的 HPN segment。
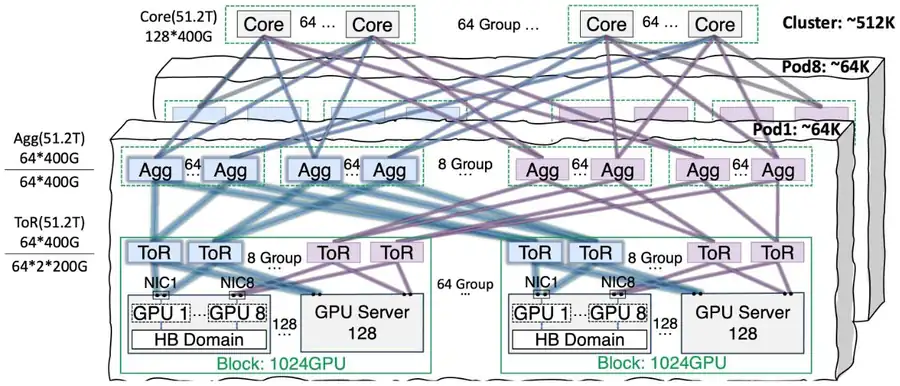
Tier 2 is where Astral departs (principle P1). The two rail- ToRs of a block go to two separate groups of 64 Agg switches, as in HPN's dual-plane, but each group serves rail only. An Agg is 128 × 400G, 64 down and 64 up, so its downlinks reach the rail- ToRs of 64 blocks; an HPN Agg spreads them over all 8 rails and reaches 8 blocks (Figure 2):
第二層是 Astral 走上不同路的地方(原則 P1)。一個 block 中 rail 的兩台 ToR 分別接到兩組各 64 台的 Agg 交換器,與 HPN 的 dual-plane 相同,但每組只服務 rail 。Agg 是 128 × 400G,下行 64、上行 64,所以它的下行連到 64 個 block 的 rail ToR;HPN 的 Agg 把下行分給全部 8 條 rail,只連到 8 個 block(圖 2):
| Question問題 | Calculation算式 | Result結果 |
|---|---|---|
| GPUs per block: 8 rails, 128 hosts每個 block 的 GPU:8 條 rail、128 台主機 | ||
| GPUs per rail in a Pod: 64 blocks一個 Pod 內每條 rail 的 GPU:64 個 block | ||
| GPUs per Pod每個 Pod 的 GPU | ||
| Agg switches per Pod: 8 rails × 2 groups每個 Pod 的 Agg 交換器:8 條 rail × 2 組 | ||
| HPN-style pod at the same 1:1 Agg: 8 segments相同 1:1 Agg 的 HPN 式 pod:8 個 segment | HPN's Table 2, before 15:1HPN Table 2 在 15:1 之前 |
The Pod grows 8×, the factor that rail wiring gave tier 1. The price: tier 2 no longer joins rails, so cross-rail traffic must climb to the Core unless PXN makes it same-rail first.
Pod 變大 8 倍,正是 rail 接線讓第一層變大的倍數。代價是第二層不再把 rail 接起來,所以跨 rail 流量必須爬到 Core,除非 PXN 先把它變成同 rail 流量。
3.2 Tier 3 at 1:1: the whole 128-port fat tree3.2 1:1 的第三層:完整的 128 埠 fat tree
All Aggs of rank , across all groups, connect to one set of 64 Cores (principle P2); a Core is 128 × 400G, not oversubscribed. The paper gives these counts and a figure of 8 Pods, about 512K GPUs. The rest is our arithmetic: one Core port per (rail, plane) group and 16 groups per Pod mean that a Core joins 8 Pods:
所有群組中序號 的 Agg 都接到同一組 64 台 Core(原則 P2);Core 是 128 × 400G,不超額認購。論文給出這些數量,以及一張 8 個 Pod、約 512K 顆 GPU 的圖。其餘是我們的算術:每個(rail、plane)群組一個 Core 埠、每個 Pod 16 個群組,表示一台 Core 連起 8 個 Pod:
| Question問題 | Calculation算式 | Result結果 |
|---|---|---|
| Pods one Core can join一台 Core 能連起的 Pod | ||
| GPUs in the cluster叢集的 GPU | ||
| The fat-tree limit for radix 128基數 128 的 fat tree 上限 | the same number同一個數字 | |
| Core switches: 64 sets of 64Core 交換器:64 組、每組 64 台 | ||
| ToRs (512 blocks) and Aggs (8 Pods)ToR(512 個 block)與 Agg(8 個 Pod) | each各 | |
| All switches; fat-tree rule 全部交換器;fat tree 規則 |
So Astral is the -ary fat tree with , relabeled: each of its 128 fat-tree pods (64 ToRs, 64 Aggs) is one rail and plane of one Astral Pod, not a row of racks. Paths (Figure 3): same rail and block, 1 switch; same rail, other block, 3; other rail without PXN, 5, even inside one block; other Pod, 5. In HPN, cross-rail traffic inside a pod needs 3.
所以 Astral 就是 的 -ary fat tree,只是換了標籤:它的 128 個 fat-tree pod(各 64 台 ToR、64 台 Agg)各是一個 Astral Pod 中的一條 rail 與一個 plane,而不是一排機櫃。路徑(圖 3):同 rail 同 block,1 台交換器;同 rail、另一個 block,3 台;另一條 rail 且不用 PXN,5 台,即使在同一個 block 內;另一個 Pod,5 台。在 HPN 中,pod 內跨 rail 只需 3 台。
Chapter 13's step 1 therefore describes price, not possibility: at full build, 1:1 needs 20,480 switches and two inter-switch links per GPU, against about 1.07 with 15:1 above tier 2 in our model. The panel computes both.
因此第 13 章的第 1 步描述的是價格,而不是可能性:全部建滿時,1:1 需要 20,480 台交換器、每顆 GPU 兩條交換器間鏈路;在我們的模型中,第二層之上改為 15:1 時約 1.07 條。面板把兩者都算出來。
3.3 Balancing traffic and locating failures3.3 平衡流量與定位故障
Astral keeps per-flow ECMP rather than spraying or adaptive routing (Appendix A): diagnosis needs fixed paths, its NVIDIA NICs handle out-of-order data poorly, and a failed link hits only its own flows. Its optimized ECMP (a footnote in §2.1) picks each flow's UDP source port at the host so that a pair's flows spread evenly over the equal paths, using the linearity of commodity switch hash functions. If switch ECN counters, read every five seconds, still show congestion, a central controller runs a hash simulator and reassigns ports for the next round of collectives. In a production trace (the paper's Figure 17), ECN marks fell about tenfold after a few hundred reassignments. Transport stays RDMA with DCQCN and PFC.
Astral 保留逐流 ECMP,不用封包噴灑或自適應路由(附錄 A):診斷需要固定路徑,它的 NVIDIA NIC 不善處理亂序資料,而且鏈路故障只影響走那條路的流。它的最佳化 ECMP(§2.1 的一個註腳)在主機端為每條流挑 UDP 來源埠,讓一對端點之間的流平均分散在等價路徑上,這利用了商用交換器雜湊函數的線性。如果每五秒讀取一次的交換器 ECN 計數仍顯示壅塞,中央控制器就執行雜湊模擬器,為下一輪集體通訊重新指派來源埠。在一段生產紀錄中(論文 Figure 17),經過數百次重新指派後,ECN 標記約降為十分之一。傳輸層仍是 RDMA 加 DCQCN 與 PFC。
The monitor reads four layers: NCCL operator hooks; errCQE events and millisecond per-QP rates from mirrored first packets; sFlow paths and INT per-hop delays; host, NIC and switch counters. Identifiers chain them (communicator, QP, five-tuple, path, device). Each host's per-iteration times are compared with Seer's forecast for the job and with its peers, not with fixed thresholds, so a hang without logs still stands out (Figure 4). The mirroring costs 0.8 Mb/s per node (Appendix C).
監控系統讀取四個層級:NCCL 運算子 hook;errCQE 事件,以及從鏡像首封包算出的毫秒級每 QP 速率;sFlow 路徑與 INT 逐跳延遲;主機、NIC 與交換器計數。識別碼把它們串起來(communicator、QP、五元組、路徑、裝置)。每台主機每次迭代的時間拿來和 Seer 對該任務的預測以及同儕比較,而不是和固定門檻比較,所以沒有日誌的 hang 仍會凸顯出來(圖 4)。鏡像只花每個節點 0.8 Mb/s(附錄 C)。
3.4 Seer, power and cooling3.4 Seer、電力與冷卻
Seer plays one profiled iteration's operator graph in a discrete-event simulator in seconds. Instead of with theoretical bandwidth, it uses , a polynomial fitted to measured throughput; the basic model has no latency term (Appendix E), so the calibration does most of the work. Its what-if studies are simulations, so we quote none of their numbers. Power and cooling use hybrid HVDC per rack row and cold plates.
Seer 用離散事件模擬器,在數秒內跑完一次 profile 過的迭代的運算子圖。它不用以理論頻寬計算的 ,而用 :以實測吞吐擬合的多項式;基本模型沒有延遲項(附錄 E),所以大部分工作由校準完成。它的假設情境研究是模擬,所以我們不引用其中任何數字。電力與冷卻採用每排機櫃的混合式 HVDC 與冷板。
4. Implementation4. 實作
The paper reports a deployment, not a prototype: no lines of code, no switch vendor (Appendix A names NVIDIA NICs), and 128K GPUs in two Pods since July 2023. Two incidents shaped the monitor: an 8K-GPU job hung with clean logs and took several dozen engineers 26 hours to trace to a faulty driver, and a PCIe fault on one machine caused a PFC storm that cut cluster efficiency to about 50%.
論文報告的是一套部署而非原型:沒有程式碼行數,也沒有交換器廠商(附錄 A 點名了 NVIDIA 的 NIC),自 2023 年 7 月起成長到兩個 Pod、128K 顆 GPU。兩次事故塑造了監控系統:一個 8K 顆 GPU 的任務在日誌乾淨的情況下 hang 住,數十位工程師花了 26 小時才追到有問題的驅動程式;一台機器的 PCIe 故障引發 PFC 風暴,讓叢集效率降到約 50%。
5. What was measured5. 量到了什麼
All results come from Tencent's production or from unstated environments; nothing compares topologies under control.
所有結果都來自騰訊的生產環境或未說明的環境;沒有任何實驗在受控條件下比較拓樸。
| Test測試 | Setup設定 | Measured實測結果 |
|---|---|---|
| Scaling擴展 | Hunyuan-MoE training, production, 256 to 8K GPUs生產環境 Hunyuan-MoE 訓練,256 到 8K 顆 GPU | Throughput 4×, 2×, 2×, 1.99× per step: the paper's 0.6% loss at 8K每一步吞吐 4、2、2、1.99 倍:即論文所說 8K 時損失 0.6% |
| Placement配置 | 1K-GPU all-to-all, one Pod vs 32, 4 MB–1 GB; environment not stated1K 顆 GPU 的 all-to-all,1 個 Pod 對 32 個,4 MB–1 GB;未說明環境 | 19%–37% lower when spread分散時低 19%–37% |
| Top tier頂層 | Tier 3 at 16:1 vs 1:1, 1K GPUs over 32 Pods; training case without model or scale第三層 16:1 對 1:1,1K 顆 GPU 分散到 32 個 Pod;訓練的情況沒有模型或規模 | All-to-all up to 52% and training up to 3% worse; ~15% of communication exposedall-to-all 最多差 52%、訓練最多差 3%;約 15% 通訊外露 |
| Locating failures定位故障 | Production, one year after deployment生產環境,部署一年後 | Up to 12× (fail-stop) and 25× (fail-hang) faster, to minutes; fail-slow nearly 5×, still hours最多快 12 倍(fail-stop)與 25 倍(fail-hang),降到數分鐘;fail-slow 近 5 倍,仍需數小時 |
| Across data centers跨資料中心 | PP traffic between sites hundreds of km apart (App. B); setup not stated相距數百公里的站點之間的 PP 流量(附錄 B);未說明設定 | No loss at 8:1 oversubscription; 4.6% at 32:18:1 超額認購時無損失;32:1 時 4.6% |
| SeerSeer | Forecast vs one measured Hunyuan iteration; run time, 1K GPUs預測對一次實測的 Hunyuan 迭代;1K 顆 GPU 的執行時間 | 0.3% deviation; seconds, vs hours (SimAI) or a day (ASTRA-sim)偏差 0.3%;數秒,對比數小時(SimAI)或一天(ASTRA-sim) |
| Plant設施 | Production生產環境 | Average PUE up to 16.34% lower平均 PUE 最多低 16.34% |
The 0.6% is a loss against linear scaling, not an MFU, so it does not compare with MegaScale's 55.2% MFU; the time-to-locate factors come without absolute times.
0.6% 是相對線性擴展的損失,不是 MFU,所以不能和 MegaScale 的 55.2% MFU 相比;定位時間的倍數也沒有附上絕對時間。
6. Limits and open questions6. 限制與未解的問題
The paper's own limits: correlation misses framework or strategy problems, and Seer is less accurate for MoE models such as DeepSeek R1. Appendix D adds a case the automation missed: a security scanner probing NCCL's port. A careful reader adds:
論文自己的限制:關聯分析抓不到框架或策略層級的問題,Seer 對 DeepSeek R1 這類 MoE 模型也較不準。附錄 D 補上一個自動化沒抓到的例子:資安掃描器探測 NCCL 的埠。細心的讀者還應補上:
- Evidence. The network measurements state no environment, and nothing isolates the topology.證據。網路量測都沒有說明環境,也沒有任何結果隔離出拓樸的效果。
- Cost and span. 1:1 is not priced against 15:1 or 1:7. At full build, 8 kW per 8-GPU server gives about 0.5 GW, far beyond HPN's 18 MW building (Section 6.10). Appendix B joins data centers hundreds of km apart over rented fiber, with no latency or protocol details.成本與跨距。論文沒有把 1:1 與 15:1 或 1:7 的價格相比。全部建滿時,以每台 8 GPU 伺服器 8 kW 計算約 0.5 GW,遠超過 HPN 18 MW 的一棟建築(第 6.10 節)。附錄 B 以租用光纖連接相距數百公里的資料中心,但沒有延遲或協定細節。
- Cross-rail latency. Without PXN, cross-rail traffic crosses 5 switches even inside a block, and a bare-metal tenant may not own the GPUs that PXN relays through (HPN's objection to rail-only). Astral answers with bandwidth; MoE all-to-all latency is not measured.跨 rail 延遲。不用 PXN 時,跨 rail 流量即使在 block 內也要經過 5 台交換器,而裸機租戶未必擁有 PXN 要借道的 GPU(HPN 反對 rail-only 的理由)。Astral 用頻寬回應;MoE all-to-all 的延遲沒有量測。
- ECMP details. The paper never explains how a new source port applies "in the next round" without reordering; Appendix A gives only the reasons for ECMP (Section 8.6).ECMP 細節。論文始終沒有說明新的來源埠如何「在下一輪」生效而不亂序;附錄 A 只給出採用 ECMP 的理由(第 8.6 節)。
- Comparisons. Besides MegaScale's top tier (section 2), the paper's figure for Meta's cluster scale also differs from the site's readings; we follow the readings. Only one Seer what-if, PP traffic across data centers, was checked by measurement, and it roughly agreed.比較。除了 MegaScale 的頂層(第 2 節),論文對 Meta 叢集規模的數字也與本站導讀不同;我們以導讀為準。Seer 的假設情境只有一個(跨資料中心的 PP 流量)經過量測驗證,結果大致相符。
7. How it connects7. 與其他內容的關聯
- Chapter 13, sections 1, 2 and 7: a fifth column (1,024 / 64K / 512K; 1:1 everywhere; 51.2T single chips; dual-ToR; source-port ECMP; DCQCN with PFC; NCCL with PXN). It breaks step 1 and agrees with step 3 that MoE and shared hosts need cross-rail reachability, which it puts in the Core.第 13 章第 1、2、7 節:第五欄(1,024 / 64K / 512K;每層 1:1;51.2T 單晶片;dual-ToR;以來源埠操控的 ECMP;DCQCN 加 PFC;NCCL 加 PXN)。它打破第 1 步,並同意第 3 步「MoE 與共享主機需要跨 rail 可達性」,只是把這份可達性放在 Core。
- Chapter 6, sections 1 and 3: the fat tree built, and a fourth wiring pattern. Chapter 8, section 6: a third way to control entropy, beside Meta's QP scaling and HPN's RePaC.第 6 章第 1 與第 3 節:真的建出來的 fat tree,以及第四種接線。第 8.6 節:Meta 的 QP scaling 與 HPN 的 RePaC 之外,第三種控制熵的方法。
- Chapter 10, section 1: a second production taxonomy, of a fleet's anomalies rather than one job's interruptions. Chapter 11, section 4: Seer sits between the – model and SimAI.第 10.1 節:第二份生產故障分類,計算的是機群的異常,而不是單一任務的中斷。第 12.2 節:Seer 介於 – 模型與 SimAI 之間。
- Guided readings: Alibaba HPN (tier 1 kept, Table 4 option taken), Meta RoCE (thin top tier, placement), MegaScale (cross-host comparison), rail-only (same tier 2, spine kept). The chapter's next digest, Pegasus (SIGCOMM 2026, same operator), covers Tencent's multi-tenant bare-metal cloud, where load balancing and congestion control move into the NIC.論文導讀:Alibaba HPN(保留第一層、採用 Table 4 的選項)、Meta RoCE(以配置讓單薄頂層變安全)、MegaScale(跨主機比較)、rail-only(相同的第二層,但保留 spine)。本章的下一篇導讀 Pegasus(SIGCOMM 2026,同一個營運者)處理騰訊的多租戶裸機雲,在那裡負載平衡與壅塞控制搬進了 NIC。
Key numbers關鍵數字
| Number | 數字 | Meaning (setup) | 意義(設定) |
|---|---|---|---|
| 1,024 / 65,536 / 524,288 | GPUs per block / Pod / full design (design) | 每個 block / Pod / 完整設計的 GPU(設計) | |
| 128K in 2 Pods | Deployed since July 2023 (production) | 自 2023 年 7 月起的部署(生產) | |
| 19%–37% | All-to-all loss, 1K GPUs over 32 Pods vs one Pod (environment not stated) | 1K 顆 GPU 分散到 32 個 Pod 相對 1 個的 all-to-all 損失(未說明環境) | |
| 52% / 3% / ~15% | All-to-all / training loss from tier-3 oversubscription / exposed communication time (52%: 16:1, 1K GPUs; 3%: no setup) | 第三層超額認購造成的 all-to-all / 訓練損失 / 外露的通訊時間(52%:16:1、1K 顆 GPU;3%:無設定) | |
| 0.6% | Loss against linear scaling at 8K GPUs, Hunyuan-MoE (production) | 8K 顆 GPU 相對線性擴展的損失,Hunyuan-MoE(生產) | |
| 12× / 25× / ~5× | Faster location of fail-stop / fail-hang / fail-slow (production; fail-slow still hours) | fail-stop / fail-hang / fail-slow 定位加速倍數(生產;fail-slow 仍需數小時) |
Terms used on this page本頁用到的術語
- Pod (Astral)
- 64 blocks whose same-rail ToRs share rail-specific Agg groups; 65,536 GPUs, 8,192 per rail.
- 64 個 block,同 rail 的 ToR 共用該 rail 專屬的 Agg 群組;65,536 顆 GPU,每條 rail 8,192 顆。
- Rail aggregation
- Wiring tier 2 so that each Agg group connects the ToRs of one rail and one plane only.
- 讓每組 Agg 只連接同一條 rail、同一個 plane 的 ToR 的第二層接線。
- Fail-hang / fail-slow
- A job that stops progressing without ending / that runs slower than it should; neither leaves an error log.
- 任務停止前進但沒有結束 / 跑得比應有的慢;兩者都不留錯誤日誌。