Characterization of Large Language Model Development in the Datacenter資料中心內大型語言模型開發的特性分析
After reading, you can explain what six months of traces from a 4,704-GPU LLM datacenter say about its network: which jobs it serves, why its NICs look idle, and what failures cost.讀完後,你能說明一座 4,704 顆 GPU 的 LLM 資料中心六個月的紀錄對其網路透露了什麼:它服務哪些任務、為什麼 NIC 看起來閒著,以及故障的代價。
Shanghai AI Laboratory traced six months of LLM development on 4,704 production A100 GPUs: about 1.09 million jobs. Three findings matter for the network. Count is not cost: in the Kalos cluster, evaluation is 92.9% of jobs but 0.8% of GPU time, and pretraining is 3.2% of jobs but 94.0%. The InfiniBand NICs look idle (over 60% of the time, rarely above 25% of line rate), but 15-second averages hide line-rate bursts, so this does not prove spare bandwidth. Infrastructure failures are 11% of failed jobs but over 82% of their GPU time: they strike the largest jobs midway. The authors built asynchronous checkpoints (3.6–58.7× less stall), automatic diagnosis that finds faulty nodes, and an evaluation scheduler (up to 1.8× shorter makespan).
上海人工智慧實驗室記錄了 4,704 顆生產環境 A100 GPU 上六個月的 LLM 開發:約 109 萬個任務。有三項發現對網路很重要。數量不等於成本:在 Kalos 叢集,評估占任務數的 92.9%、GPU 時間卻只占 0.8%,預訓練占任務數的 3.2%、GPU 時間卻占 94.0%。InfiniBand NIC 看起來閒著(超過 60% 的時間閒置,很少超過線速的 25%),但 15 秒的平均值會藏住線速突發,所以這不能證明頻寬有剩。基礎設施故障只占失敗任務的 11%,卻占它們 GPU 時間的 82% 以上:它們在最大的任務執行到一半時發生。作者建了非同步檢查點(停頓少 3.6–58.7 倍)、能找出故障節點的自動診斷,以及評估排程器(完成時間最多縮短 1.8 倍)。
1. Where this paper sits1. 這篇論文的位置
The Chapter 1 argues from single jobs. Its section 4 shows that communication takes a growing share of each step as the cluster grows. Section 6 predicts that all NICs of a job burst at line rate at the same moment, then go quiet. The evidence is Llama 3, MegaScale and Alibaba HPN: one large run each.
第 1 章是從單一任務出發來論證的。它的第 4 節說明叢集越大,通訊占每一步的比例越高。第 6 節預測一個任務的所有 NIC 會在同一時刻以線速突發,然後一起安靜下來。證據是 Llama 3、MegaScale 與 Alibaba HPN:各描述一次大型訓練。
Missing was the view of a whole datacenter. Which of its jobs decide how the network is built? How busy is the network over months? What stops jobs, and at what cost? Earlier public traces (Philly, Helios, PAI) describe older deep-learning workloads, at 0.7–3.7 GPUs per job on average. Acme publishes the trace of a datacenter that runs only LLM development, at 6.3.
缺少的是整座資料中心的視角。它的任務中,哪些決定網路該怎麼建?幾個月下來網路有多忙?什麼讓任務停下,代價多大?更早的公開紀錄(Philly、Helios、PAI)描述的是較早的深度學習工作負載,平均每個任務只要 0.7–3.7 顆 GPU。Acme 公開了一座只做 LLM 開發的資料中心的紀錄,平均 6.3 顆。
2. The problem, measured2. 問題,用量測說話
The study covers the two LLM clusters of Acme, the lab's private datacenter (§2.2, Table 1). Each node has 8 A100-SXM 80 GB GPUs on NVLink and NVSwitch, and 200 Gb/s HDR InfiniBand to other nodes. The bandwidth per GPU, the input of Panel 5.4, follows from Table 1:
研究涵蓋該實驗室私有資料中心 Acme 的兩個 LLM 叢集(§2.2,Table 1)。每個節點有 8 顆以 NVLink 與 NVSwitch 相連的 A100-SXM 80 GB GPU,節點之間以 200 Gb/s HDR InfiniBand 相連。每顆 GPU 的頻寬,也就是面板 5.4 的輸入,可以從 Table 1 算出:
| Question問題 | Calculation算式 | Result結果 |
|---|---|---|
| Seren: one 200 Gb/s HCA per node (286 nodes, 2,288 GPUs)Seren:每節點一張 200 Gb/s HCA(286 個節點、2,288 顆 GPU) | Gb/sper GPU, one port for all traffic每顆 GPU,所有流量走同一個埠 | |
| Kalos: four 200 Gb/s application HCAs per node, plus one for storage (302 nodes, 2,416 GPUs)Kalos:每節點四張 200 Gb/s 應用程式 HCA,另加一張給儲存(302 個節點、2,416 顆 GPU) | Gb/sper GPU每顆 GPU | |
| Chapter 1's 400 Gb/s per GPU, against Seren and Kalos第 1 章的每顆 GPU 400 Gb/s,對照 Seren 與 Kalos | more bandwidth per GPU in Chapter 1第 1 章每顆 GPU 的頻寬多出的倍數 |
So a Seren GPU has one sixteenth of Chapter 1's bandwidth. Kalos keeps storage off its application HCAs: the front-end split of deep-dive section 6, done per NIC. The traces join scheduler records with Prometheus, DCGM and IPMI monitoring, sampled every 15 seconds. Section 3.1 depends on that interval.
所以 Seren 的一顆 GPU 只有第 1 章頻寬的十六分之一。Kalos 讓儲存流量不走應用程式 HCA:這就是第 5.6 節的前端分離,只是做在每張 NIC 上。這些紀錄把排程器資料與 Prometheus、DCGM、IPMI 的監控資料結合,每 15 秒取樣一次。第 3.1 節的論證取決於這個間隔。
Most jobs are small: the median GPU job runs 2 minutes, and under 7% request more than 8 GPUs. But GPU time, a job's GPUs multiplied by its duration, sits in a few large jobs (Figure 1). In Kalos, jobs with 256 or more GPUs use over 96% of it.
多數任務很小:GPU 任務的中位數執行時間是 2 分鐘,要求超過 8 顆 GPU 的不到 7%。但 GPU 時間(任務的 GPU 數乘以執行時間)集中在少數大型任務上(圖 1)。在 Kalos,256 顆 GPU 以上的任務用掉其中超過 96%。
This split sizes a training network. Evaluation jobs usually need fewer than 4 GPUs, stay in one node, and wait on storage and CPUs (section 3.3). Pretraining jobs span tens to hundreds of nodes and synchronize every step, as in Chapter 1's barrier and burst arguments. Queueing inverts too. Evaluations wait longest, because capacity is reserved for pretraining and evaluations arrive in low-priority batches.
這個分布決定訓練網路的規模。評估任務通常只要不到 4 顆 GPU、留在一個節點內,等的是儲存與 CPU(第 3.3 節)。預訓練任務橫跨數十到數百個節點、每一步都要同步,正是第 1 章柵欄與突發論證的情境。排隊順序也反轉了。評估等最久,因為容量保留給預訓練,而評估以低優先權成批送來。
3. What the traces show3. 紀錄顯示了什麼
3.1 Busy GPUs and quiet NICs, in 15-second averages3.1 以 15 秒平均來看:GPU 很忙、NIC 很閒
The median DCGM "GPU utilization" is 97% in Seren and 99% in Kalos (Philly 48%, PAI 4%). It only says that some kernel ran. SM activity, the share of busy streaming multiprocessors, has a median of about 40%.
DCGM「GPU 使用率」的中位數在 Seren 是 97%、在 Kalos 是 99%(Philly 48%、PAI 4%)。它只表示有某個 kernel 在執行。SM 活動率(忙碌的串流多處理器所占比例)的中位數約為 40%。
The network looks quieter still. In Figure 7d of the paper (below), Seren's InfiniBand NICs are idle over 60% of the time, and active bandwidth rarely exceeds 25% of the maximum.
網路看起來更閒。在論文 Figure 7d(下圖)中,Seren 的 InfiniBand NIC 超過 60% 的時間閒置,活動時的頻寬很少超過最大值的 25%。
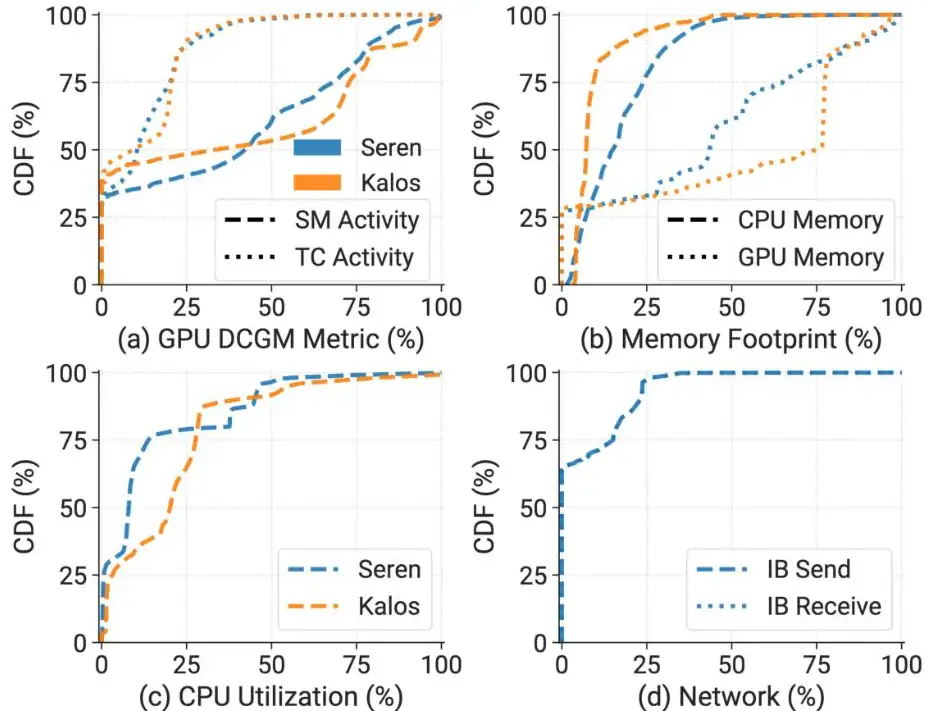
Read this with deep-dive section 6 in mind. A synchronous job holds its NIC at line rate while it exchanges data, and idle while it computes. A 15-second sample spans many such cycles. A NIC that bursts to 200 Gb/s for a quarter of each step reads 25%, and so does a NIC at a steady 50 Gb/s. A sample reads idle only if almost nothing crossed the NIC for 15 seconds: no multi-node job on the node, or a job that is stalled.
讀這些數字時要想著第 5.6 節。同步任務在交換資料時讓 NIC 維持線速,在計算時讓它閒著。一個 15 秒的樣本涵蓋許多這樣的週期。每步有四分之一時間衝到 200 Gb/s 的 NIC 讀到 25%,穩定送 50 Gb/s 的 NIC 也讀到 25%。只有當 15 秒內幾乎沒有資料經過 NIC,樣本才讀到閒置:節點上沒有多節點任務,或任務停住了。
So the averages show neither spare capacity nor congestion: bursts, flow-control pauses and path collisions last microseconds to milliseconds and vanish at this resolution. Sizing a fabric by such averages is the error Chapter 1 warns about. Try both shapes in the panel.
所以這些平均值既不表示容量有剩,也不表示沒有壅塞:突發、流量控制造成的暫停與路徑碰撞只持續微秒到毫秒,在這個解析度下完全消失。用這種平均值決定網路規模,正是第 1 章所警告的錯誤。在面板中試試兩種形狀。
3.2 Failures: rare by count, dominant by cost3.2 故障:次數少,代價大
Section 5 classifies failed jobs from their logs (32,500 Kalos tasks, 675 Seren pretraining tasks). About 40% of all jobs fail. Infrastructure failures come from the compute platform or remote storage and strike midway through a job. Framework failures appear early and are fixed by configuration; script failures are programming errors. Figure 2 weights each reason by GPU time.
第 5 節依日誌把失敗的任務分類(Kalos 的 32,500 個任務、Seren 的 675 個預訓練任務)。所有任務中約 40% 會失敗。基礎設施故障來自運算平台或遠端儲存,發生在任務執行到一半時。框架故障出現在早期,改設定就能修好;腳本故障則是程式錯誤。圖 2 以 GPU 時間為每個原因加權。
In the paper's words, infrastructure failures are 11% of failed jobs but over 82% of their GPU time. They hit the big jobs: NVLink errors struck jobs of 800 GPUs on average, after about 868 minutes. Few failures carry a network label (12 network errors, 6 NCCL timeouts, 3 NCCL remote errors). But network errors recovered slowest: a mean restart of 592 minutes (median 7.4), longer than the 550 minutes the jobs had run. Many connection and network errors come from auxiliary services, such as logging, that suffer from network instability.
用論文的話說,基礎設施故障只占失敗任務的 11%,卻占它們 GPU 時間的 82% 以上。它們打中的是大任務:NVLink 錯誤打中的任務平均有 800 顆 GPU、已執行約 868 分鐘。帶網路標籤的故障很少(12 次網路錯誤、6 次 NCCL 逾時、3 次 NCCL 遠端錯誤)。但網路錯誤恢復得最慢:平均重啟 592 分鐘(中位數 7.4),比任務先前執行的 550 分鐘還長。許多連線錯誤與網路錯誤來自日誌等輔助服務,這些服務受網路不穩定所苦。
Two more lessons. Heat: 7B training on Kalos overheated GPUs in July 2023, the machine room warmed by about 5 °C, and NVLink and ECC errors followed until the cooling improved. And recovery was manual: developers restarted pretraining jobs on call, also at night.
還有兩個教訓。高溫:2023 年 7 月 Kalos 上的 7B 訓練讓 GPU 過熱,機房溫度上升約 5 °C,NVLink 與 ECC 錯誤隨之而來,直到冷卻改善為止。而且恢復是手動的:開發者輪流值班重啟預訓練任務,夜裡也一樣。
3.3 Evaluation jobs wait on storage and CPUs3.3 評估任務在等儲存與 CPU
Figure 13 of the paper profiles a 7B evaluation on HumanEval. Loading and preprocessing take over a minute (29.5%) before the GPU works. At the end, the GPU idles for 42 seconds (19.0%) while CPUs test the generated programs. Loading is a front-end problem: about 60 datasets are evaluated at once, and each trial loads the model from remote storage. On Seren, loading slowed sharply from 1 to 8 single-GPU trials per node, because the storage NIC is limited to 25 Gb/s (Figure 16): about 3 Gb/s per trial.
論文 Figure 13 剖析了 7B 模型在 HumanEval 上的一次評估。在 GPU 開始工作之前,載入與前處理就花了超過一分鐘(29.5%)。最後 42 秒(19.0%)GPU 閒置,由 CPU 測試生成的程式。載入是前端的問題:約 60 個資料集同時評估,每個試驗都從遠端儲存載入模型。在 Seren 上,每節點的單 GPU 試驗從 1 個增加到 8 個時,載入明顯變慢,因為儲存 NIC 只有 25 Gb/s(Figure 16):每個試驗約 3 Gb/s。
4. The design: two systems built on the findings4. 設計:根據發現所建的兩個系統
4.1 Fault-tolerant pretraining4.1 容錯的預訓練
Asynchronous checkpointing copies the model state to host memory, which holds several checkpoints. A separate thread then writes it to remote storage while training continues. In the Young–Daly terms of the Chapter 10 (section 3), this shrinks the stall , so checkpoints can be frequent. The measurements use a 30-minute interval.
非同步檢查點把模型狀態複製到主機記憶體(容得下好幾個檢查點),再由另一個執行緒在訓練繼續時寫到遠端儲存。用第 10.3 節的 Young–Daly 說法,這縮小了停頓 ,所以檢查點可以更頻繁。量測使用 30 分鐘的間隔。
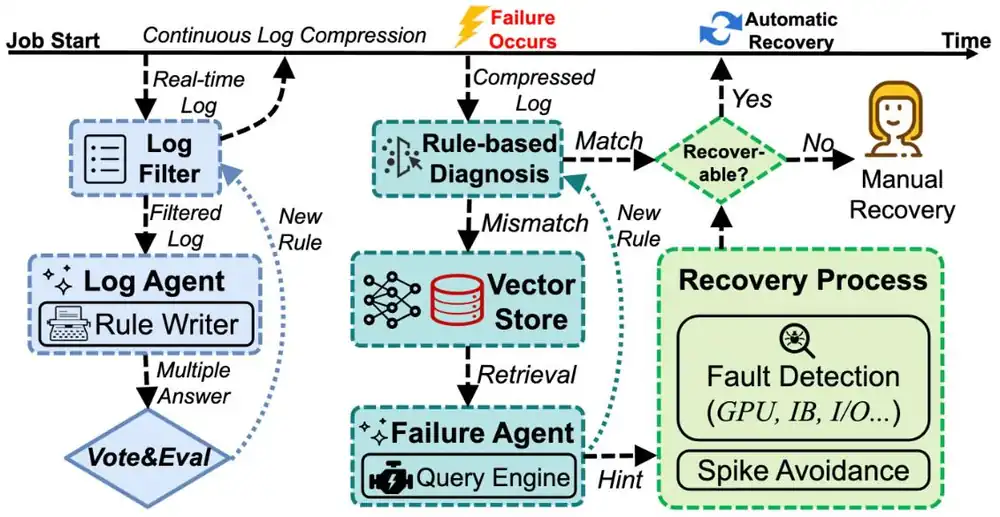
Diagnosis (Figure 15 of the paper, below) compresses logs while the job runs, and an LLM "Log Agent" writes filter rules for new patterns. After a failure, errors are matched against rules from past failures. An unmatched error goes to a "Failure Agent", which searches past cases by retrieval-augmented generation (RAG) and reports the error type, user or infrastructure fault, and a recovery hint. In one example, an NCCL timeout, a CUDA error and a RuntimeError appear together; the root cause is the CUDA error.
診斷(論文 Figure 15,見下圖)在任務執行時持續壓縮日誌,由一個 LLM「Log Agent」為新的模式寫過濾規則。故障發生後,錯誤先與過去故障的規則比對。比對不到的錯誤交給「Failure Agent」,它以檢索增強生成(RAG)搜尋過去的案例,回報錯誤類型、屬於使用者還是基礎設施的問題,以及恢復建議。在一個例子中,NCCL 逾時、CUDA 錯誤與 RuntimeError 同時出現;根本原因是 CUDA 錯誤。
For NVLink errors, a two-round all-gather test finds the faulty node (Figure 4). Round 1 splits the nodes into two-node worlds, with one of three if the count is odd, and runs an NCCL all-gather in each. Both nodes of a failed world become suspects. Round 2 pairs each suspect with a node that passed, and a pair that fails again names the faulty node, which is cordoned. After a loss spike, a sudden rise in a falling loss, the job rolls back to an earlier healthy checkpoint and skips the next data batches.
遇到 NVLink 錯誤時,兩輪 all-gather 測試會找出故障節點(圖 4)。第 1 輪把節點分成兩個一組的 world(節點數為奇數時留一組三個),並在每組內執行 NCCL all-gather。失敗那一組的兩個節點都成為嫌疑。第 2 輪把每個嫌疑節點與一個通過的節點配對,再次失敗的那一對就指出故障節點,將它隔離(cordon)。發生損失尖峰(原本下降的損失突然上升)後,任務回滾到更早的健康檢查點,並跳過接下來的資料批次。
Two rounds suffice at any job size. The test finds nodes that fail. A node that is only slow, a straggler in deep-dive section 5, would pass it.
不論任務多大,兩輪就夠了。這個測試找的是會失敗的節點。只是變慢的節點,也就是第 1.4 節的 straggler,會通過測試。
4.2 Decoupled evaluation scheduling4.2 解耦的評估排程
A trial coordinator splits each evaluation into three kinds of jobs (Figure 3). A precursor job loads the model once per node into shared memory. GPU trials read it over PCIe, write their outputs to small files and exit. CPU jobs then compute the metrics. Runtime priors per dataset decide how datasets are packed into trials.
試驗協調器把每次評估拆成三種任務(圖 3)。前置任務在每個節點只載入一次模型,放進共享記憶體。GPU 試驗經 PCIe 讀取它,把輸出寫成小檔案後結束。接著由 CPU 任務計算指標。各資料集的執行時間先驗決定資料集如何打包成試驗。
5. Implementation5. 實作
Both systems are deployed in Acme, inside the lab's InternEvo training framework and the Slurm and Kubernetes schedulers. Diagnosis uses GPT-4 with a vector store and a RAG query engine. The paper gives no lines of code. The traces are public as AcmeTrace.
兩個系統都已部署在 Acme,建在該實驗室的 InternEvo 訓練框架以及 Slurm 與 Kubernetes 排程器之中。診斷使用 GPT-4,搭配向量資料庫與 RAG 查詢引擎。論文沒有給出程式碼行數。紀錄以 AcmeTrace 之名公開。
6. What was measured6. 量到了什麼
Sections 2 and 3 are production measurements. The system results are fewer and less controlled:
第 2 與第 3 節都是生產環境的量測。系統的結果較少,控制也較不嚴謹:
| Test測試 | Setup設定 | Measured實測結果 |
|---|---|---|
| Asynchronous checkpoint非同步檢查點 | 7B and 123B; 30-minute interval; against synchronous saving7B 與 123B;30 分鐘間隔;對照同步儲存 | 3.6–58.7× less overhead; the storage write is excluded開銷少 3.6–58.7 倍;不含寫入儲存的時間 |
| Diagnosis診斷 | Production pretraining生產環境預訓練 | About 90% less manual intervention; "not a rigorous assessment"手動介入減少約 90%;作者稱「並非嚴謹的評估」 |
| Evaluation coordinator評估協調器 | 7B model, 63 datasets; against one trial per dataset7B 模型、63 個資料集;對照每個資料集一個試驗 | Makespan 1.3× (1 node) and 1.8× (4 nodes) shorter完成時間縮短 1.3 倍(1 個節點)與 1.8 倍(4 個節點) |
| Hierarchical ZeRO vs 3D parallelism階層式 ZeRO 對 3D 平行 | 123B, 2,048 GPUs; , vs 64-GPU sharding groups123B、2,048 顆 GPU;、 對 64 顆 GPU 的分片群組 | About 16% faster約快 16% |
The last row is a network result. Hierarchical ZeRO keeps parameter sharding inside groups of 64 GPUs (eight nodes), so its all-gathers stay in the group. 3D parallelism loses to pipeline bubbles and communication on the critical path. Appendix A.6 shows the limit: an MoE model on 1,024 Seren GPUs had much lower GPU utilization, which the authors blame on all-to-all traffic through one InfiniBand NIC per server. When the bytes per GPU cannot shrink (deep-dive section 4), a thin network shows.
最後一列其實是網路的結果。階層式 ZeRO 把參數分片限制在 64 顆 GPU(八個節點)一組之內,所以它的 all-gather 留在組內。3D 平行則輸在關鍵路徑上的管線氣泡與通訊。附錄 A.6 顯示了極限:一個 MoE 模型在 1,024 顆 Seren GPU 上的 GPU 使用率低得多,作者歸因於 all-to-all 流量只能經過每台伺服器的單一張 InfiniBand NIC。當每顆 GPU 的位元組無法縮小時(第 5.4 節),細瘦的網路就會露出來。
7. Limits and open questions7. 限制與未解的問題
The paper names its limits (§7): no serving jobs, GPU jobs only, dense decoder-only models (MoE only in an appendix), and a rough 90%. The authors are upgrading the infrastructure "with a particular focus on NIC". A careful reader adds:
論文列出自己的限制(§7):不含推論服務任務、只有 GPU 任務、只有稠密的 decoder-only 模型(MoE 只在附錄出現),以及粗略的 90%。作者正在升級基礎設施,「特別著重於 NIC」。細心的讀者還會補上:
- Resolution. The network data are 15-second averages from Seren only: no bursts, pauses or collisions, and nothing from Kalos's application HCAs.解析度。網路資料只有 Seren 的 15 秒平均:沒有突發、暫停或碰撞,也沒有 Kalos 應用程式 HCA 的資料。
- A thin network. At 25–100 Gb/s per GPU, the results show software adapting to scarce bandwidth. No faster network was tested.細瘦的網路。在每顆 GPU 25–100 Gb/s 下,結果呈現的是軟體如何適應稀少的頻寬。沒有測試更快的網路。
- Stall, not durability. The 3.6–58.7× excludes the storage write. A checkpoint that is only in host memory is lost with its node.停頓,不是持久化。3.6–58.7 倍不含寫入儲存的時間。只在主機記憶體中的檢查點,會隨其節點一起遺失。
- Fabric or host? A label such as NetworkError or NCCL timeout does not say whether a link, a NIC or a host failed.是網路還是主機?NetworkError 或 NCCL 逾時這類標籤,並不說明故障的是鏈路、NIC 還是主機。
8. How it connects8. 與其他內容的關聯
- Chapter 1, sections 4 and 6: the job mix says whom the back end serves. Figure 7d is the duty-cycle argument seen through a 15-second window, and Panel 6 there shows the burst itself.第 1 章第 4 與第 6 節:任務組成說明後端網路服務誰。Figure 7d 是透過 15 秒視窗看到的工作週期論證,那裡的面板 6 則呈現突發本身。
- Alibaba HPN Figure 2 shows the burst-then-idle trace that Acme's averages flatten.Alibaba HPN Figure 2 呈現「突發後閒置」的軌跡,正是 Acme 的平均值所抹平的。
- Chapter 10, sections 1 and 4: Table 3 is a second public failure table beside Llama 3's, weighted by GPU time. The two-round test is a simpler relative of MegaScale's diagnostics.第 10 章第 1 與第 4 節:Table 3 是 Llama 3 之外第二份公開的故障表,並以 GPU 時間加權。兩輪測試是 MegaScale 診斷測試較簡單的近親。
- Chapter 9, sections 1 and 3: Kalos's storage HCA is the front-end split, and evaluation adds read bursts to the checkpoint write bursts.第 9 章第 1 與第 3 節:Kalos 的儲存 HCA 就是前端分離,而評估在檢查點的寫入突發之外又加上讀取突發。
- Next in this chapter: Hermod schedules the synchronized flows of training jobs as coflows.本章下一篇:Hermod 把訓練任務的同步流量當作 coflow 來排程。
Key numbers關鍵數字
| Number | 數字 | Meaning (production unless noted) | 意義(除非註明,皆為生產環境) |
|---|---|---|---|
| 4,704 · 1.09M | A100 GPUs in Seren and Kalos · jobs traced, March–August 2023 | Seren 與 Kalos 的 A100 GPU 數 · 2023 年 3–8 月記錄的任務數 | |
| 92.9% / 0.8% | Kalos evaluation share of jobs / of GPU time | Kalos 評估任務占任務數 / GPU 時間的比例 | |
| 3.2% / 94.0% | Kalos pretraining share of jobs / of GPU time | Kalos 預訓練占任務數 / GPU 時間的比例 | |
| > 60% / 25% | Seren IB NICs: time idle / share of line rate that active bandwidth rarely exceeds (15-second samples) | Seren IB NIC:閒置時間 / 活動頻寬很少超過的線速比例(15 秒取樣) | |
| 11% / > 82% | Infrastructure failures: share of failed jobs / of their GPU time | 基礎設施故障:占失敗任務數 / 其 GPU 時間的比例 | |
| 3.6–58.7× | Less checkpoint stall, asynchronous vs synchronous | 非同步對同步,檢查點停頓減少的倍數 | |
| 1.3× / 1.8× | Shorter evaluation makespan, 1 / 4 nodes (measured run time) | 評估完成時間縮短,1 / 4 個節點(實測執行時間) |
Terms used on this page本頁用到的術語
- GPU utilization / SM activityGPU 使用率 / SM 活動率
- The share of time in which any kernel runs / the share of streaming multiprocessors that are busy.
- 有任何 kernel 在執行的時間比例 / 忙碌的串流多處理器所占比例。
- Infrastructure failure基礎設施故障
- A fault of the compute platform or remote storage, such as an NVLink, ECC or network error.
- 運算平台或遠端儲存的故障,例如 NVLink、ECC 或網路錯誤。
- Asynchronous checkpointing非同步檢查點
- Copying model state to host memory and writing it to storage in the background.
- 把模型狀態複製到主機記憶體,再於背景寫入儲存。
- Two-round all-gather test兩輪 all-gather 測試
- All-gathers in node pairs, then each suspect paired with a node that passed.
- 先在節點對中執行 all-gather,再把每個嫌疑節點與通過的節點配對。
- Hierarchical ZeRO階層式 ZeRO
- ZeRO sharding limited to subgroups of GPUs, 64 here.
- 把 ZeRO 分片限制在 GPU 子群組內,這裡是 64 顆。