DistDPU: A Disaggregated DPU Architecture for High-Performance and Cost-Efficient AI CloudsDistDPU:為高效能、具成本效益的 AI 雲端設計的解耦式 DPU 架構
After reading, you can explain why one DPU per 400G NIC wastes control silicon in an AI cloud, how DistDPU runs nine NICs from one shared control module, and what that costs.讀完後,你能說明在 AI 雲端裡每張 400G NIC 配一顆 DPU 為何浪費控制晶片、DistDPU 如何用一個共用的控制模組管理九張 NIC,以及這樣做的代價。
Tencent's AI cloud must give each GPU server 400 Gb/s to 3.2 Tb/s of RDMA with VPC isolation, also for bare-metal tenants who have root. One DPU per NIC buys nine Arm SoCs per server, yet in production the control cores of an AI server stay about 14% busy. DistDPU splits the DPU. One Orchestration Module (OM) on the front-end NIC runs all control software; a lean Execution Module (EM) on each 2×200G NIC runs the fast path. A private PCIe channel that the tenant cannot reach joins them: up to 3.6 Tb/s of provisioned capacity under one policy anchor. On a two-node H20 testbed, per-NIC RDMA throughput was within 0.4–2.8% of nine BlueField-3s or ConnectX-7s. In the paper's normalized analysis, nine BlueField-3s cost 4.91× and draw 2.77× the power per node.
騰訊的 AI 雲端必須給每台 GPU 伺服器 400 Gb/s 到 3.2 Tb/s 的 RDMA 與 VPC 隔離,擁有 root 的裸機租戶也不例外。每張 NIC 配一顆 DPU,等於每台伺服器買九顆 Arm SoC,但在正式環境中,AI 伺服器的控制核心只有約 14% 在忙。DistDPU 把 DPU 拆開。前端 NIC 上的一個編排模組(Orchestration Module,OM)執行全部控制軟體;每張 2×200G NIC 上一個精簡的執行模組(Execution Module,EM)執行快速路徑。兩者由一條租戶碰不到的私有 PCIe 通道相連:在單一政策錨點下提供最多 3.6 Tb/s 的配置容量。在兩節點的 H20 測試平台上,單張 NIC 的 RDMA 吞吐量與九顆 BlueField-3 或 ConnectX-7 相差 0.4–2.8%。依論文的正規化分析,九顆 BlueField-3 每個節點的成本是 4.91 倍、功耗是 2.77 倍。
1. Where this paper sits1. 這篇論文的位置
In Section 9.1, an HPN host has NIC 0 for the front end and NICs 1–8 for the back end. Section 6 (above Panel 6) says NIC 0 is a BlueField-3 DPU, a NIC with its own Arm cores that can enforce tenant policy outside the tenant's OS, and that HPN does not quantify this. Two questions stay open: what a DPU's control plane costs at 3.2 Tb/s per server, and who enforces policy on the eight back-end NICs. DistDPU answers both from production. Checkpoint, storage and management traffic stay on the front-end NIC, but that NIC becomes the control anchor of all nine.
在第 9.1 節,HPN 主機的 NIC 0 給前端、NIC 1–8 給後端。第 6 節(在面板 6 上方)說 NIC 0 是一顆 BlueField-3 DPU,一張有自己 Arm 核心、能在租戶作業系統之外執行租戶政策的 NIC,並說 HPN 沒有量化這一點。還有兩個問題沒有答案:每台伺服器 3.2 Tb/s 時 DPU 的控制平面要花多少,以及誰在八張後端 NIC 上執行政策。DistDPU 用正式環境的資料回答這兩題。檢查點、儲存與管理流量留在前端 NIC,但這張 NIC 成為全部九張的控制錨點。
Words used below. A VPC gives a tenant its own address space: tenant addresses are VIPs, physical ones PIPs. On bare metal the tenant has root on the whole server, so no host software can be trusted to enforce policy.
下文用到的詞。VPC(虛擬私有雲)給租戶一個自己的位址空間:租戶位址是 VIP,實體位址是 PIP。在裸機(bare metal)上,租戶擁有整台伺服器的 root,所以主機上沒有任何軟體能被信任來執行政策。
2. The problem, measured2. 問題,用量測說話
Requirements (§2.2). R1: per-server bandwidth from 400 Gb/s to 3.2 Tb/s. R2: bare-metal, VM and container tenants under one VPC, with the idle CPUs of GPU servers rented to general-compute tenants. R3: network CapEx near 10% of an Ethernet cluster, a share the paper cites from the Meta RoCE paper.
需求(§2.2)。R1:每台伺服器的頻寬從 400 Gb/s 到 3.2 Tb/s。R2:裸機、VM 與容器租戶共用同一種 VPC,GPU 伺服器閒置的 CPU 租給一般運算租戶。R3:網路 CapEx 約占 Ethernet 叢集的 10%,這個比例是論文引自 Meta RoCE 論文。
Why the usual answers fail (§2.3, §7). A fast-path offload NIC leaves the control plane and slow path on the host, so on bare metal a tenant with root owns the enforcement point. Stacked monolithic DPUs keep an enforcement point in every card, but they repeat an SoC, memory, OS and failure domain for every 400 Gb/s. One DPU plus eight commodity RDMA NICs costs less than nine DPUs, but the commodity NICs have no trusted channel to the DPU. Their control falls back to host drivers, and the policy anchor splits. Figure A compares the three layouts.
常見的做法為何不行(§2.3、§7)。快速路徑卸載 NIC 把控制平面與慢速路徑留在主機上,所以在裸機上,擁有 root 的租戶掌握了執行點。堆疊單體式 DPU 讓每張卡都有執行點,卻每 400 Gb/s 就重複一套 SoC、記憶體、作業系統與故障域。一顆 DPU 加八張商用 RDMA NIC 比九顆 DPU 便宜,但商用 NIC 與 DPU 之間沒有可信通道。它們的控制退回主機驅動程式,政策錨點因此分裂。圖 A 比較這三種配置。
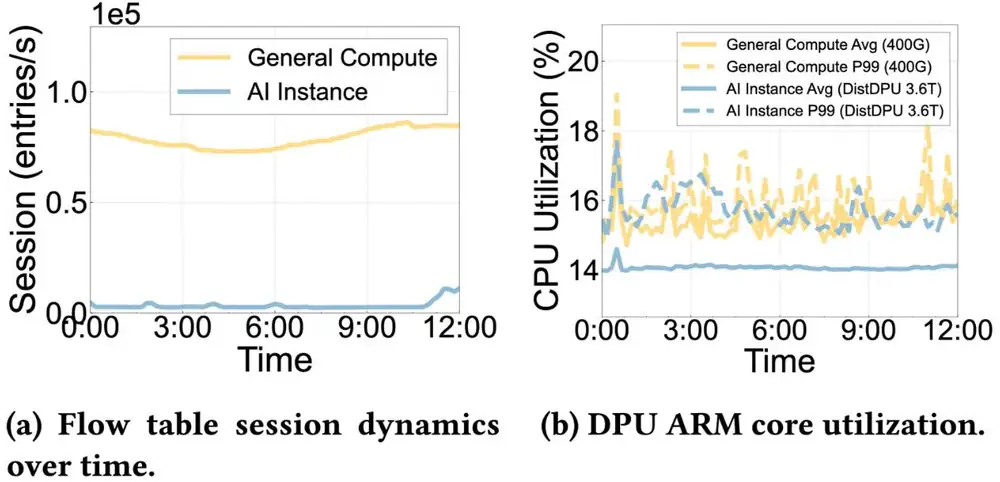
The divergence, measured. In 12 hours of production telemetry (the paper's Figure 2), AI instances, with a few long-lived elephant flows, create an order of magnitude fewer flow-table sessions than general-compute instances. One DistDPU serving 3.6 Tb/s keeps its Arm cores about 14% busy, no busier than a DPU serving a 400 Gb/s general node. The paper calls this the control–data plane divergence: bandwidth grows each GPU generation; control work does not.
量到的分歧。在正式環境 12 小時的遙測中(論文 Figure 2),只跑少數長壽大象流的 AI 執行個體,建立的流表 session 比一般運算執行個體少一個數量級。一顆服務 3.6 Tb/s 的 DistDPU,Arm 核心約 14% 在忙,不比服務 400 Gb/s 一般節點的 DPU 更忙。論文稱之為控制與資料平面的分歧:頻寬每一代都成長,控制工作卻不會。
3. The design3. 設計
3.1 Split by what must grow with bandwidth3.1 依「必須隨頻寬成長」來切分
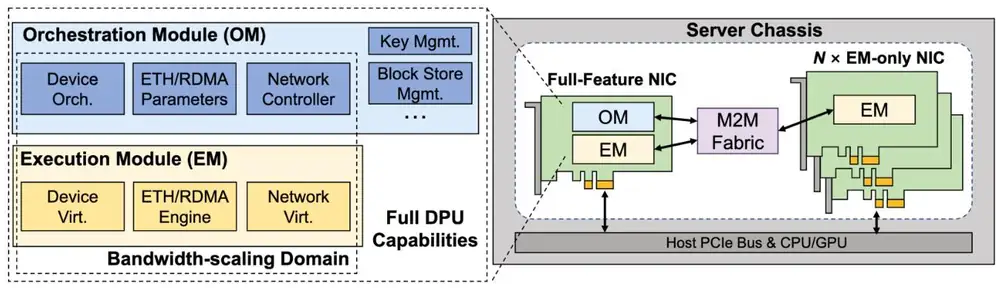
The partition rule has two steps (§3.1). First, keep only the domains that must grow with bandwidth: those on the per-packet path, and those that must exist per port to show devices to the host. Second, inside each such domain, the OM decides and the EM executes only what line rate needs. Everything else stays in the OM.
切分規則有兩步(§3.1)。第一,只挑出必須隨頻寬成長的領域:在逐封包路徑上的,以及必須每個埠各有一份才能向主機呈現裝置的。第二,在每個這樣的領域裡,由 OM 決策,EM 只執行線速所需的部分。其餘一切留在 OM。
| Domain | 領域 | Each EM executes | 每個 EM 執行 | The OM decides | OM 決定 |
|---|---|---|---|---|---|
| Device virtualization | 裝置虛擬化 | PCIe configuration and BARs, up to 16K VFs | PCIe 組態與 BAR,最多 16K 個 VF | PF/VF layout and quotas | PF/VF 配置與配額 |
| ETH/RDMA engine | ETH/RDMA 引擎 | Spraying, transport, the CC reaction loop | 封包噴灑、傳輸、壅塞控制反應迴圈 | CC algorithm and parameters | 壅塞控制演算法與參數 |
| Network virtualization | 網路虛擬化 | Lookups, encap or rewrite, QoS, ACLs | 查表、封裝或改寫、QoS、ACL | Slow path, policy compilation | 慢速路徑、政策編譯 |
| Does not grow | 不隨頻寬成長 | Nothing | 無 | Storage, keys, cloud agents | 儲存、金鑰、雲端代理程式 |
Physical form (§3.2, §5.1). The full-feature NIC carries the OM (16 Arm cores at 2.4 GHz, 64 GB of DDR5) and a local EM. An EM-only NIC has only an EM with 2×200G ports. A server has one full-feature NIC and EM-only NICs (0, 4 or 8), so its bandwidth is Gb/s: 3.6 Tb/s of provisioned capacity at most. The cloud sees one logical DPU; the host sees standard PCIe devices. Appendix C, which is not peer-reviewed, adds a 1.5 Tb/s UCIe link between the OM and EM dies.
實體形式(§3.2、§5.1)。全功能 NIC 載著 OM(16 個 2.4 GHz Arm 核心、64 GB DDR5)與一個本地 EM。EM-only NIC 只有一個帶 2×200G 埠的 EM。一台伺服器有一張全功能 NIC 與 張 EM-only NIC(0、4 或 8),所以頻寬是 Gb/s:最多 3.6 Tb/s 的配置容量。雲端看到一顆邏輯 DPU;主機看到標準的 PCIe 裝置。附錄 C(未經同儕審查)補充 OM 與 EM 晶粒之間有一條 1.5 Tb/s 的 UCIe 連結。
Inside the EM (§4.1). SmartEP runs PCIe configuration in software on a small EM core and sends doorbells and data straight to hardware, so one image presents up to 16K VFs. The RDMA engine sprays packets by UDP source port, places out-of-order packets by offset and retransmits selectively; DCQCN is the default. DOT translates GPU addresses for GPUDirect RDMA in VMs with a few base-plus-offset intervals.
EM 內部(§4.1)。SmartEP 在 EM 內一顆小核心上以軟體處理 PCIe 組態,doorbell 與資料直接進硬體,所以一套映像就能呈現最多 16K 個 VF。RDMA 引擎依 UDP 來源埠噴灑封包、依偏移放置亂序封包,並做選擇性重傳;預設是 DCQCN。DOT 為 VM 內的 GPUDirect RDMA 用幾段「基底加偏移」的區間轉換 GPU 位址。
3.2 The data path: overlay or NAT3.2 資料路徑:overlay 或 NAT
Every packet crosses one EM pipeline: parse, classify and apply policy, encapsulate or translate, forward (§4.1.3). The OM compiles policy into table entries and installs them over the management channel. Overlay mode serves general-compute nodes and shared NICs: the EM wraps the packet in VXLAN. NAT mode serves tenants that own their GPUs and NICs: the EM rewrites the VIP to the PIP on egress and back on ingress, with no tunnel header (Figure B). Only the OM can read or write the NAT table.
每個封包都穿過同一條 EM 管線:解析、分類並套用政策、封裝或轉換、轉送(§4.1.3)。OM 把政策編譯成表項,經管理通道安裝下去。Overlay 模式服務一般運算節點與共用的 NIC:EM 把封包包進 VXLAN。NAT 模式服務獨占 GPU 與 NIC 的租戶:EM 在送出時把 VIP 改寫成 PIP,收到時再改回,沒有隧道標頭(圖 B)。只有 OM 能讀寫 NAT 表。
When rules are installed (§4.2). The VIP-to-PIP map is installed when an instance is created; runtime rules are installed on demand. In overlay mode, where RDMA and TCP share one NIC and IP, RDMA connection setup runs over TCP, so the first TCP flow-table miss tells the OM to pre-install the RDMA entries before the first RDMA data packet. RDMA entries are pinned in on-chip SRAM; the larger, faster-changing general-compute entries go to DRAM.
規則何時安裝(§4.2)。VIP 到 PIP 的對應在建立執行個體時安裝;執行期的規則按需安裝。在 overlay 模式下,若 RDMA 與 TCP 共用同一張 NIC 與 IP,RDMA 的連線建立走 TCP,所以第一次 TCP 流表未命中就通知 OM,在第一個 RDMA 資料封包之前預先裝好 RDMA 表項。RDMA 表項釘在晶片上的 SRAM;較大、變動較快的一般運算表項放到 DRAM。
3.3 The policy anchor: the M2M fabric3.3 政策錨點:M2M fabric
The OM reaches every EM over the M2M fabric (module to module; §4.3, Appendix B). Messages are typed objects (device profiles, CC policies, tables, telemetry). Each push carries a rising epoch, and an EM accepts only the latest, so a late message cannot overwrite a newer one. The OM is wired only to its local EM, which relays messages over PCIe to the other EMs. Access checks keep host software off the M2M endpoints: even with root, the host OS sees only standard PCIe devices, while the tables that enforce its VPC sit behind a channel it cannot reach.
OM 經 M2M fabric(模組對模組;§4.3、附錄 B)連到每一個 EM。訊息是有型別的物件(裝置設定檔、壅塞控制政策、表項、遙測)。每次推送都帶著遞增的 epoch,EM 只接受最新的,所以晚到的訊息蓋不掉較新的。OM 只直接接到本地 EM,由它經 PCIe 把訊息中繼給其他 EM。存取檢查讓主機軟體碰不到 M2M 端點:主機作業系統即使有 root,也只看到標準 PCIe 裝置,而執行它的 VPC 的表放在一條它碰不到的通道後面。
Rail-aware subnetting (Appendix A, not peer-reviewed). All NICs on one rail share one IP subnet. A subnet match then tells intra-rail from cross-rail traffic in constant time, picks the local NIC in the destination's subnet as the PXN relay, and lets the kernel route by longest-prefix match. Section 6.3 explains rails.
依 rail 切分子網(附錄 A,未經同儕審查)。同一條 rail 上的所有 NIC 共用一個 IP 子網。比對子網就能在常數時間內分辨 rail 內與跨 rail 的流量,挑出與目的地同子網的本地 NIC 當 PXN 中繼,並讓核心用最長前綴比對來路由。第 6.3 節說明了 rail。
3.4 What sharing costs: one extra hop, one shared fate3.4 共用的代價:多一跳,同一命運
The extra hop. Data packets take none: a GPU's traffic goes from the host to its EM and onto the wire. A control message to an EM-only NIC takes one relay hop through the local EM. The paper measures 2.2 µs for a 4-byte write and 4.9 µs for a read over PCIe (§5.4), with no separate relay figure. Only events that need the OM pay it, and pre-installed entries keep it off the training path.
多出來的一跳。資料封包不多跳:GPU 的流量從主機到它的 EM 再上線路。送往 EM-only NIC 的控制訊息要經本地 EM 中繼,多一跳。論文量到經 PCIe 寫入 4 位元組要 2.2 µs、讀取要 4.9 µs(§5.4),沒有單獨給中繼的數字。只有需要 OM 的事件付這個代價,而預先裝好的表項讓它不落在訓練路徑上。
The shared fate. One OM controls up to 3.6 Tb/s, so its failure domain is the control plane of the whole server (§6). A watchdog restarts a crashed OM process at millisecond scale, because management state lives in memory apart from the control logic. Meanwhile the EMs keep forwarding and running their congestion-control loops; only new OM decisions wait. EM failures, mostly optics, ran at 0.10–0.73% per month over the last year; per-EM dual-port failover handles them, and the OM can isolate one faulty EM (Figure C).
共同的命運。一個 OM 控制最多 3.6 Tb/s,所以它的故障域是整台伺服器的控制平面(§6)。因為管理狀態放在記憶體中、與控制邏輯分開,watchdog 能在毫秒級重啟崩潰的 OM 行程。這段期間 EM 照常轉送、跑壅塞控制迴圈;只有需要 OM 新決策的工作要等。過去一年 EM 故障(多為光學元件)每月 0.10–0.73%;由每個 EM 的雙埠容錯切換處理,OM 也能隔離單一故障的 EM(圖 C)。
4. Implementation4. 實作
The first generation used FPGA EMs; the deployed one is an ASIC with separate execution and orchestration dies (§3.2). The paper gives no lines of code. Two lessons came from operation (§6): support grew from early SRD-style unordered semantics to verbs-compatible RC, and idle host CPUs on GPU servers would cost about 20% of revenue (operator estimate), so co-location is the norm. A pilot ran in May 2023 and production began in March 2024. The fleet has more than 1,000 servers each at and at (about 10,000 GPUs), and about 100 at .
第一代用 FPGA 做 EM;部署中的這一代是 ASIC,執行晶粒與編排晶粒分開(§3.2)。論文沒有給程式碼行數。營運帶來兩個教訓(§6):支援範圍從早期 SRD 式的無序語意擴充到相容 verbs 的 RC;GPU 伺服器閒置的主機 CPU 會損失約 20% 營收(業者估計),所以混合部署是常態。2023 年 5 月試行,2024 年 3 月上線正式環境。機隊在 與 各有超過 1,000 台伺服器(後者約 10,000 顆 GPU), 約 100 台。
5. What was measured5. 量到了什麼
Setup (§5.1). Two nodes, each with eight NVIDIA H20 GPUs and a 96-core AMD EPYC 9K84. DistDPU uses one full-feature NIC for management, checkpoint and storage plus eight EM-only NICs, with virtualization on. Multi-BF3 (nine BlueField-3s) and Multi-CX7 (nine ConnectX-7s) give one NIC to checkpoint and storage and run with virtualization off.
設定(§5.1)。兩個節點,每個有八顆 NVIDIA H20 GPU 與一顆 96 核 AMD EPYC 9K84。DistDPU 用一張全功能 NIC 承載管理、檢查點與儲存,加上八張 EM-only NIC,虛擬化開啟。Multi-BF3(九顆 BlueField-3)與 Multi-CX7(九張 ConnectX-7)各用一張 NIC 承載檢查點與儲存,虛擬化關閉。
| Result | 結果 | Setup | 設定 | Number | 數字 |
|---|---|---|---|---|---|
| OM CPU, 24 hours | OM 的 CPU,24 小時 | Production, 3.6 Tb/s servers (Fig. 7) | 正式環境,3.6 Tb/s 伺服器(Fig. 7) | Average below 15% | 平均低於 15% |
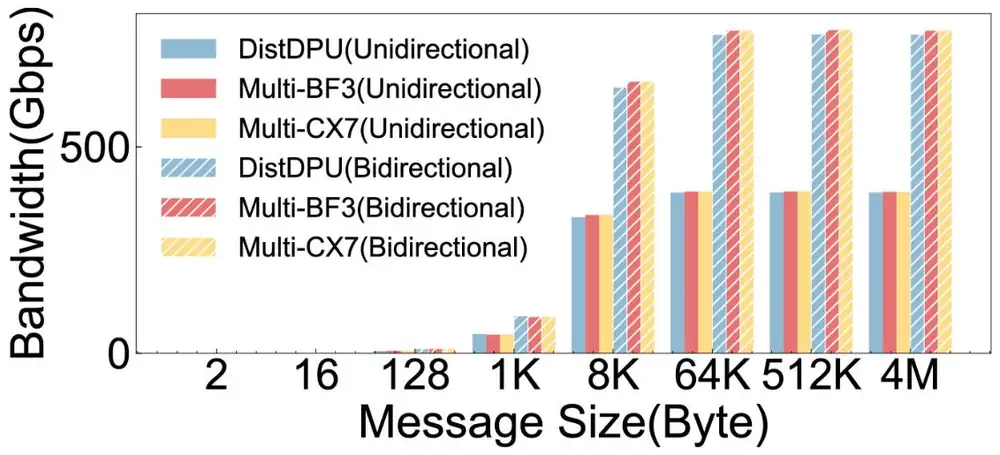
| Peak RDMA | RDMA 峰值 | Testbed, one NIC (Fig. 10) | 測試平台,單張 NIC(Fig. 10) | Within 0.4–2.8% of both baselines | 與兩個基準相差 0.4–2.8% |
| VXLAN vs NAT | VXLAN 與 NAT | Testbed, one 400G EM (Fig. 9) | 測試平台,一個 400G EM(Fig. 9) | VXLAN 1.2–7.8% lower for large messages | 大訊息時 VXLAN 低 1.2–7.8% |
| Training, Mixtral 8×7B | 訓練,Mixtral 8×7B | 16 and 32 H20 GPUs (Fig. 11) | 16 與 32 顆 H20 GPU(Fig. 11) | +0.43% to +1.26% | +0.43% 到 +1.26% |
| Training, Llama2-7B | 訓練,Llama2-7B | Same | 同上 | −0.03% to +0.1% | −0.03% 到 +0.1% |
| Inference, DeepSeek-R1 | 推論,DeepSeek-R1 | Testbed, SGLang (Figs. 12–13) | 測試平台,SGLang(Figs. 12–13) | TTFT and TPOT within a few percent | TTFT 與 TPOT 相差幾個百分點以內 |
| M2M latency, 4 bytes | M2M 延遲,4 位元組 | Deployed hardware, PCIe (§5.4) | 部署中的硬體,PCIe(§5.4) | Write 2.2 µs, read 4.9 µs | 寫 2.2 µs、讀 4.9 µs |
The throughput plot below is the core parity result. DistDPU had VPC virtualization on and the baselines had it off, so parity means that the provider's isolation costs little throughput. The low end of the VXLAN gap is about the header alone: by our arithmetic, 50 bytes on 4 KB of payload is 1.2%.
下面的吞吐量圖是持平結果的核心。DistDPU 開著 VPC 虛擬化,基準則關閉,所以持平代表業者的隔離只花很少的吞吐。VXLAN 落差的下限大約就是標頭本身:依我們的算術,4 KB 載荷加 50 位元組是 1.2%。
Cost and power: analysis, not measurement成本與功耗:分析,不是量測
The paper's Figure 8 gives per-node hardware cost and power, normalized to DistDPU = 1. Prices are confidential and the method is unstated, so read them only as ratios (§5.2):
論文的 Figure 8 給出每個節點的硬體成本與功耗,以 DistDPU = 1 正規化。價格保密、方法未說明,所以只能當比值讀(§5.2):
| Per node, analysis | 每個節點,分析值 | Cost | 成本 | Power | 功耗 |
|---|---|---|---|---|---|
| Multi-BF3: nine BlueField-3s | Multi-BF3:九顆 BlueField-3 | 4.91× | 4.91× | 2.77× | 2.77× |
| Multi-CX7: nine ConnectX-7s, no DPU functions, host CPU not counted | Multi-CX7:九張 ConnectX-7,沒有 DPU 功能,未計入所需的主機 CPU | 1.96× | 1.96× | 0.69× | 0.69× |
| Multi-DPU: nine of Tencent's own DPUs | Multi-DPU:九顆騰訊自研 DPU | 2.45× | 2.45× | 3.46× | 3.46× |
| Multi-RNIC: nine of Tencent's own RNICs | Multi-RNIC:九張騰訊自研 RNIC | 0.82× | 0.82× | 0.69× | 0.69× |
The own-hardware pair shows that the gap comes from the architecture, not from NVIDIA's prices. A two-part model reproduces it. Let be the cost of one control block (SoC plus memory) and the cost of one datapath (an EM, or an RNIC of the same rate), as fractions of a DistDPU node with :
自研硬體這一組說明差距來自架構,而非 NVIDIA 的定價。一個兩部分的模型可以重現它。令 為一個控制區塊(SoC 加記憶體)的成本、 為一條資料路徑(一個 EM,或同速率的一張 RNIC)的成本,都以 的 DistDPU 節點為 1:
Fitted to the paper's ratios, one question per row (our fit, not the paper's method):
用論文的比值擬合,逐列計算如下(我們的擬合,不是論文的方法):
| Question問題 | Calculation算式 | Result結果 |
|---|---|---|
| Control block, from DistDPU = 1 and Multi-DPU = 2.45 at 控制區塊,由 時 DistDPU = 1、Multi-DPU = 2.45 得出 | ||
| Datapath, from 資料路徑,由 得出 | ||
| Check: nine RNICs (paper: 0.82)驗算:九張 RNIC(論文:0.82) | ||
| Power: same fit to 3.46, then nine RNICs (paper: 0.69)功耗:同樣擬合 3.46,再驗算九張 RNIC(論文:0.69) | ||
| Share of the stacked node's cost in SoCs堆疊節點成本中 SoC 的比例 | power: about 80%功耗:約 80% |
The control block is about 18% of a DistDPU node's NIC cost and 31% of its power; stacking makes it two thirds and four fifths. The ratio is 1 at and approaches as grows. Panel 1 runs the model with the control load. The paper's analysis also counts 8× faster growth of managed entities with stacking (§5.2).
控制區塊約占 DistDPU 節點 NIC 成本的 18%、功耗的 31%;堆疊讓它變成三分之二與五分之四。 時比值為 1, 增加時趨近 。面板 1 把這個模型與控制負載一起算。論文的分析也指出,堆疊時被管理的實體成長快 8 倍(§5.2)。
6. Limits and open questions6. 限制與未解的問題
The paper's own next steps are several OMs per server if near-data processing needs more compute, finer isolation for co-located tenants, and in-band Ethernet M2M for cross-node management, which is planned. A careful reader adds:
論文自己的下一步是:若近資料處理需要更多算力,每台伺服器放多個 OM;為混合部署的租戶做更細的隔離;以及用於跨節點管理的帶內 Ethernet M2M,目前還在規劃。細心的讀者還應補上:
- Provisioned is not measured. 3.6 Tb/s is nine 400G port pairs. The RDMA test measured one NIC, and training used at most 32 GPUs, so spraying and CC selection are untested at fabric scale.配置不等於量測。3.6 Tb/s 是九組 400G 埠。RDMA 測試只量一張 NIC,訓練最多用 32 顆 GPU,所以封包噴灑與壅塞控制的選擇都沒有在整個網路的規模下測過。
- Unequal configurations. Virtualization was on only for DistDPU, and the paper does not say whether NAT or VXLAN ran in the RDMA, training and inference tests.配置不對等。只有 DistDPU 開著虛擬化,論文也沒有說 RDMA、訓練與推論測試跑的是 NAT 還是 VXLAN。
- Where the saving comes from. In Figure 2(b), DPUs for general compute and for AI are about equally busy. The saving is one SoC instead of nine, and even that one OM is about 85% idle.省下的錢從哪裡來。在 Figure 2(b) 中,服務一般運算與服務 AI 的 DPU 忙碌程度差不多。省下的是一顆 SoC 取代九顆,而就算只剩一個 OM,也約有 85% 閒置。
- One OM, one fate. The paper gives no OM hardware failure rate and does not evaluate isolation between co-located tenants who share one OM.一個 OM,一個命運。論文沒有給 OM 硬體的故障率,也沒有評估共用一個 OM 的混合部署租戶之間的隔離。
- Unmeasured mechanisms. No experiment isolates DOT, SRAM pinning, stable container GIDs or CC selection, and the cost method is unstated.沒有量測的機制。沒有實驗單獨測試 DOT、SRAM 釘選、穩定的容器 GID 或壅塞控制的選擇,成本的計算方法也沒有說明。
7. How it connects7. 與其他內容的關聯
- Chapter 9: section 1's nine NICs per host, now under one manager. Section 5's rule that monitoring must not depend on the network it monitors becomes "policy must not depend on the host it polices", with M2M as an in-host out-of-band path. Section 6 gets the numbers that HPN did not give.第 9 章:第 1 節每台主機九張 NIC,現在歸同一個管理者。第 5 節「監控不能依賴它所監控的網路」變成「政策不能依賴它所管制的主機」,M2M 就是主機內的帶外路徑。第 6 節得到 HPN 沒有給的數字。
- Chapter 2, "Generations, ports and the DPU": the same 2×200G ports and Gen5 x16 links, with the DPU split into dies. Chapter 7, sections 4 and 6: DCQCN, spraying and selective retransmission inside each EM.第 2 章的「世代、埠與 DPU」:同樣的 2×200G 埠與 Gen5 x16 連結,DPU 則拆成數個晶粒。第 7 章第 4 與 6 節:每個 EM 內的 DCQCN、封包噴灑與選擇性重傳。
- ByteCheckpoint makes the checkpoint traffic on the full-feature NIC cheap; Checkmate moves checkpoint capture into the back-end switch. Guided readings: Alibaba HPN (the 1 + 8 NIC layout) and Meta RoCE (the CapEx share).ByteCheckpoint 讓全功能 NIC 上的檢查點流量變便宜;Checkmate 則把檢查點的擷取移到後端交換器。論文導讀:Alibaba HPN(1 + 8 張 NIC 的配置)與 Meta RoCE(CapEx 的比例)。
Key numbers關鍵數字
| Number | 數字 | Meaning and setup | 意義與設定 |
|---|---|---|---|
| ≈14% · below 15% | Control-core load at 3.6 Tb/s, 12 h (Fig. 2) · 24 h average (Fig. 7); production | 3.6 Tb/s 時控制核心的負載,12 小時(Fig. 2)· 24 小時平均(Fig. 7);正式環境 | |
| G, 3.6 Tb/s | Provisioned capacity per server, N ∈ {0, 4, 8}; not a measurement | 每台伺服器的配置容量,N ∈ {0, 4, 8};不是量測 | |
| 0.4–2.8% | Peak RDMA gap vs nine BlueField-3s or ConnectX-7s; one NIC, two-node H20 testbed | 與九顆 BlueField-3 或 ConnectX-7 的 RDMA 峰值差距;單張 NIC,兩節點 H20 測試平台 | |
| 1.2–7.8% | VXLAN goodput below NAT, large messages; one 400G EM, testbed | 大訊息時 VXLAN 有效吞吐低於 NAT;一個 400G EM,測試平台 | |
| +0.43–1.26% · −0.03–0.1% | Training vs baselines, Mixtral 8×7B · Llama2-7B; 16 and 32 H20 GPUs | 與基準相比的訓練吞吐,Mixtral 8×7B · Llama2-7B;16 與 32 顆 H20 GPU | |
| 2.2 µs · 4.9 µs | M2M write · read, 4-byte message over PCIe; deployed hardware | M2M 寫入 · 讀取,經 PCIe 的 4 位元組訊息;部署中的硬體 | |
| 0.10–0.73% per month | EM failures, mostly optics; last year of production logs | EM 故障,多為光學元件;過去一年的正式環境日誌 | |
| 4.91× · 2.77× | Multi-BF3 cost · power per node vs DistDPU; analysis, method unstated | Multi-BF3 每節點成本 · 功耗相對 DistDPU;分析值,方法未說明 | |
| 2.45× · 3.46× | Multi-DPU (own DPUs) cost · power vs DistDPU; analysis | Multi-DPU(自研 DPU)成本 · 功耗相對 DistDPU;分析值 |
Terms used on this page本頁用到的術語
- OM / EM
- Orchestration Module, the one shared control SoC / Execution Module, the per-NIC line-rate datapath.
- 編排模組,唯一共用的控制 SoC/執行模組,每張 NIC 上的線速資料路徑。
- Full-feature / EM-only NIC
- The card with the OM and a local EM / the cheaper card with an EM only.
- 載有 OM 與本地 EM 的卡/只有 EM、較便宜的卡。
- M2M fabric
- The private OM-to-EM management channel over node-internal PCIe, relayed by the local EM.
- OM 到 EM 的私有管理通道,走節點內部的 PCIe,由本地 EM 中繼。
- Policy anchor
- A point that enforces tenant policy and that the tenant cannot change, even with root.
- 執行租戶政策、且租戶即使有 root 也改不了的點。
- Control–data plane divergence
- Bandwidth grows each generation while control work stays flat.
- 頻寬每一代都成長,控制工作卻持平。
- Overlay / NAT mode
- Wrap the tenant packet in VXLAN / rewrite its VIP to a PIP one to one.
- 把租戶封包包進 VXLAN/一對一把 VIP 改寫成 PIP。