Odin: Rethinking Congestion Control under All-to-All TrafficOdin:重新思考 All-to-All 流量下的壅塞控制
After reading, you can explain why MoE all-to-all traffic defeats per-port congestion control on lossless RoCE, and how Odin's buffer flag, NIC ratio and compensation step change an HPCC-style controller.讀完後,你能說明 MoE 的 all-to-all 流量為何讓無損 RoCE 上逐埠的壅塞控制失效,以及 Odin 的緩衝旗標、NIC 比值與補償步驟如何改變 HPCC 式的控制器。
In a Mixture-of-Experts (MoE) all-to-all (A2A), every node sends to every other node at once. Odin, from Central South University and ByteDance, shows how this defeats per-port congestion control (CC) on lossless RoCE. Many small queues add up to a large total buffer occupancy (TBO), which lowers the dynamic PFC threshold, so a switch can pause before it marks. Hundreds of queue pairs (QPs) share one NIC, so each QP's calculated rate is far above its real share, and its feedback comes only about every 50 µs. Odin adds three rules to an HPCC-style controller: a 1-bit TBO flag turns off additive increase, a NIC oversubscription ratio scales rates toward the NIC's capacity, and a compensation step fills idle links. On an 8-node, 40 Gb/s testbed, Odin cut TBO by 78.7% against DCQCN and raised throughput 1.75× against HPCC. Everything larger is simulation.
在 Mixture-of-Experts(MoE)的 all-to-all(A2A)中,每個節點同時送資料給其他每個節點。來自中南大學與字節跳動的 Odin 說明這如何擊敗無損 RoCE 上逐埠的壅塞控制(CC)。許多小佇列加總成很大的總緩衝占用(TBO),壓低了動態 PFC 門檻,所以交換器可能先暫停、後標記。數百個 queue pair(QP)共用一張 NIC,每個 QP 的計算速率遠高於它的真實份額,而它的回饋大約每 50 µs 才來一次。Odin 在 HPCC 式的控制器上加了三條規則:1 位元的 TBO 旗標關閉加性增加;NIC 超額訂閱比值把速率縮向 NIC 的容量;補償步驟填滿閒置的鏈路。在 8 個節點、40 Gb/s 的測試平台上,Odin 的 TBO 比 DCQCN 低 78.7%,吞吐量是 HPCC 的 1.75 倍。更大規模的結果全是模擬。
Where this paper sits這篇論文的位置
Section 7.4 showed that DCQCN works only if a switch marks before it pauses. The pause point is dynamic: the free shared buffer divided by a parameter, here , because Odin uses for its AI step. The derivation assumed one hot port. Section 5 showed ByteDance's MegaScale hit by PFC pauses under large all-to-all; Odin, with ByteDance co-authors, offers a likely reason, although the paper itself cites MegaScale only for its multi-rail topology.
第 7.4 節說明,DCQCN 只有在交換器先標記、後暫停時才有效。暫停點是動態的:剩餘共享緩衝除以一個參數,本頁寫成 ,因為 Odin 把 用作 AI 步長。那個推導假設只有一個熱埠。第 5 節提到字節跳動的 MegaScale 在大規模 all-to-all 下飽受 PFC 暫停之苦;Odin 有字節跳動的共同作者,它提供了一個可能的原因,不過論文本身引用 MegaScale 只是為了它的多 rail 拓樸。
HPCC in brief. Each switch writes in-band telemetry (INT) into data packets: queue length, bytes sent, link rate. The ACK carries it back, and the sender computes the normalized load of the busiest hop,
HPCC 簡述。每台交換器把帶內遙測(INT)寫進資料封包:佇列長度、已送位元組、鏈路速率。ACK 把它帶回,發送端計算最忙那一跳的正規化負載,
with link rate , base RTT , queue and throughput . On every ACK it scales its rate toward a target utilization (MIMD) and adds a small additive increase (AI) for fairness:
其中 是鏈路速率、 是基本 RTT、 是佇列、 是吞吐量。每個 ACK 到達時,發送端把速率朝目標使用率 乘法調整(MIMD),再加上一個小的加性增加(AI) 以求公平:
Odin keeps this rule (its Eq. 3). What was missing before: every signal on the site measures one port or one path, so none sees a sum of many small queues, or a rate that the NIC cannot send.
Odin 保留這條規則(它的 Eq. 3)。之前缺少的是:本站的每一種訊號都只量一個埠或一條路徑,所以看不到許多小佇列的總和,也看不到 NIC 送不出去的速率。
The problem: what all-to-all does to a switch and a NIC問題:all-to-all 對交換器與 NIC 做了什麼
Unlike incast, an A2A loads every ingress and every egress port at once (Chapter 3). The authors report large TBO in ByteDance's production clusters but give no production numbers. Almost all their evidence is NS-3 simulation, so this page gives the mechanisms and the paper's arithmetic, not the simulated curves.
與 incast 不同,A2A 同時壓滿每一個入口埠與出口埠(第 3 章)。作者表示 A2A 在字節跳動的生產叢集中造成很大的 TBO,但沒有給任何生產環境的數字。他們的證據幾乎全是 NS-3 模擬,所以本頁講的是機制與論文的算術,而不是模擬的曲線。
1. Many small queues fill one shared buffer1. 許多小佇列填滿同一個共享緩衝
CC starts every QP at line rate, so the first packets collide. Appendix A takes the worst case: in each time slice, ingress ports send one packet each to one egress port, which forwards one; the next slice hits the next port. The queues end at 0, 0, 1, …, packets (figure below), so the total, in packets, is
CC 讓每個 QP 從線速開始,所以第一批封包會相撞。Appendix A 取最差情況:每個時間片, 個入口埠各送一個封包到同一個出口埠,而它只轉送一個;下一個時間片換下一個埠。各佇列最後停在 0、0、1、…、 個封包(見下圖),所以以封包計的總量是
This is the paper's Eq. 7: each queue is small, but the sum grows with . Our arithmetic from it:
這是論文的 Eq. 7:每個佇列都不大,總和卻隨 成長。以下是我們依它所做的算術:
| Question (our arithmetic from Eq. 7)問題(依 Eq. 7 的我方算術) | Calculation算式 | Result結果 |
|---|---|---|
| Packets queued after one round, 128 ports128 個埠在一輪之後排隊的封包 | packets個封包 | |
| Bytes at 4 KB per packet每個封包 4 KB 時的位元組 | MB40% of the 82 MB shared buffer82 MB 共享緩衝的 40% | |
| Mean queue per egress port每個出口埠的平均佇列 | KB | |
| Same formula for the 8-port testbed同一公式用在 8 埠測試平台 | packets個封包 |
Why the sum matters. Under the dynamic threshold, every port pauses when its ingress counter exceeds for a shared buffer , while ECN marks at a fixed per egress queue. In our simplified model, every port holds at ingress and at egress, so a port pauses when
總和為何要緊。在動態門檻下,共享緩衝為 時,每個埠的入口計數器一超過 就暫停;ECN 則在每個出口佇列固定的 標記。在我們的簡化模型中,每個埠在入口與出口都存著 ,所以一個埠在下列條件下暫停:
So an ECN threshold above it never marks first. For 82 MB, 128 ports and Chapter 7's value of 8 (Odin does not give its own), that is about 603 KB per port, near 77 MB of TBO. The paper's simulation saw PFC on almost every port and ECN on only a few.
所以高於它的 ECN 門檻永遠不會先標記。以 82 MB、128 個埠,加上第 7 章的值 8(Odin 沒有給自己的值),這是每埠約 603 KB,TBO 接近 77 MB。論文的模擬看到 PFC 幾乎在每個埠觸發,ECN 只在少數幾個埠標記。
A low is not enough. With DCQCN's thresholds lowered to 50 and 100 KB, the simulated TBO stayed large, because DCQCN raises its rate on a timer between sparse marks.
低的 並不夠。DCQCN 的門檻調低到 50 與 100 KB 後,模擬中的 TBO 仍然很大,因為 DCQCN 在稀疏的標記之間依計時器自行提高速率。
2. Rate inflation: the calculated rate is not the real rate2. 速率膨脹:計算速率不是真實速率
With 5 QPs to each of 126 peers, a NIC carries 630 QPs. Each starts at a calculated rate of 400 Gb/s, but they share 400 Gb/s: rate inflation. A cut does nothing until the calculated rate falls below the real share, and each QP gets feedback only once per packet. From §2.2.2:
對 126 個對端各開 5 個 QP,一張 NIC 就承載 630 個 QP。每個 QP 以 400 Gb/s 的計算速率開始,但它們共用 400 Gb/s:這就是速率膨脹。在計算速率低於真實份額之前,降速毫無作用,而每個 QP 每送一個封包才得到一次回饋。依 §2.2.2:
| Question (630 QPs on a 400 Gb/s NIC)問題(400 Gb/s NIC 上有 630 個 QP) | Calculation算式 | Result結果 |
|---|---|---|
| Real share of one QP一個 QP 的真實份額 | Gb/scalculated: 400 Gb/s計算速率:400 Gb/s | |
| Time between packets, and so between ACKs封包間隔,也就是 ACK 間隔 | µsthe paper rounds to 50 µs; base RTT 8 µs論文取整為 50 µs;基本 RTT 8 µs | |
| DCQCN halvings to get below the shareDCQCN 要減半幾次才低於份額 | at most one per feedback每次回饋最多一次 | |
| Time for those halvings這些減半所需的時間 | µs | msabout 65 base RTTs約 65 個基本 RTT |
With one QP per pair (Appendix D.1), this effect is much weaker for DCQCN in simulation: the QP count drives it.
每對只用一個 QP 時(Appendix D.1),這個效應對 DCQCN 在模擬中明顯減弱:驅動它的是 QP 數量。
3. Pre-emption at the NIC: a rate cut that makes TBO grow3. NIC 上的搶占:讓 TBO 增長的降速
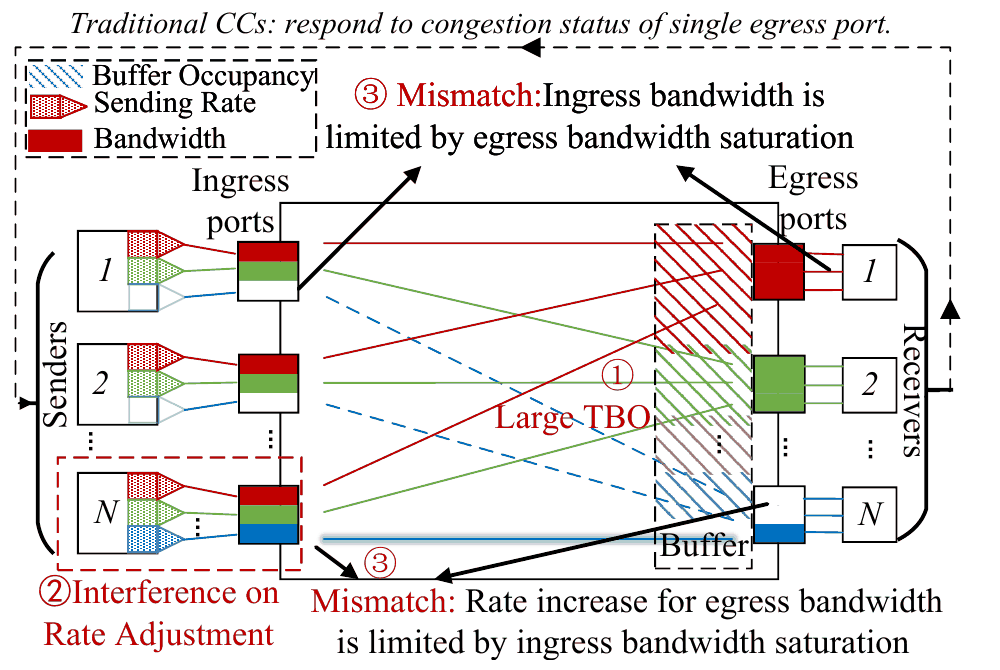
Suppose that one egress port, SPort, is congested. Its QPs cut their calculated rates (①), but their real rates fall only once the calculated rates drop below the share (②). The NIC bandwidth that they free goes at once to sibling QPs that are still inflated (③). SPort drains (④) while the other queues grow (⑤). Each ingress port still receives 400 Gb/s, so TBO grows faster just when CC acts.
假設一個出口埠 SPort 壅塞了。往它的 QP 調降計算速率(①),但真實速率要等計算速率低於份額才會下降(②)。它們釋出的 NIC 頻寬立刻被仍然膨脹的兄弟 QP 拿走(③)。SPort 排空(④),其他佇列卻在增長(⑤)。每個入口埠仍然收到 400 Gb/s,所以正好在 CC 動作的時候,TBO 長得更快。
4. Ingress–egress mismatch4. 入口與出口不匹配
Existing CC has what the paper calls Feature 1: when a QP finishes, no surviving QP slows down. A2A finishes fastest only if every ingress and egress link stays full, and Theorem 1 (Appendix B, from Hall's marriage theorem) shows that some finish orders make this impossible under Feature 1. So CC for A2A must watch the ingress side. Figure 4 of the paper shows all three problems.
現有的 CC 有論文所說的 Feature 1:一個 QP 結束時,沒有任何存活的 QP 會減速。A2A 只有在每條入口與出口鏈路都保持滿載時才完成得最快,而 Theorem 1(Appendix B,由 Hall 婚配定理推得)證明在 Feature 1 之下,某些結束順序讓這件事不可能發生。所以給 A2A 用的 CC 必須看入口端。論文的 Figure 4 畫出全部三個問題。
The design設計
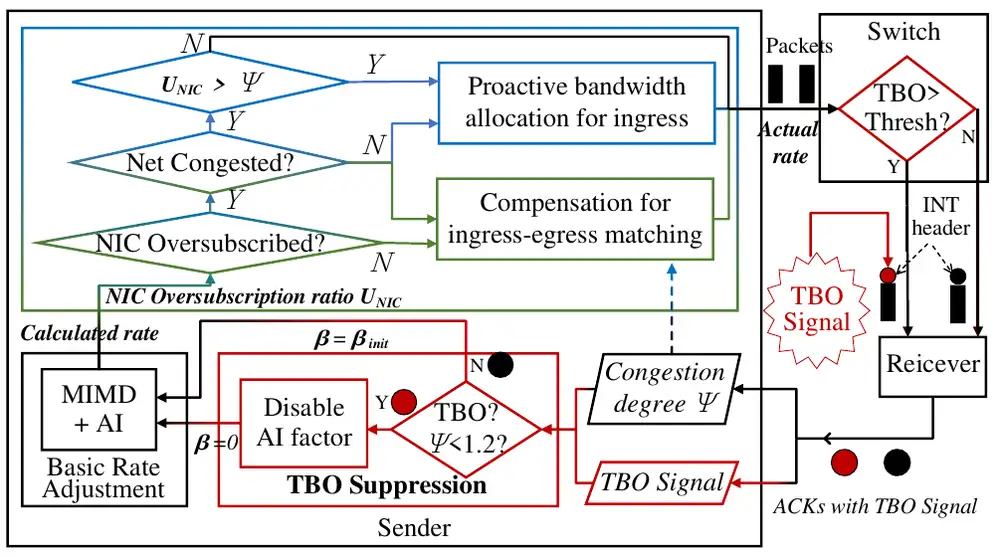
Odin extends Eq. 3 on every ACK (the paper's Algorithm 1) with three inputs: per-hop INT, a 1-bit TBO flag from each switch, and one NIC-wide sum of calculated rates.
Odin 在每個 ACK 上擴充 Eq. 3(論文的 Algorithm 1),使用三個輸入:每一跳的 INT、每台交換器的 1 位元 TBO 旗標,以及整張 NIC 的計算速率總和。
1. TBO suppression: one bit from the switch1. 抑制 TBO:交換器送來的一個位元
Each switch counts its TBO and sets the flag in INT when it exceeds
每台交換器計算自己的 TBO,超過下列門檻時就在 INT 中設定旗標:
with : 5.125 MB for 82 MB. If an ACK carries the flag and , the sender sets and AI stops. Above 1.2, a few hot ports more likely made the TBO, and MIMD with AI should clear them fairly; a flag with mild per-port load is the A2A signature. Without AI, a bottleneck's standing queue goes toward zero instead of growing with the flow count, so TBO drains, then hovers near the threshold as AI returns.
其中 :82 MB 時是 5.125 MB。若 ACK 帶著旗標且 ,發送端就令 ,AI 停止。高於 1.2 時,TBO 比較可能來自少數熱埠,應由帶 AI 的 MIMD 公平清除;有旗標而每埠負載輕微,才是 A2A 的特徵。沒有 AI 時,瓶頸的常駐佇列趨近於零,而不是隨流數增長,於是 TBO 排空,之後隨 AI 恢復而在門檻附近徘徊。
2. Proactive allocation: make the calculated rate real2. 主動分配:讓計算速率成真
The NIC smooths the sum of its QPs' calculated rates into the NIC oversubscription ratio,
NIC 把所有 QP 計算速率的總和平滑成 NIC 超額訂閱比值:
with NIC bandwidth and ; a value above 1 means rate inflation. When and the NIC dominates (), each ACK also applies
其中 是 NIC 頻寬,;大於 1 就表示速率膨脹。當 且 NIC 的影響大於網路()時,每個 ACK 還會套用
This is Eq. 5. It moves each rate a fraction of the way toward its share. All QPs on the NIC get the same factor, so the fairness among them is kept, and later network reactions act on rates that the NIC can really send.
這是 Eq. 5。它讓每個速率朝自己的份額移動 的比例。NIC 上所有 QP 都乘上同一個係數,所以彼此的公平性不變,之後對網路的反應作用的都是 NIC 真的送得出去的速率。
3. Compensation: break Feature 13. 補償:打破 Feature 1
Two branches add rate on purpose. If the NIC is full but the path has idle capacity (), Odin applies Eq. 5 and then adds , so the QP takes idle egress bandwidth. If , every QP adds (Eq. 6). This breaks Feature 1 at some cost in short-term fairness. On classic traffic the NIC is rarely full, so the first branch rarely fires; the second adds the same step to every QP, doubling AI without hurting fairness, and Odin acts like HPCC. Panel 2 runs one ACK through them.
有兩個分支刻意增加速率。若 NIC 已滿而路徑還有閒置容量(),Odin 先套用 Eq. 5 再加上 ,讓這個 QP 拿走閒置的出口頻寬。若 ,每個 QP 都加上 (Eq. 6)。這以一些短期公平為代價打破 Feature 1。在傳統流量上 NIC 很少滿載,所以第一個分支很少觸發;第二個分支讓每個 QP 加上同樣的步長,等於把 AI 加倍而不損公平,Odin 的行為就像 HPCC。面板 2 讓一個 ACK 走過這些規則。
Implementation實作
A DPDK prototype on ConnectX-5 NICs parses ACK feedback, runs Algorithm 1 and paces each QP. A P4 program on a Tofino keeps one TBO variable, compares it in one ALU and writes the flag into reserved INT space. No line counts are given. The cost per ACK uses a SiFive 7 RISC-V model: 1, 3 and 16 cycles per compare or add, multiply and divide.
ConnectX-5 NIC 上的 DPDK 原型解析 ACK 回饋、執行 Algorithm 1,並對每個 QP 做 pacing。Tofino 上的 P4 程式用一個變數記錄 TBO,以一個 ALU 比較,並把旗標寫進預留的 INT 空間。論文沒有給程式碼行數。每個 ACK 的成本採用 SiFive 7 RISC-V 模型:比較或加減、乘法、除法各 1、3、16 個週期。
| Question (analysis, per ACK)問題(分析,每個 ACK) | Calculation算式 | Result結果 |
|---|---|---|
| HPCC, two-layer Clos with 3 hops: 25 compares or adds, 9 multiplies, 8 dividesHPCC,3 跳的兩層 Clos:25 次比較或加減、9 次乘、8 次除 | cycles個週期 | |
| Odin's additions: 7 compares or adds, 3 multiplies, 1 divideOdin 增加的:7 次比較或加減、3 次乘、1 次除 | cycles個週期about 18% more多約 18% |
A deployment needs a programmable CC engine in the NIC, such as BlueField-3 DOCA-PCC or ConnectX-8, and switches that export their buffer counter. Switches keep that counter for PFC but do not expose it today.
部署需要 NIC 中可程式化的 CC 引擎(例如 BlueField-3 DOCA-PCC 或 ConnectX-8),以及能匯出緩衝計數器的交換器。交換器為 PFC 維護這個計數器,但目前不對外提供。
What was measured量了什麼
Eight Dell Precision 5820 workstations with ConnectX-5 NICs share one Tofino 1 switch with PFC on; CC runs in DPDK, with the NIC's DCQCN off. Each NIC sends at most 40 Gb/s, and the base RTT is under 10 µs. All 8 nodes start one A2A together.
八台 Dell Precision 5820 工作站以 ConnectX-5 NIC 共用一台開著 PFC 的 Tofino 1 交換器;CC 跑在 DPDK 中,NIC 的 DCQCN 關閉。每張 NIC 最多送 40 Gb/s,基本 RTT 低於 10 µs。8 個節點同時開始一次 A2A。
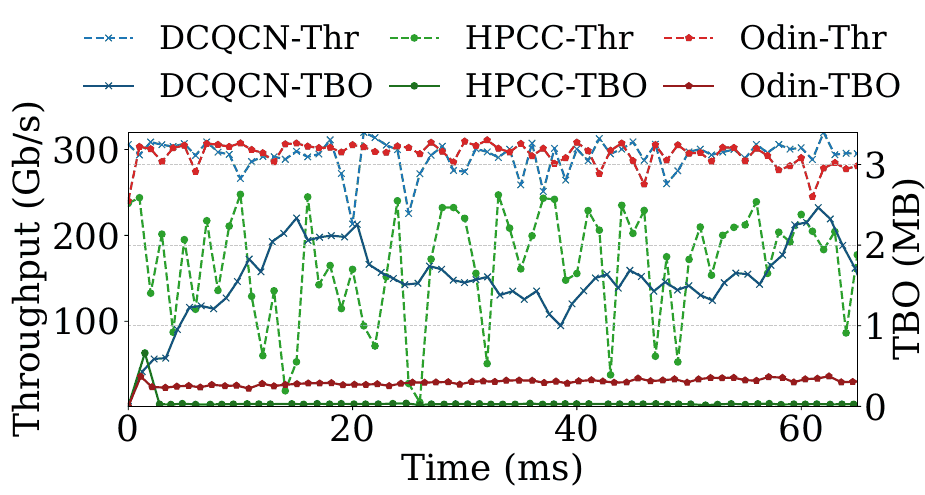
DCQCN builds about 2 MB of TBO through its timer-driven increase. HPCC keeps TBO near zero but loses throughput, because it reacts strongly to small queues. Odin keeps both in check. These are the paper's only hardware numbers:
DCQCN 因依計時器提高速率而累積約 2 MB 的 TBO。HPCC 讓 TBO 接近零卻損失吞吐量,因為它對很小的佇列反應強烈。Odin 兩者都控制住了。以下是論文僅有的硬體數字:
| Metric指標 | Odin againstOdin 相對於 | Result結果 |
|---|---|---|
| Total buffer occupancy總緩衝占用 | DCQCN | −78.7% |
| Throughput吞吐量 | HPCC | 1.75× |
The 512-node, asynchronous, prefill–decode, mixed AllReduce, MoE-trace, AlexNet and WebSearch results are NS-3, most with SimAI traffic, so this site does not report them.
512 節點、非同步、prefill–decode、混合 AllReduce、MoE 訓練紀錄、AlexNet 與 WebSearch 的結果都是 NS-3 模擬,其中多數使用 SimAI 流量,所以本站不列出它們。
Limits and open questions限制與未解的問題
The paper's own. Matching is done only at the NIC; fabric hops are future work. Compensation trades short-term fairness. With static buffer allocation, PFC-before-ECN disappears, but large TBO remains. And switches must export a counter that they now keep internally.
論文自己承認的。匹配只在 NIC 上進行,網路中的各跳留待未來。補償犧牲短期公平。使用靜態緩衝分配時,PFC 先於 ECN 的現象消失,但大的 TBO 仍在。還有,交換器必須匯出一個目前只在內部維護的計數器。
What to question. The hardware test is 8 nodes at 40 Gb/s, where start-up TBO is only 21 packets, with CC in DPDK and no deployment. The AI step, the switch's dynamic-threshold parameter and the baselines' 400 Gb/s thresholds are not given in numbers (Figure 2 draws DCQCN's near 0.7 and 1.6 MB), and PFC-before-ECN depends on the second. NCCL's clear-to-send caps bytes in flight (Section 7.5); if the simulated traffic ignores it, 630 QPs at line rate may overstate TBO. Rate inflation scales with the chosen 5 to 10 QPs per pair. There is no measured comparison with Meta's deep-buffer spines or with lossy transports.
該追問的。硬體測試是 8 個節點、40 Gb/s,起始 TBO 只有 21 個封包,CC 跑在 DPDK 中,也沒有部署。AI 步長、交換器的動態門檻參數,以及各基準在 400 Gb/s 下的門檻都沒有以數字給出(Figure 2 畫出 DCQCN 的門檻,約 0.7 與 1.6 MB),而 PFC 先於 ECN 取決於其中第二項。NCCL 的 clear-to-send 會限制在途位元組(第 7.5 節);若模擬的流量忽略它,630 個 QP 從線速開始可能高估 TBO。速率膨脹隨所選的每對 5 到 10 個 QP 而放大。論文也沒有以實驗與 Meta 的深緩衝 spine 或有損傳輸比較。
How it connects與其他內容的關聯
Try the dynamic threshold in Chapter 7's Panel 3 and DCQCN's line-rate start in its Panel 4; the DCQCN reading explains the missing slow start where rate inflation begins. The Meta RoCE reading covers QP scaling and the deep-buffer spines that absorb leaf TBO, and Alibaba HPN runs HPCC. In this chapter, DCP, Falcon and Stellar make loss cheap and add multipath instead. Odin argues that load balancing hardly helps A2A on a non-oversubscribed Clos, where every ToR downlink is full; compare Stellar's spraying gains and Section 8.5.
可以在第 7 章的面板 3 試試動態門檻,在面板 4 看 DCQCN 從線速開始;DCQCN 導讀說明它為何沒有慢啟動,速率膨脹正從這裡開始。Meta RoCE 導讀談 QP 擴增以及吸收 leaf TBO 的深緩衝 spine,阿里 HPN 執行的正是 HPCC。在本章中,DCP、Falcon 與 Stellar 則讓丟包變便宜並加入多路徑。Odin 主張在沒有超額訂閱的 Clos 上,每條 ToR 下行鏈路都已滿載,負載平衡幾乎幫不了 A2A;可對照 Stellar 的噴灑收益與第 8.5 節。
Key numbers關鍵數字
| Number數字 | What it is是什麼 | Setup and kind設定與類型 |
|---|---|---|
| −78.7% | TBO, Odin against DCQCNTBO,Odin 相對 DCQCN | 8 × ConnectX-5 at 40 Gb/s, one Tofino 1, CC in DPDK; testbed8 張 ConnectX-5、40 Gb/s、一台 Tofino 1、CC 在 DPDK;測試平台 |
| 1.75× | Throughput, Odin against HPCC吞吐量,Odin 相對 HPCC | Same testbed同一測試平台 |
| 180 + 32 | Cycles per ACK: HPCC, and Odin's addition每個 ACK 的週期數:HPCC,以及 Odin 增加的 | SiFive 7 model, 3 hops; analysisSiFive 7 模型、3 跳;分析 |
| Worst-case start-up TBO in packets; ≈ 32.8 MB at 128 ports and 4 KB, our arithmetic最差情況的起始 TBO(封包數);128 埠、4 KB 時約 32.8 MB,我方算術 | One switch; analysis一台交換器;分析 | |
| 0.635 vs 400 Gb/s; 50 vs 8 µs | One QP's real share against its calculated rate; its ACK interval against the base RTT一個 QP 的真實份額對計算速率;它的 ACK 間隔對基本 RTT | 630 QPs per NIC, 4 KB; analysis每張 NIC 630 個 QP、4 KB;分析 |
| 1/16; 0.1; 1.2; 0.9 | ; ; the gate; the compensation gate;; 閘門;補償閘門 | Odin's settingsOdin 的設定值 |
Terms used on this page本頁用到的術語
- All-to-all (A2A)
- Every participant sends a different block to every other one; the core of MoE expert dispatch.
- 每個參與者各送一塊不同的資料給其他每個參與者;MoE 專家分派的核心。
- Total buffer occupancy (TBO)
- All bytes queued in a shared-buffer switch, summed over its ports.
- 共享緩衝交換器中各埠排隊位元組的總和。
- Rate inflation
- A calculated rate far above the NIC share that a QP really gets.
- 計算速率遠高於 QP 實際分到的 NIC 份額。
- / MIMD + AI
- HPCC's load of the busiest hop / scaling by plus a small fairness step .
- HPCC 對最忙一跳的負載 / 以 縮放再加上求公平的小步長 。
- Smoothed sum of a NIC's calculated rates over its bandwidth.
- 一張 NIC 計算速率總和的平滑值除以其頻寬。
- Feature 1
- Existing CC never slows a surviving QP when another QP finishes.
- 現有 CC 在別的 QP 結束時,從不讓存活的 QP 減速。