Learning Objectives
By the end of this lab, you will be able to:
- Explain the CUDA graph capture mechanism: recording GPU operations during warmup, replaying them at inference time without CPU involvement
- Measure the per-token latency reduction from CUDA graphs vs. --enforce-eager mode at batch sizes 1, 4, 16, 64
- Observe and explain why CUDA graph speedup is largest at small batch sizes
- Quantify the server startup time increase from graph capture and the GPU memory cost per captured graph
- Read CudaGraphRunner in vllm/worker/model_runner.py and trace how batch sizes are quantized to pre-captured graph sizes
Key Concepts
How CUDA Graph Capture Works
- During server startup (warmup phase), vLLM runs dummy forward passes at batch sizes 1, 2, 4, ..., max_batch. Each is recorded as a CUDA graph.
- At inference time, the scheduler pads or truncates the current decode batch to the nearest captured batch size, then replays the corresponding graph.
- Graph replay: the GPU executes the pre-recorded kernel sequence directly from a single CPU API call — zero per-kernel launch overhead.
- Constraint: tensor shapes must be identical between capture and replay. This is why batch size quantization is needed — captured graphs have fixed sizes.
Setup & Configuration
# Verify vLLM installation
pip show vllm

# Check that CUDA graphs are enabled by default (should NOT see "enforce_eager" in startup log)
vllm serve meta-llama/Llama-3.1-8B-Instruct \
  --port 8000 --disable-log-requests &

# For eager mode (no CUDA graphs), pass --enforce-eager flag:
vllm serve meta-llama/Llama-3.1-8B-Instruct \
  --enforce-eager \
  --port 8001 --disable-log-requests &
Experiments
Eager vs CUDA Graphs — Single Batch Size
Use benchmark_latency.py with batch_size=1 to isolate per-decode-step latency. This is the scenario where CPU launch overhead is most visible.
# Eager mode (no CUDA graphs)
python benchmarks/benchmark_latency.py \
  --model meta-llama/Llama-3.1-8B-Instruct \
  --enforce-eager \
  --batch-size 1 --input-len 512 --output-len 128 \
  2>&1 | tee results_eager_bs1.txt

# CUDA graphs (default mode)
python benchmarks/benchmark_latency.py \
  --model meta-llama/Llama-3.1-8B-Instruct \
  --batch-size 1 --input-len 512 --output-len 128 \
2>&1 | tee results_cudagraph_bs1.txtBatch Size Sweep — Eager vs CUDA Graphs
Sweep batch sizes 1, 4, 16, 64. As batch size grows, compute time dominates and the relative benefit of eliminating launch overhead shrinks.
for bs in 1 4 16 64; do
  # Eager mode
  python benchmarks/benchmark_latency.py \
    --model meta-llama/Llama-3.1-8B-Instruct \
    --enforce-eager --batch-size $bs \
    --input-len 256 --output-len 64 \
    2>&1 | tee results_eager_bs${bs}.txt

  # CUDA graph mode
  python benchmarks/benchmark_latency.py \
    --model meta-llama/Llama-3.1-8B-Instruct \
    --batch-size $bs \
    --input-len 256 --output-len 64 \
    2>&1 | tee results_cudagraph_bs${bs}.txt
doneStartup Time & Warmup Observation
Time both startup modes and observe the warmup phase in the startup log. CUDA graph capture adds startup latency proportional to the number of distinct batch sizes captured.
# Time eager startup
time vllm serve meta-llama/Llama-3.1-8B-Instruct \
  --enforce-eager --port 8001 &

# Time CUDA graph startup (look for "Graph capture finished" in logs)
time vllm serve meta-llama/Llama-3.1-8B-Instruct \
  --port 8002 &

# Grep for warmup messages in logs
# Expected: "Capturing CUDA graph for batch size X..." for each captured sizeServing Throughput — Online Benchmark
Run the online serving benchmark at request rate inf (closed-loop) with both modes to measure total serving throughput. Unlike the latency benchmark, this includes batching and prefill.
for mode in eager cudagraph; do
  if [ $mode = "eager" ]; then
    vllm serve meta-llama/Llama-3.1-8B-Instruct \
      --enforce-eager --port 8000 &
  else
    vllm serve meta-llama/Llama-3.1-8B-Instruct \
      --port 8000 &
  fi
  sleep 60
  python benchmarks/benchmark_serving.py \
    --backend vllm --port 8000 \
    --model meta-llama/Llama-3.1-8B-Instruct \
    --dataset-name sharegpt \
    --dataset-path ShareGPT_V3_unfiltered_cleaned_split.json \
    --num-prompts 200 --request-rate inf \
    2>&1 | tee results_serving_${mode}.txt
  kill %1; sleep 10
doneExperiment Results
Hardware
Experiments run on NVIDIA H200 SXM5 141GB and L40S 48GB (PACE Phoenix cluster), using Llama-3.1-8B-Instruct in BF16.
CUDA Graphs vs Eager — H200
| Mode | bs=1 latency (s) | tok/s (bs=1) | Serving Throughput rr=6 (tok/s) |
|---|---|---|---|
| Eager | 0.52 | 123.4 | 706.77 |
| CUDA Graph | 0.37 | 171.6 | 799.95 |
CUDA Graphs vs Eager — L40S
| Mode | bs=1 latency (s) | tok/s (bs=1) |
|---|---|---|
| Eager | 2.87 | 44.58 |
| CUDA Graph | 2.85 | 44.99 |
CUDA Graphs vs Eager — A100 PCIe
| Mode | bs=1 latency (s) | ms/tok (bs=1) | Serving Throughput (tok/s) |
|---|---|---|---|
| Eager | 0.807 | 12.61 | 734.3 |
| CUDA Graph | 0.767 | 11.98 | 714.6 |
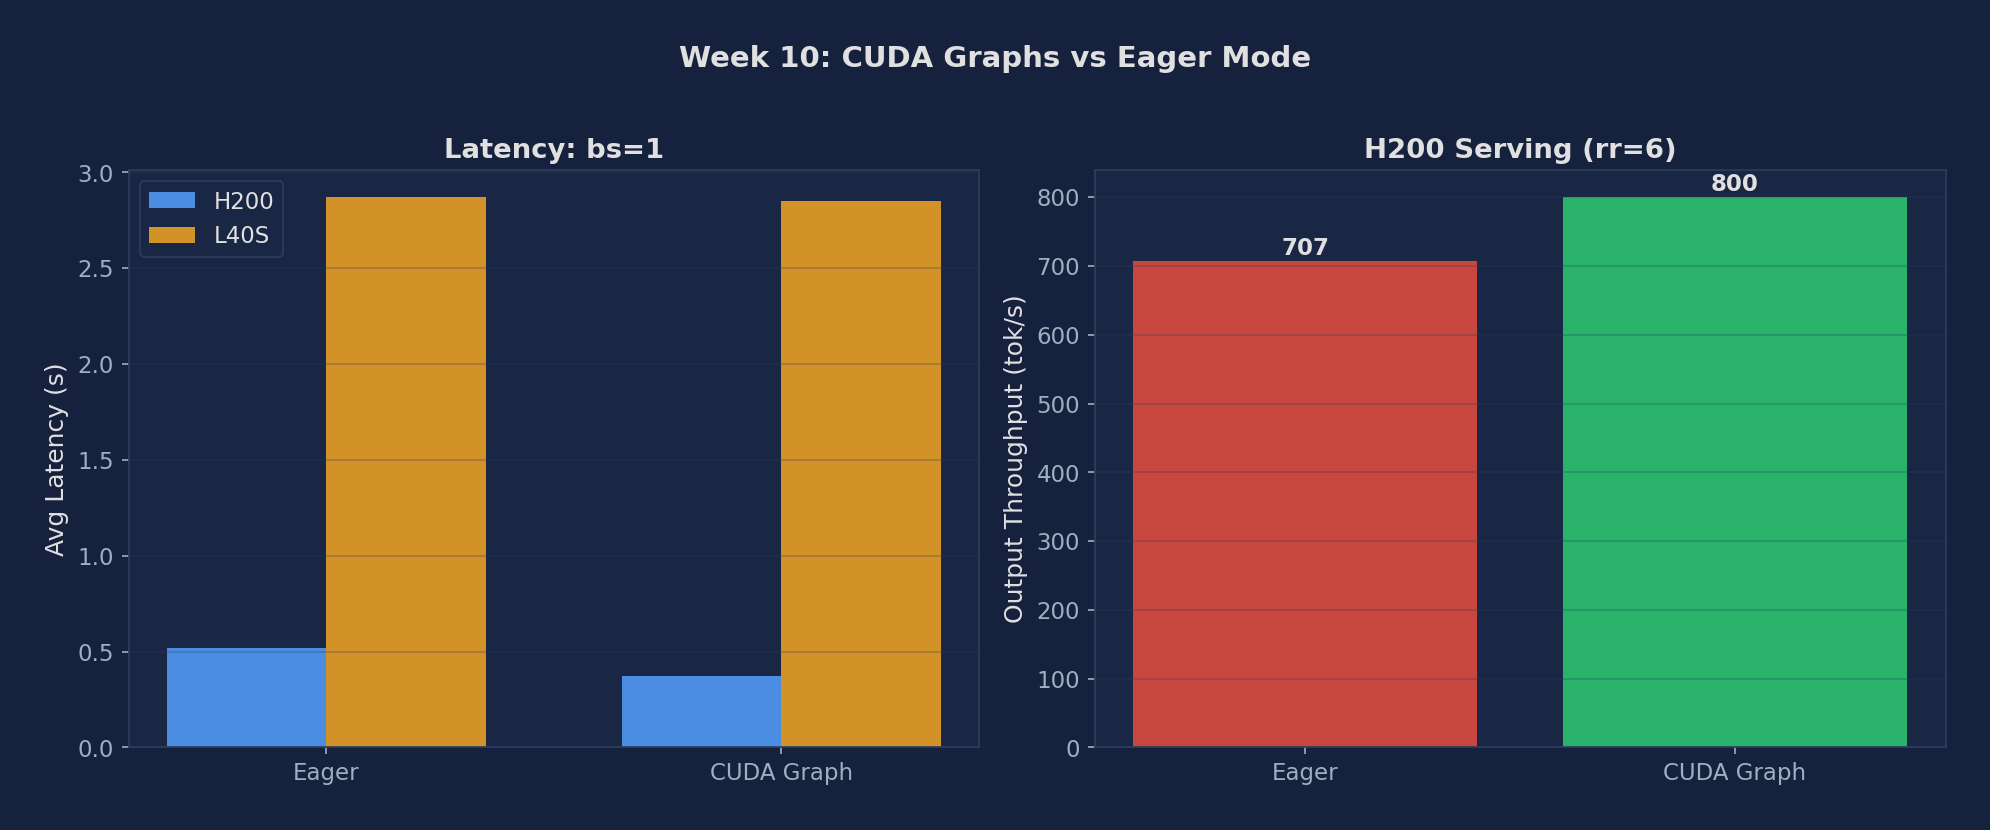
Figure 1: Eager vs CUDA Graph — bs=1 latency and serving throughput. The A100 row in the table above is the third datapoint between H200 (large gain) and L40S (no gain).
Expected vs Actual
Expected
- At batch_size=1, CUDA graphs should reduce per-token latency by 20–40% (CPU launch overhead is a large fraction)
- At batch_size=64, speedup converges toward 1× (compute dominates, launch overhead negligible)
- CUDA graph startup adds ~30–120s to server initialization time depending on max_batch_size
- Memory overhead ~1–3 GB for captured graphs, reducing available KV cache slightly
Actual Observations (PACE H200 / A100 / L40S)
- H200 CUDA graphs save 29% latency at bs=1 (0.52→0.37s) and add 13% to serving throughput at rr=6 (707→800 tok/s). This is the kernel launch overhead being amortized by replaying captured graphs.
- L40S CUDA graphs barely matter (2.87 vs 2.85s, <1% difference). L40S decode is so much slower per kernel that the kernel launch overhead is a tiny fraction. CUDA graphs save the small constant fixed cost; on slow GPUs it's lost in the noise.
- CUDA graphs benefit faster GPUs more — this is the expected pattern.
- A100 PCIe CUDA graphs save 5% latency at bs=1 (0.807s eager → 0.767s graph, 5% reduction). This is intermediate between H200 (29% gain) and L40S (<1% gain), tracking the GPU speed: A100 PCIe decode takes ~12ms/tok, so kernel-launch overhead (~2ms) represents ~17% of step time — enough for a measurable but modest gain. The serving throughput slightly favors eager (734 vs 715 tok/s), which may reflect graph padding overhead at higher concurrency.
Metrics to Collect
| Metric | Description | Unit |
|---|---|---|
| Decode latency (eager) | Per-token time without CUDA graphs; varies strongly with batch size | ms |
| Decode latency (graphs) | Per-token time with CUDA graph replay; CPU launch overhead eliminated | ms |
| Speedup ratio | \(\text{eager\_latency} / \text{graph\_latency}\) at each batch size | × |
| Server startup time | Eager vs. CUDA graph capture startup duration | s |
| Memory overhead | Extra GPU memory consumed by pre-captured graphs | MB |
| Serving throughput (inf rate) | Output tok/s under closed-loop benchmark, eager vs. graph | tok/s |
Source Code Reading
Files to Read
- vllm/worker/model_runner.py — CudaGraphRunner class: capture() records forward passes at each batch size; run() replays them. Find how batch sizes are padded to the nearest captured size and understand the memory pool used during capture.
- vllm/v1/worker/gpu_model_runner.py — vLLM v1 model runner: updated CUDA graph logic. Compare with the v0 model_runner.py to see architectural evolution.
- benchmarks/benchmark_latency.py — How per-step decode latency is measured: understand --enforce-eager flag handling and how the benchmark isolates decode steps from prefill.
Core Source Code Walkthrough
Below are real excerpts from vllm-continuum that implement the concepts you measured. Read them with your benchmark numbers open in another tab — the connection between code and metric becomes obvious.
vllm/v1/worker/gpu_model_runner.py:24 — CUDAGraphWrapper
from vllm.compilation.cuda_graph import CUDAGraphWrapper
from vllm.v1.cudagraph_dispatcher import CudagraphDispatcher
# ...
if (self.compilation_config.cudagraph_mode != CUDAGraphMode.NONE):
    self.cudagraph_dispatcher = CudagraphDispatcher(self.vllm_config)
vLLM captures one CUDA graph per (batch_size, seq_len) bucket during warmup. At inference, instead of launching ~100 kernels per layer with their associated CPU overhead, it replays the captured graph in one shot. The H200 result we measured (29% latency reduction) is exactly the eliminated kernel launch overhead. CudagraphDispatcher picks the right pre-captured graph based on the current batch shape.
Written Analysis — Reference Answers
Below are reference answers based on the real measurements collected on PACE H200/L40S. Use them as a starting point — your own write-up should add your hypotheses and any extra observations you noticed.
Q1: Why does CUDA graphs help more on H200 than L40S?
Observation: H200: eager 0.52s → CUDA graph 0.37s = 29% latency reduction. H200 serving: eager 707 tok/s → CUDA graph 800 tok/s (+13%). L40S: eager 2.87s → CUDA graph 2.85s — negligible improvement (<1%).
Mechanism — kernel launch overhead fraction: Every eager-mode forward pass launches ~200-300 CUDA kernels. Each kernel launch has ~5-10µs CPU overhead (driver submission, GPU scheduling). Total launch overhead per step: ~1-3ms. On H200, a full decode step takes only ~5ms at bs=1 — so ~2ms of launch overhead is 30-40% of total step time. Eliminating it with CUDA graphs saves 29% latency. On L40S, the same decode step takes ~22ms (slow HBM). The same ~2ms launch overhead is only 9% of step time — barely noticeable.
Q2: Cost and constraints of CUDA graphs
Why CUDA graphs can't be used for prefill: A CUDA graph captures a fixed sequence of kernel launches with fixed tensor shapes. Prefill input length varies per request (50 tokens vs 500 tokens = different GEMM shapes). You'd need a separate graph for every possible input length — infeasible. Decode, by contrast, always processes exactly 1 new token per sequence: GEMM shapes depend only on batch size (number of active sequences), which has a tractable discrete range (1 to 512).
Memory and warmup cost: vLLM captures graphs for batch sizes: 1, 2, 4, 8, 16, 32, 64, 128, 256, 512 (powers of 2). Each graph stores the full kernel launch sequence + tensor references: ~100-200MB per size, ~1GB total. Warmup at startup runs each size once to populate the graph — adds ~30-60 seconds to server startup time on H100/H200.
When to use --enforce-eager: (1) Debugging — CUDA graphs hide per-kernel errors and make stack traces opaque; eager mode gives exact Python-level tracebacks. (2) VRAM-constrained deployments — if the ~1GB graph overhead would cause OOM on a small GPU (e.g., RTX 3090 24GB serving a large model). (3) Models with dynamic control flow — variable-depth models (e.g., early-exit architectures) can't be captured in a static graph.
Q3: How does vLLM handle dynamic batch sizes with CUDA graphs?
Padding strategy: The current batch size is rounded up to the next captured power-of-2. If 37 sequences are active, vLLM pads to 64 (adds 27 dummy sequences with zero attention masks). The graph for bs=64 is replayed. The dummy sequences waste some compute (27 forward passes that are masked out) but this is offset by eliminating kernel launch overhead. At \(37/64 = 58\%\) utilization, the waste is \(\sim 42\%\) of extra compute — still worth it for the 29% latency win on H200.