Balancing and Beyond: Communication-Centric Optimizations in Expert Parallelism平衡與超越:專家平行中以通訊為核心的最佳化
After reading, you can explain why skewed experts and duplicate copies slow the expert-parallel all-to-all of MoE serving, and how balancing, one copy per host and per-expert overlap cut it.讀完後,你能說明為什麼偏斜的專家負載與重複的複本會拖慢 MoE 服務中的專家平行 all-to-all,以及平衡、每台主機一份複本與逐專家重疊如何把它縮短。
This paper is about serving MoE models (inference), not training, but it studies the same expert-parallel all-to-all that training runs. In Alibaba Cloud's production traces the busiest expert received about 8× the median expert's tokens in a sampled layer (read from the paper's Figure 2a), so the GPUs with hot experts, and the NICs they share, became stragglers. DeepEP, the de-facto EP library, also sent one copy of a token per destination expert, even when several experts sat on one remote host. The paper balances first, with NIC-aware placement and per-step expert swaps inside each host. Then it sends one copy per remote host through the same-index GPU there, and overlaps groups of experts instead of half-batches. At EP32 on H20 GPUs, the relay cut communication time from 190.21 to 134.00 µs (−29.6%) against DeepEP's default.
這篇論文談的是 MoE 模型的服務(推論),不是訓練;但它研究的專家平行 all-to-all,與訓練所跑的是同一種。在阿里雲的生產流量紀錄中,在抽樣的一層中,最忙的專家收到的 token 約是中位數專家的 8 倍(從論文 Figure 2a 讀出),因此持有熱門專家的 GPU,以及它們共用的 NIC,都成了 straggler。事實標準的 EP 函式庫 DeepEP 還會為每個目的專家各送一份 token 複本,即使好幾個專家位在同一台遠端主機上。論文先做平衡:考慮 NIC 的專家配置,以及每一步在主機內交換專家。接著經由遠端主機上同編號的 GPU,每台主機只送一份複本,並以專家群組而非半個批次來做重疊。在 H20 GPU 的 EP32 上,這種轉送讓通訊時間從 DeepEP 預設模式的 190.21 µs 降到 134.00 µs(−29.6%)。
1. Where this paper sits1. 這篇論文的位置
Section 3.7 ("Expert parallelism: all-to-all") sends each token to its top- experts and counts leaving a GPU per MoE layer and direction. It also warns that EP traffic crosses rails ("Why EP breaks the rail assumption"): the rail-only paper measured the NVLink detour to the right rail as an 8.2–11.2% slowdown.
第 3.7 節(「專家平行:all-to-all」)把每個 token 送到它的 top- 個專家,並算出每個 MoE 層每個方向離開一顆 GPU 的位元組為 。它也提醒 EP 流量會跨 rail(「為什麼 EP 打破 rail 假設」):rail-only 論文量到,經 NVLink 繞到正確的 rail 會讓 all-to-all 慢 8.2–11.2%。
The formula hides two facts that this paper measures. A synchronous step waits for the GPU with the most tokens, not for the mean. And when several of a token's experts sit on one remote host, one network copy is enough.
這個公式藏住了本論文量到的兩件事。同步的步驟要等 token 最多的那顆 GPU,而不是平均值。而當一個 token 的好幾個專家位在同一台遠端主機時,一份網路複本就夠了。
A serving paper. All results are decode-time inference of DeepSeek-R1 and Qwen3-Coder, at up to 128 tokens per GPU, and the authors train with a different library. Three lessons carry over to training, which runs the same dispatch and combine four times per MoE layer per step: the hottest expert and its NIC set the time, NIC bytes can be de-duplicated per host, and a relay through the same-index GPU keeps traffic on its rail. Two lessons do not carry over directly. The overlap result needs small expert GEMMs that are bound by memory bandwidth. Per-step migration fits a budget of about 100 µs per layer, and a training expert also carries its gradient and optimizer state.
一篇服務論文。所有結果都是 DeepSeek-R1 與 Qwen3-Coder 在 decode 階段的推論,每顆 GPU 最多 128 個 token,而作者訓練時用的是另一套函式庫。有三個教訓可以帶到訓練,因為訓練在每個 MoE 層每一步都跑四次同樣的分派與合併:最熱的專家與它的 NIC 決定耗時;NIC 位元組可以按主機去重;經同編號 GPU 轉送能讓流量留在自己的 rail 上。有兩個教訓不能直接搬過去。重疊的結論需要受記憶體頻寬限制的小型專家 GEMM。逐步遷移專家符合每層約 100 µs 的預算,而訓練中的專家還帶著它的梯度與最佳化器狀態。
The paper's EP library (which it calls EPIC; an unrelated SIGCOMM 2026 paper on in-network collectives uses the same name) is called the library below. It is built on DeepEP.
論文的 EP 函式庫(論文稱之為 EPIC;另一篇無關的 SIGCOMM 2026 網內集體通訊論文也用同一個名字)下文一律稱為該函式庫。它建在 DeepEP 之上。
2. The problem, measured2. 問題,用量測說話
Skewed experts. The imbalance ratio of a layer is the largest number of tokens that any expert receives, divided by the layer mean. Over 500 decode steps from four production traces of DeepSeek-R1, the paper's Figure 2(b) (below) shows it between about 2.6 and 15 in three traces and up to about 20 in the fourth. The paper's text gives 2.5–10.6 and a busiest expert at 74× the mean; the 2.5 fits its plots, but 10.6 and 74× do not, so this page uses the values read from the figure.
專家負載偏斜。一層的不平衡比(imbalance ratio)是任一專家收到的最多 token 數除以該層平均。在四份 DeepSeek-R1 生產流量紀錄的 500 個 decode 步驟中,論文的 Figure 2(b)(下圖)顯示它在三份紀錄裡約介於 2.6 到 15,第四份最高約到 20。論文正文寫的是 2.5–10.6,以及最忙專家達平均的 74 倍;其中 2.5 與它自己的圖相符,但 10.6 與 74 倍都不符,所以本頁採用從圖上讀出的數值。
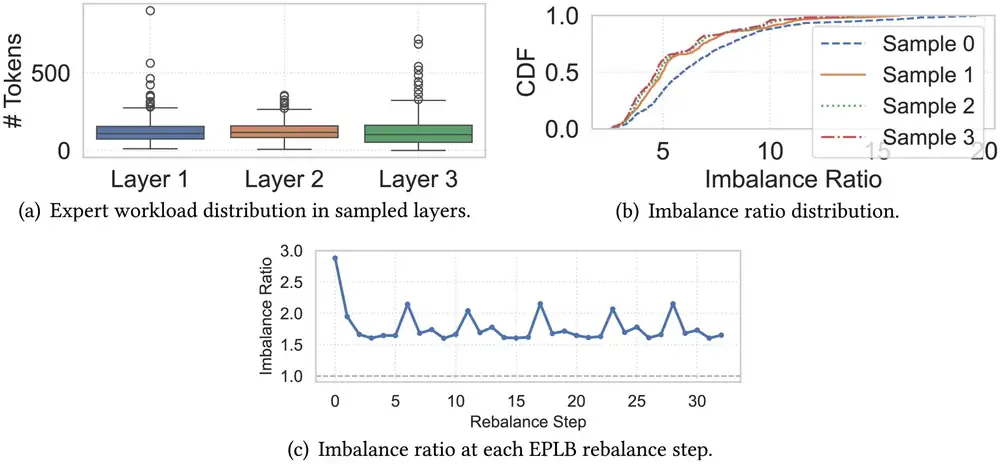
Periodic rebalancing is not enough. EPLB (expert-parallel load balancing) moves or replicates experts from past load. With a rebalance every 200 steps, the ratio right after each one was still 1.6–2.9×: routing drifts faster than the statistics. EPLB also ignores topology. On H20 hosts, where two GPUs share a NIC, it can put the two heaviest experts behind one NIC.
週期性重新平衡不夠。EPLB(專家平行負載平衡)依過去的負載搬移或複製專家。每 200 步重新平衡一次時,每次之後的不平衡比仍有 1.6–2.9 倍:路由變化得比統計資料快。EPLB 也不看拓樸。在兩顆 GPU 共用一張 NIC 的 H20 主機上,它可能把最重的兩個專家放在同一張 NIC 後面。
The cost. Table 1 of the paper profiles DeepSeek-R1 at EP16 on 16 H20 GPUs without the paper's fixes (Figure 1). The hot GPU spends longer in dispatch and GEMM; the cold GPU finishes early and then waits inside combine. The slowest dispatch-plus-combine path grows from 273.3 µs (balanced, theoretical) to 450.3 µs, and TPOT, the time per output token, from 54.2 to 65.2 ms.
代價。論文 Table 1 量測了 DeepSeek-R1 在 16 顆 H20 GPU、EP16、未套用論文修正時的情形(圖 1)。熱 GPU 在分派與 GEMM 上花得較久;冷 GPU 提早做完,然後在合併裡等待。最慢的分派加合併路徑從 273.3 µs(平衡、理論值)增加到 450.3 µs,TPOT(每個輸出 token 的時間)從 54.2 ms 增加到 65.2 ms。
Communication after balancing. DeepEP was built for H800 hosts with eight 400 Gb/s NICs. Alibaba's H20 hosts have four, so the network is the bottleneck, and one copy per expert wastes it. DeepEP's two-batch overlap also loses at small batches (section 3.3), its buffers take about 1.1 GB extra per GPU for DeepSeek-R1 at batch 128, and one failed peer fails the whole round.
平衡之後的通訊。DeepEP 是為配有八張 400 Gb/s NIC 的 H800 主機打造的。阿里雲的 H20 主機只有四張,所以網路是瓶頸,而每個專家一份複本正是在浪費它。DeepEP 的雙批次重疊在小批次時也會輸(第 3.3 節);它的緩衝區在 DeepSeek-R1、批次 128 時每顆 GPU 要多用約 1.1 GB;而只要一個對等端故障,整輪通訊就失敗。
3. The design3. 設計
First remove the imbalance, because a straggler hides any gain in communication. Then make the communication efficient.
先消除不平衡,因為 straggler 會吃掉任何通訊上的改進。再讓通訊有效率。
3.1 Balance GPUs and NICs, then fix the drift inside each host3.1 平衡 GPU 與 NIC,再在每台主機內修正漂移
The paper calls expert placement NP-hard, without a proof, and splits it into two steps (Figure 2). Periodically, three greedy passes run on the tokens of each expert in the last window. They choose replica counts that keep small, put the slots on GPUs heaviest first, and map GPUs to NIC positions so that hot experts sit behind different NICs.
論文稱專家配置為 NP-hard(未給證明),並把它拆成兩個步驟(圖 2)。週期性地,依上一段期間每個專家的 token 數 執行三輪貪婪演算法。它們選擇副本數 ,讓 保持很小;把槽位由重到輕放到各 GPU;再把 GPU 對應到 NIC 位置,讓熱門專家落在不同的 NIC 後面。
Every step, inside the dispatch kernel, an AllReduce of per-GPU token counts gives the load of each GPU. It hides behind the BF16-to-FP8 conversion that dispatch needs anyway. In each host the heaviest GPU pairs with the lightest, the second-heaviest with the second-lightest, and so on. Each pair takes the one expert swap that most lowers its maximum, but only if the maximum falls by at least tokens:
每一步,在分派 kernel 之內,一次對各 GPU token 數的 AllReduce 得到每顆 GPU 的負載 。它藏在分派本來就要做的 BF16 轉 FP8 之後。每台主機內,最重的 GPU 與最輕的配對,第二重的與第二輕的配對,依此類推。每一對採用最能降低其最大值的那一次專家交換,但只有在最大值至少降低 個 token 時才採用:
Here is the size of the expert's weights, the link bandwidth and the profiled compute time per token.
其中 是專家權重的大小, 是鏈路頻寬, 是實測的每個 token 計算時間。
Why only inside a host. TPOT budgets are of the order of 10 ms, so a layer has a budget of the order of 100 µs. By the paper's estimate, one 42 MB DeepSeek-R1 expert moves in 92 µs over NVLink on H20 (210 µs on H800), but needs 1.7 ms over RDMA (0.8 ms on H800). Only the NVLink copy fits, so swaps stay inside the host.
為什麼只在主機內。TPOT 的預算約在 10 ms 的量級,所以一層的預算約在 100 µs 的量級。依論文的估算,一個 42 MB 的 DeepSeek-R1 專家在 H20 上經 NVLink 要 92 µs(H800 為 210 µs),經 RDMA 則要 1.7 ms(H800 為 0.8 ms)。只有 NVLink 複製放得進預算,所以交換只在主機內進行。
3.2 One network copy per host3.2 每台主機只送一份網路複本
The library has three transport modes, drawn below in Figure 8 of the paper.
該函式庫有三種傳輸模式,論文圖 8(見下)畫出了它們。
- Mode 0, IBGDA-direct. Every copy, even inside a host, goes out through a NIC as RDMA that the GPU posts itself (IBGDA, InfiniBand GPUDirect Async). It uses no streaming multiprocessors (SMs).模式 0,IBGDA 直送。每份複本,即使在主機內,也都以 GPU 自己發出的 RDMA 經 NIC 送出(IBGDA,InfiniBand GPUDirect Async)。它不使用串流多處理器(SM)。
- Mode 1, DeepEP's default. NVLink inside a host, IBGDA across, one copy per destination expert.模式 1,DeepEP 的預設。主機內走 NVLink、主機間走 IBGDA,每個目的專家一份複本。
- Mode 2, relay and de-redundancy. Dispatch crosses to the same-index GPU of the remote host and fans out over NVLink, so each host receives only one network copy (de-redundancy). Combine sums on that GPU before it sends back. The relay and the sums use SMs.模式 2,轉送加去重。分派跨網路送到遠端主機上同編號的 GPU,再經 NVLink 散發,所以每台主機只收到一份網路複本(去重,de-redundancy)。合併時先在那顆 GPU 上加總,再送回。轉送與加總都會用到 SM。
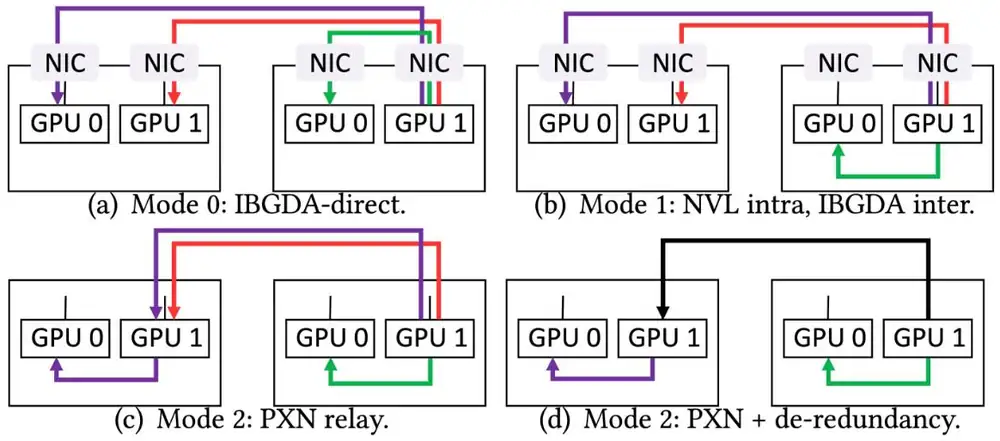
Same-index GPUs share a rail, so the relayed copy needs no spine. It is the rail-only paper's NVLink detour, moved to the receiving host: there the detour cost 8.2–11.2%; combined with de-duplication, it saves NIC bytes.
同編號的 GPU 共用一條 rail,所以轉送的複本不需要 spine。這就是 rail-only 論文中的 NVLink 繞路,只是移到接收端主機:在那裡繞路的代價是 8.2–11.2%;加上去重後,它省下 NIC 位元組。
How many bytes it saves. A simple model (ours, not the paper's): the router picks distinct experts uniformly, and the experts are spread evenly over hosts. Mode 1 sends one network copy per remote expert, on average . Mode 2 sends one per remote host that holds at least one of the experts:
能省多少位元組。一個簡單的模型(我們的,不是論文的):路由器均勻地挑出 個不同的專家, 個專家平均分布在 台主機上。模式 1 為每個遠端專家送一份網路複本,平均 。模式 2 為每台至少持有其中一個專家的遠端主機送一份:
For DeepSeek-R1 (, ) at EP32, four hosts, and : 55% fewer network bytes. The cut shrinks as hosts are added, and so does the measured one: −34.3%, −29.6% and −17.7% at EP16, EP32 and EP64. Time falls less than bytes, because it also contains latency, synchronization and the NVLink fan-out. Panel 1 shows both.
以 DeepSeek-R1(、)在 EP32、四台主機為例,、:網路位元組少 55%。主機越多,節省越少,實測的降幅也一樣:EP16、EP32、EP64 分別為 −34.3%、−29.6%、−17.7%。時間降得比位元組少,因為它還包含延遲、同步與 NVLink 散發。面板 1 同時顯示兩者。
3.3 Overlap along experts, not along the batch3.3 沿專家重疊,而非沿批次
Two-batch overlap (TBO) lets one half-batch communicate while the other computes. At decode batch sizes, expert GEMMs are bound by memory bandwidth: they mostly load weights, and each half loads them again. With the paper's measured kernel times from Table 2 (a Qwen3 model that it calls "Qwen3++", EP16, H20):
雙批次重疊(TBO)讓一個半批在通訊時,另一個半批在計算。在 decode 的批次大小下,專家 GEMM 受記憶體頻寬限制:時間主要花在載入權重,而每一半都要再載入一次。以下用論文 Table 2 的實測 kernel 時間計算(論文稱為「Qwen3++」的某個 Qwen3 模型,EP16,H20):
| Question問題 | Calculation算式 | Result結果 |
|---|---|---|
| No overlap, batch 16: attention, dispatch, GEMM, combine不重疊,批次 16:注意力、分派、GEMM、合併 | µs | |
| TBO computation: two batch-8 halvesTBO 的計算:兩個批次 8 的半批 | µs | |
| TBO communication: the most that overlap can hideTBO 的通訊:重疊最多能藏住的量 | µs | |
| Computation that the split adds切分多出的計算 | µs |
Even with all communication hidden, TBO needs 404 µs, 44 µs more than without overlap. Per-expert overlap (PEO) splits the experts into 2 or 4 groups instead. Each group is dispatched, computed and combined while the next group's dispatch runs, and every weight loads once (Figure 4). In the paper's GroupedGEMM test on H20, half-batches added 30–99% compute time; expert groups added 1–8% at moderate and large token counts.
即使所有通訊都被藏住,TBO 也要 404 µs,比不重疊多 44 µs。逐專家重疊(PEO)則改把專家分成 2 或 4 組。每組被分派、計算、合併時,下一組的分派正在進行,而且每份權重只載入一次(圖 4)。在論文 H20 上的 GroupedGEMM 測試中,半批次讓計算時間多 30–99%;專家分組在中等與較大的 token 數時只多 1–8%。
Overlap also changes the best transport. Mode 2 has the lowest communication time, but with overlap on (the paper does not say which kind) the SM-free Mode 0 gave the lowest TPOT, because the GEMMs keep every SM. A table built per deployment picks mode and overlap for each batch size.
重疊也會改變最佳的傳輸模式。模式 2 的通訊時間最短,但開啟重疊時(論文沒有說是哪一種),不用 SM 的模式 0 讓 TPOT 最低,因為 GEMM 保有全部的 SM。每個部署各建一張表,為每個批次大小挑選模式與重疊方式。
3.4 Memory and failures3.4 記憶體與故障
DeepEP double-buffers its receive space. The library keeps one buffer plus a "consumed" flag (half the memory, under 10 µs slower) and sizes combine buffers for batch × results instead of batch × , 32× smaller for DeepSeek-R1. A silent peer is marked in a bitmask in GPU memory and skipped for the rest of the step. Lost experts return from replicas or, layer by layer, from a weight cache in host memory.
DeepEP 的接收空間是雙緩衝。該函式庫只留一個緩衝區,外加一個「已取用」旗標(記憶體減半,只慢不到 10 µs),並把合併緩衝區依批次 × 個結果配置,而非批次 × ,DeepSeek-R1 因此小 32 倍。沒有回應的對等端會被標記在 GPU 記憶體中的位元遮罩裡,在同一步剩下的部分被跳過。遺失的專家從副本復原,或從主機記憶體中的權重快取逐層重建。
4. Implementation4. 實作
The library extends DeepEP and serves the SGLang and vLLM engines; Alibaba moved from NCCL's all-to-all to DeepEP in early 2025. The paper says that over the past year the library ran inference on O(10K) NVIDIA, AMD and in-house GPUs. Parts are open source, and no line count is given. Even the published version (pp. 550–563) still omits the code link "for blind review".
該函式庫擴充 DeepEP,供 SGLang 與 vLLM 推論引擎使用;阿里雲在 2025 年初從 NCCL 的 all-to-all 改用 DeepEP。論文說,過去一年該函式庫在 O(10K) 顆 NVIDIA、AMD 與自研 GPU 上支援推論。部分程式已開源,論文沒有給出程式碼行數。即使正式出版的版本(第 550–563 頁)也仍以「雙盲審查」為由省略程式碼連結。
5. What was measured5. 量到了什麼
The controlled runs used H20 servers (450 GB/s NVLink per GPU, four 400 Gb/s NICs per eight GPUs) and H800 servers (200 GB/s NVLink, eight NICs), at EP8 to EP64. The models were DeepSeek-R1 (256 experts, top-8) and Qwen3-Coder (160 experts, top-8) in FP8, with requests drawn from production traffic. The baseline was DeepEP Mode 1 with EPLB and TBO, inside vLLM. The paper reports no run counts, and only Figure 18 (overlap) has error bars.
受控實驗使用 H20 伺服器(每顆 GPU 450 GB/s NVLink,每八顆 GPU 四張 400 Gb/s NIC)與 H800 伺服器(200 GB/s NVLink,八張 NIC),EP 從 8 到 64。模型是 FP8 的 DeepSeek-R1(256 個專家、top-8)與 Qwen3-Coder(160 個專家、top-8),請求取自生產流量。基準是在 vLLM 中搭配 EPLB 與 TBO 的 DeepEP 模式 1。論文沒有報告執行次數,只有論文圖 18(重疊)標有誤差範圍。
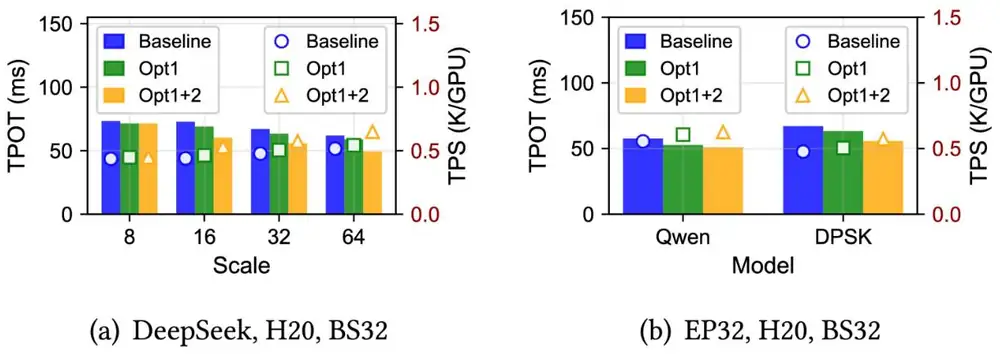
End to end, Figure 12 of the paper compares DeepEP with EPLB (Baseline), the balancing of section 3.1 (Opt1) and all optimizations (Opt1+2). At 8 GPUs, where all traffic stays on NVLink, Opt1+2 adds nothing over Opt1; from 16 GPUs on, it does. The text states no values for these bars.
在端到端層面,論文圖 12 比較了搭配 EPLB 的 DeepEP(Baseline)、第 3.1 節的平衡(Opt1)與全部最佳化(Opt1+2)。在 8 顆 GPU、所有流量都留在 NVLink 上時,Opt1+2 比 Opt1 沒有多出改進;從 16 顆 GPU 起才有。正文沒有給出這些長條的數值。
Per mechanism:
各機制的結果:
| Mechanism機制 | Setup設定 | Measured實測結果 |
|---|---|---|
| NIC-aware EPLB考慮 NIC 的 EPLB | Qwen3-Coder, EP32, H20, batch 32 and 64Qwen3-Coder,EP32,H20,批次 32 與 64 | Dispatch + combine −28.2% to −31.9% vs random placement, −5.0% to −11.8% vs compute-only EPLB分派 + 合併比隨機配置少 28.2%–31.9%,比只看計算的 EPLB 少 5.0%–11.8% |
| Per-step swaps逐步交換 | Qwen3-Coder, H20, batch 32Qwen3-Coder,H20,批次 32 | Communication 386 → 278 µs (EP16), 585 → 476 (EP32), 790 → 607 (EP64); TPOT 74.0 → 70.1, 77.4 → 70.5, 90.5 → 77.4 ms; −30.7% to −34.5% communication at imbalance ratios 5.9–9.2通訊 386 → 278 µs(EP16)、585 → 476(EP32)、790 → 607(EP64);TPOT 74.0 → 70.1、77.4 → 70.5、90.5 → 77.4 ms;不平衡比 5.9–9.2 時通訊少 30.7%–34.5% |
| Transport modes傳輸模式 | DeepSeek-R1, EP32, H20, batch 32DeepSeek-R1,EP32,H20,批次 32 | Mode 0 / 1 / 2: 235.48 / 190.21 / 134.00 µs模式 0 / 1 / 2:235.48 / 190.21 / 134.00 µs |
| Mode 1 → 2, by EP size模式 1 → 2,依 EP 大小 | DeepSeek-R1, H20, batch 32DeepSeek-R1,H20,批次 32 | 148.66 → 97.69 µs (EP16), 214.50 → 176.52 µs (EP64); equal at EP8148.66 → 97.69 µs(EP16)、214.50 → 176.52 µs(EP64);EP8 時相同 |
| Mode 1 → 2 on H800H800 上的模式 1 → 2 | EP32EP32 | DeepSeek-R1 131.78 → 125.33 µs (−4.9%); Qwen3-Coder 112.07 → 110.08 µs (−1.8%)DeepSeek-R1 131.78 → 125.33 µs(−4.9%);Qwen3-Coder 112.07 → 110.08 µs(−1.8%) |
| Rising skew偏斜升高 | DeepSeek-R1, EP32, H20, imbalance ratio 1 → 10DeepSeek-R1,EP32,H20,不平衡比 1 → 10 | Mode 1 316.84 → 823.14 µs; Mode 2 190.98 → 379.17 µs (text values; Figure 17(c) plots about 260 → 730 and 120 → 250)模式 1 316.84 → 823.14 µs;模式 2 190.98 → 379.17 µs(正文數值;論文圖 17(c) 畫出的約為 260 → 730 與 120 → 250) |
| Overlap重疊 | DeepSeek-R1, H20, batch DeepSeek-R1,H20,批次 | PEO TPOT 0.9–17.6% below TBO and 1.8–8.3% below no overlap (but 1.0% above it at EP32, batch 32); with overlap (EP32, batch 16–64), Mode 0 TPOT 2.2–3.3% below Mode 1PEO 的 TPOT 比 TBO 低 0.9–17.6%,比不重疊低 1.8–8.3%(但在 EP32、批次 32 時比不重疊高 1.0%);開啟重疊(EP32、批次 16–64)時,模式 0 的 TPOT 比模式 1 低 2.2–3.3% |
| Failure recovery故障復原 | Qwen3-Coder, 1 to 7 nodes lostQwen3-Coder,失去 1 到 7 個節點 | Exposed stall 12.8–24.1 s with reload from disk, 219–371 ms from the host-memory cache; detection < 1 ms從磁碟重載時暴露的停頓為 12.8–24.1 s,從主機記憶體快取則為 219–371 ms;偵測 < 1 ms |
Production claims. Without configurations or baselines, the paper reports for its fleet up to 40% less communication time and 21% lower TPOT from relay and de-redundancy on H20, up to 17.6% lower TPOT from PEO, and up to 27% more tokens per second. For balancing it claims an imbalance ratio about 40% below plain EPLB and 10–18% lower TPOT. Read these as the paper's claims, not as controlled measurements.
生產環境的宣稱。論文沒有說明設定或基準,就為其機群報告:在 H20 上,轉送與去重讓通訊時間最多少 40%、TPOT 最多低 21%;PEO 讓 TPOT 最多低 17.6%;每秒 token 數最多高 27%。對於平衡機制,它宣稱不平衡比比一般 EPLB 低約 40%,TPOT 低 10–18%。請把這些當成論文的宣稱,而不是受控量測。
6. Limits and open questions6. 限制與未解的問題
- Inference only. Decode batches of at most 128 tokens make expert GEMMs memory-bound. Training micro-batches have thousands of tokens and compute-bound GEMMs, so the TBO verdict may reverse there.只有推論。最多 128 個 token 的 decode 批次讓專家 GEMM 受記憶體頻寬限制。訓練的 micro-batch 有數千個 token、GEMM 受計算限制,所以 TBO 的結論在那裡可能反轉。
- Evidence. No run counts, variance only in Figure 18, most bars carry no values, and the production figures have no configuration.證據。沒有執行次數,只有論文圖 18 有變異,大多數長條沒有標數值,生產環境的數字也沒有設定。
- No formal model. NP-hardness is asserted, the greedy passes have no bounds, and , , the timeouts and the policy table are not given.沒有形式化模型。NP-hard 只是斷言,貪婪步驟沒有界限,、、逾時與策略表的值也都沒有給出。
- Loose ends. The text announces four transport modes but numbers three (Figure 8 draws Mode 2 without and with de-redundancy); Table 2's model is "Qwen3++"; EPLB runs "every 10 minutes" in one place and every 200 steps in another.未收尾之處。正文說有四種傳輸模式,卻只編號三種(論文圖 8 把模式 2 分成不去重與去重兩種畫出);Table 2 的模型叫「Qwen3++」;EPLB 在一處是「每 10 分鐘」,另一處是每 200 步。
- Unstated details. The paper does not say whether the fabric is RoCE or InfiniBand, its tiers or its congestion control, nor what happens to tokens bound for a failed expert that had no replica.未說明的細節。論文沒有說明網路是 RoCE 還是 InfiniBand、有幾層、用哪種壅塞控制,也沒有說明送往故障且沒有副本之專家的 token 會怎樣。
7. How it connects7. 與其他內容的關聯
- Chapter 3, section 5: with de-redundancy the NIC carries one copy per remote host, not per expert, and the maximum load, not the mean, sets the time.第 3.7 節:有了去重,NIC 承載的是每台遠端主機一份而非每個專家一份;決定耗時的是最大負載,不是平均。
- Rail-only guided reading: the NVLink detour cost 8.2–11.2% there. With de-duplication it saved 29.6% on H20 here, but only 4.9% on H800, which has a NIC per GPU.Rail-only 論文導讀:在那裡 NVLink 繞路的代價是 8.2–11.2%。在這裡加上去重後,它在 H20 上省下 29.6%,但在每顆 GPU 都有一張 NIC 的 H800 上只省 4.9%。
- Alibaba HPN guided reading: on its rail-optimized tier 1, staying on a rail avoids the spine. The paper does not name its own fabric.Alibaba HPN 論文導讀:在它的 rail-optimized 第一層上,留在 rail 上就能避開 spine。論文沒有說明自己用的網路。
- Chapter 4, section 9.4, and the Theseus digest: Theseus measured a skewed all-to-all at up to 2.4× its uniform time and switches schedules; this library moves the experts instead.第 4 章第 9.4 節,以及 Theseus 導讀:Theseus 量到偏斜的 all-to-all 要花均勻負載時的最多 2.4 倍時間,並以切換排程因應;這個函式庫則改為搬動專家。
- This chapter's other digests: UBEP puts the EP group inside one superpod, where barriers and hop distance, not bytes, set the time. ByteScale and Attack of the Bubbles meet stragglers in training that the data and the links create.本章的其他導讀:UBEP 把 EP 群組放進一個 superpod,在那裡決定耗時的是 barrier 與跳數,而不是位元組。ByteScale 與 Attack of the Bubbles 處理的是訓練中由資料與鏈路造成的 straggler。
Key numbers關鍵數字
| Number | 數字 | Meaning (setup) | 意義(設定) |
|---|---|---|---|
| ≈ 8× | Busiest vs median expert, one sampled layer (read from Fig. 2a; the text's 74× is not supported by the plot) | 最忙專家相對中位數專家,抽樣的一層(從 Fig. 2a 讀出;正文的 74 倍與圖不符) | |
| ≈ 2.6–20 | Imbalance ratio over 500 steps of four production traces (read from Fig. 2b; the text says 2.5–10.6) | 四份生產流量紀錄、500 個步驟中的不平衡比(從 Fig. 2b 讀出;正文寫 2.5–10.6) | |
| 54.2 → 65.2 ms | TPOT, balanced theory vs real skew (DeepSeek-R1, EP16, 16 × H20) | TPOT,平衡理論值對實際偏斜(DeepSeek-R1,EP16,16 × H20) | |
| 134.00 µs | Mode 2 communication, against 190.21 µs in Mode 1 and 235.48 µs in Mode 0 (DeepSeek-R1, EP32, H20, batch 32) | 模式 2 的通訊時間,模式 1 為 190.21 µs、模式 0 為 235.48 µs(DeepSeek-R1,EP32,H20,批次 32) | |
| −29.6% | Mode 2 vs Mode 1 at EP32 on H20; −34.3% at EP16, −17.7% at EP64, −4.9% on H800 | H20 上 EP32 時模式 2 對模式 1;EP16 為 −34.3%、EP64 為 −17.7%、H800 為 −4.9% | |
| −18.6% to −28.0%−18.6% 至 −28.0% | Communication with per-step swaps (Qwen3-Coder, H20, EP16–64) | 逐步交換下的通訊(Qwen3-Coder,H20,EP16–64) | |
| 219–371 ms | Exposed recovery from the host-memory cache, against 12.8–24.1 s from disk (1–7 nodes lost) | 從主機記憶體快取復原所暴露的時間,從磁碟則為 12.8–24.1 s(失去 1–7 個節點) | |
| 40% / 21% / 27% | Production claims without configuration: communication / TPOT / tokens per second | 未附設定的生產環境宣稱:通訊 / TPOT / 每秒 token 數 |
Terms used on this page本頁用到的術語
- Imbalance ratio
- The most tokens any expert of a layer receives, divided by the layer mean.
- 一層中任一專家收到的最多 token 數,除以該層的平均。
- EPLB
- Periodic placement and replication of experts from past load.
- 依過去負載,週期性地配置與複製專家。
- IBGDA
- InfiniBand GPUDirect Async: the GPU posts RDMA requests itself, with no CPU proxy and no SMs.
- InfiniBand GPUDirect Async:GPU 自己發出 RDMA 請求,不需要 CPU 代理,也不用 SM。
- De-redundancy
- One network copy per remote host, fanned out over NVLink there.
- 每台遠端主機只送一份網路複本,再在那裡經 NVLink 散發。
- TBO / PEO
- Two-batch overlap splits the batch; per-expert overlap splits the experts into pipelined groups.
- 雙批次重疊切分批次;逐專家重疊把專家切成以管線執行的群組。
- TPOT
- Time per output token, the latency target of decoding.
- 每個輸出 token 的時間,decode 的延遲目標。