1. Problem Background

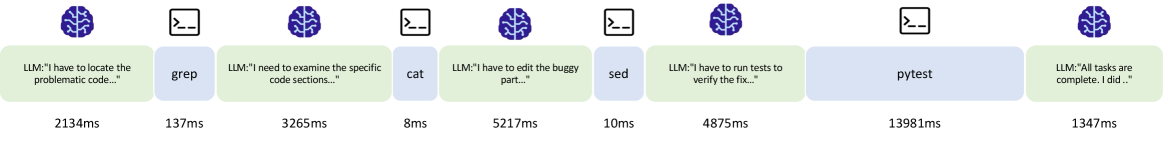
Traditional LLM serving (e.g., chatbot) follows a single request-response pattern: request arrives → generate tokens → finish → free KV cache. However, Agentic workloads (e.g., SWE-bench coding agent) are multi-turn:
During the period when the Agent is executing a tool call (which may take milliseconds to tens of seconds), the LLM is not using this job's KV cache, but if it is freed, the next turn requires re-prefilling (wasting GPU time). If it is not freed, it occupies precious VRAM.
Core Problem
During tool call execution, should the KV cache be retained? For how long?
- Retain (pin): zero prefill when re-entering next turn, but occupies VRAM
- Free: VRAM is available for other requests, but the next turn requires re-prefilling (expensive)

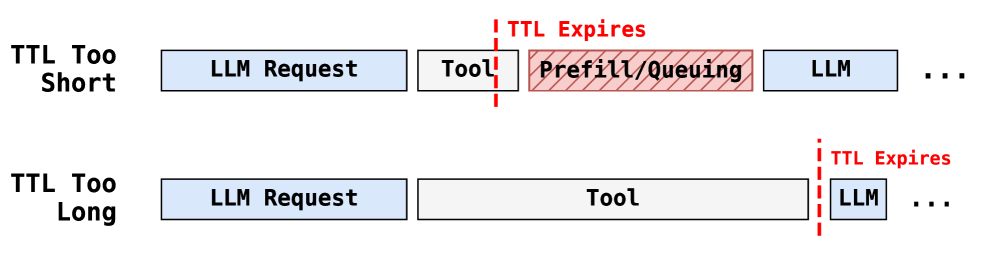
Continuum's approach: Dynamically determine the pin duration (TTL) based on historical tool call execution times.
2. Continuum Strategy Overview

Continuum adds SchedulingPolicy.CONTINUUM to vLLM's v1 scheduler.
The core logic is divided into three parts:
A. Tool Call Detection
After the LLM finishes generating tokens, parse the output for bash code blocks and extract the tool name (e.g., ls, git, pytest).
ToolCallParser.parse()
B. Execution Time Estimation (CDF)
Maintain historical execution times for each tool name and compute the moving average. Compare against a fixed threshold (2.0s) to decide whether to pin.
ToolCallEstimator.set_up_pin()
C. KV Cache Pin / Scheduling
Pinned requests occupy VRAM and are prioritized for scheduling in the next turn. After TTL expires, they are automatically unpinned + freed.
Scheduler.pin_request()ContinuumRequestQueue.peek_request()
Policy Definition
File: vllm/v1/core/sched/request_queue.py:18-22
class SchedulingPolicy(Enum):
    FCFS = "fcfs"         # Standard first-come-first-served (baseline)
    PRIORITY = "priority"  # Priority scheduling
    CONTINUUM = "continuum" # Continuum: tool-aware KV cache pin
Launch command: vllm serve MODEL --scheduling-policy continuum
3. Core Classes Overview
3.1 Repository Structure
Continuum modifies and adds files across multiple layers of the vLLM codebase. Files highlighted in red are new or heavily modified by Continuum:
'continuum' to SchedulerPolicy Literal--scheduling-policy CLI arg wiringjob_id, is_last_step, last_func_call, this_func_call fieldsjob_id, is_last_step, this_func_call to RequestContinuum_Recorder (event tracing) + ToolCallParser (regex) + ToolCallEstimator (exec time + pin decision)pin/unpin methods, Continuum branches in
schedule() / _free_blocks() / add_request()added
ContinuumRequestQueue (pinned priority + job-level FCFS)3.2 Core Classes
| Class | File | Responsibility |
|---|---|---|
Continuum_Recorder |
vllm/v1/core/estimate_with_func.py:12 |
Record scheduling event timestamps, export scheduler_timestamps |
ToolCallParser |
vllm/v1/core/estimate_with_func.py:64 |
Parse bash code blocks from LLM output, extract tool name |
ToolCallEstimator |
vllm/v1/core/estimate_with_func.py:94 |
Maintain tool execution time history, determine pin duration |
ContinuumRequestQueue |
vllm/v1/core/sched/request_queue.py:220 |
Scheduling queue: pinned job priority + job-level FCFS |
Scheduler MODIFIED |
vllm/v1/core/sched/scheduler.py |
pin/unpin, Continuum branches in schedule(), _free_blocks(), add_request() |
Request MODIFIED |
vllm/v1/request.py |
Added job_id, is_last_step, this_func_call, last_func_call fields |
4. Tool Call Parsing
File: vllm/v1/core/estimate_with_func.py:64-92
4.1 Parsing Flow
After the LLM finishes outputting tokens, ToolCallEstimator.request_finished() is called.
It does three things:
- Detokenize:
tokenizer.decode(request.output_token_ids)→ plain text - Parse:
ToolCallParser.parse(output_text)→ extract tool name using regex - Record: store in
job_to_history[job_id]
4.2 ToolCallParser Implementation
class ToolCallParser:
    def parse(self, text: str) -> Optional[str]:
        # Use the same regex as mini-swe-agent to parse bash code blocks
        actions = re.findall(r"```bash\s*\n(.*?)\n```", text, re.DOTALL)

        if len(actions) == 1:
            bash_action = actions[0].strip()
            words = bash_action.split()
            if words:
                return words[0]  # Return the first word = tool name

        return None
Examples
| LLM Output | Parse Result |
|---|---|
```bash\ngit status\n``` | "git" |
```bash\nfind . -name "*.py" | head -20\n``` | "find" |
```bash\npytest tests/ -x -v\n``` | "pytest" |
| (no bash block) | None |
grep) — a fast grep pattern file vs a slow grep -rn pattern / — are treated as the same tool and share the same average execution time.
4.3 Complete request_finished() Flow
# estimate_with_func.py:177-205
def request_finished(self, request: Request) -> None:
    this_func_call = None

    if self.tokenizer is not None and len(request.output_token_ids) > 0:
        # 1. Detokenize
        output_text = self.tokenizer.decode(
            request.output_token_ids, skip_special_tokens=True
        )
        # 2. Parse tool call
        this_func_call = self.parser.parse(output_text)

    # 3. Store in request and history
    request.this_func_call = this_func_call
    self.job_to_history[request.job_id].append({
        "departure_time": time.time(),
        "func_call": request.this_func_call
    })
5. CDF Time Estimation
File: vllm/v1/core/estimate_with_func.py:94-159
5.1 Data Structures
class ToolCallEstimator:
    def __init__(self, ...):
        # tool name → average execution time (seconds)
        self.func_call_to_exec_time: dict[str, float] = {}

        # tool name → all historical execution time samples
        self.record_func_call_to_exec_time: dict[str, list[float]] = {}

        # job_id → event sequence [{arrival_time, departure_time, func_call}, ...]
        self.job_to_history: dict[str, list[dict]] = {}
5.2 Execution Time Update
When a job's tool call finishes executing and re-enters the scheduler:
# estimate_with_func.py:136-147
def update_func_call_exec_time(self, job_id: str) -> None:
    # Get the last departure_time and func_call from history
    last_departure_time = self.job_to_history[job_id][-1]["departure_time"]
    func = self.job_to_history[job_id][-1]["func_call"]

    # exec_time = current time - last departure
    exec_time = time.time() - last_departure_time

    # Accumulate to historical samples
    self.record_func_call_to_exec_time[func].append(exec_time)

    # Update moving average
    self.func_call_to_exec_time[func] = (
        sum(self.record_func_call_to_exec_time[func])
        / len(self.record_func_call_to_exec_time[func])
    )
exec_time Computation Timing
5.3 Pin Decision
Fixed threshold: FIXED_THRESHOLD_CONTINUUM = 2.0 seconds
# estimate_with_func.py:150-159
def set_up_pin(self, request: Request) -> float:
    if request.this_func_call is None:
        return 0  # No tool call detected → do not pin

    this_func_call_exec_time = self.get_func_call_exec_time(request.this_func_call) or 0.0

    if this_func_call_exec_time > FIXED_THRESHOLD_CONTINUUM:
        return 0     # Estimated exec time > 2s → do not pin (too slow, not worth occupying VRAM)

    return FIXED_THRESHOLD_CONTINUUM  # Estimated ≤ 2s → pin for 2 seconds
Pin Decision Logic Table
| Condition | Return Value | Effect |
|---|---|---|
this_func_call is None |
0 |
No tool call detected → immediately free KV cache |
| Historical average exec_time > 2.0s | 0 |
Tool is too slow → immediately free KV cache |
| Historical average exec_time ≤ 2.0s | 2.0 |
Tool is fast enough → pin KV cache for 2 seconds |
| First time seeing this tool (no history) | 2.0 |
Default exec_time = 0 → pin for 2 seconds (optimistic strategy) |
6. Pin / TTL Mechanism
The Pin/TTL mechanism is the heart of Continuum. It answers: after a request finishes generating tokens, should its KV cache blocks be kept or freed?
6.1 The Big Picture: 3 Possible Outcomes
When a request finishes, _free_blocks() makes a decision:
Request finishes token generation
_free_blocks()
Checks: is_last_step? → detected tool call? → exec_time ≤ 2s?
PIN (2s TTL)
Tool detected & exec ≤ 2s & not last step
→ skip free(), blocks stay in VRAM
FREE immediately
No tool / exec > 2s / is_last_step
→ free(), blocks return to pool
UNPIN later
Was pinned, job didn't return in time
→ TTL expires → free blocks
6.2 Pin/Unpin Timeline
Two scenarios showing what happens to KV cache blocks:
Happy path: Tool returns within TTL
Slow tool: TTL expires before tool returns
6.3 Pin Implementation
File: vllm/v1/core/sched/scheduler.py:237-239
def pin_request(self, request: Request, length_of_pin: float) -> None:
    self.continuum_recorder.request_pinned(request)
    self.pinned_requests.append((request, time.time() + length_of_pin))
    # pinned_requests: list[(Request, end_time)]
    # After this, _free_blocks() returns → free() is SKIPPED → ref_cnt stays > 0
6.4 TTL Expiry Check
Called at the beginning of every scheduling step:
# vllm/v1/core/sched/scheduler.py:248-256
def unpin_requests_regular(self) -> None:
    waiting_job_ids = [req.job_id for req in self.waiting]

    for request, end_time in self.pinned_requests:
        if request.job_id not in waiting_job_ids and time.time() >= end_time:
            self.unpin_request(request, end_time)
Keep pin (don't unpin)
job_id IN waiting_job_ids — job already came back! Its KV cache is about to be used.
Unpin (free blocks)
job_id NOT in waiting AND TTL expired — tool taking too long, free VRAM.
6.5 Unpin Implementation
# vllm/v1/core/sched/scheduler.py:241-244
def unpin_request(self, request: Request, end_time: float) -> None:
    self.pinned_requests.remove((request, end_time))   # Remove from list
    self.continuum_recorder.request_unpinned(request)   # Record event
    self.kv_cache_manager.free(request)                 # ref_cnt -= 1 → blocks return to free queue
6.6 _free_blocks() — The Decision Point
This function runs when a request finishes. It decides pin or free:
# vllm/v1/core/sched/scheduler.py:1349-1370
def _free_blocks(self, request: Request):
    # Step 1: Unpin previous pin for same job_id
    for req, end_time in self.pinned_requests:
        if req.job_id == request.job_id:
            self.unpin_request(req, end_time)

    # Step 2: Decide whether to pin
    if self.policy == SchedulingPolicy.CONTINUUM and not request.is_last_step:
        length_of_pin = self.tool_call_estimator.set_up_pin(request)

        if length_of_pin > 0.01:
            self.pin_request(request, length_of_pin)
            del self.requests[request.request_id]
            return           # ← PIN: skip free()

    # Step 3: Normal free
    self.kv_cache_manager.free(request)
del self.requests[request.request_id]7. ContinuumRequestQueue Scheduling Queue
File: vllm/v1/core/sched/request_queue.py:220-339
Continuum does not use the standard FCFS queue, but instead uses ContinuumRequestQueue.
Scheduling priority: Pinned jobs first → otherwise job-level FCFS.
7.1 peek_request() — Core Scheduling Logic
# request_queue.py:241-273
def peek_request(self, pinned_requests, kv_cache_manager, connector) -> Request:
    pinned_job_ids = {req.job_id for req, _ in pinned_requests}

    # === Priority 1: Pinned request (KV cache still in VRAM) ===
    earliest_request = None
    earliest_entry_time = float('inf')
    for request in self:
        if request.job_id in pinned_job_ids:
            job_entry_time = self.job_id_first_entry_time.get(request.job_id)
            if job_entry_time < earliest_entry_time:
                earliest_entry_time = job_entry_time
                earliest_request = request
    if earliest_request is not None:
        return earliest_request   # Has pinned job → schedule it first

    # === Priority 2: Job-level FCFS ===
    # Select the request whose job_id_first_entry_time is earliest
    earliest_request = None
    earliest_entry_time = float('inf')
    for request in self:
        job_entry_time = self.job_id_first_entry_time.get(request.job_id)
        if job_entry_time < earliest_entry_time:
            earliest_entry_time = job_entry_time
            earliest_request = request
    return earliest_request
Why Job-level FCFS?
A job enters and exits the scheduler multiple times (re-entering after each tool call turn). If request-level FCFS were used, newly arrived requests would be placed far back in the queue, which is unfair to older jobs. Job-level FCFS orders by the time the job first entered, ensuring long-term fairness.
7.2 add_request()
def add_request(self, request: Request) -> None:
    # Record the first appearance time of each job_id
    if request.job_id not in self.job_id_first_entry_time:
        self.job_id_first_entry_time[request.job_id] = request.arrival_time
    self.append(request)
8. Eviction (Preemption) Logic
File: vllm/v1/core/sched/scheduler.py:195-234, 359-407
When a new request to be scheduled needs KV blocks but VRAM is insufficient, an existing request must be evicted (preempted).
8.1 Trigger Condition
# scheduler.py:359
new_blocks = self.kv_cache_manager.allocate_slots(request, num_new_tokens, ...)
if new_blocks is None:
    # Cannot allocate → need to evict
8.2 Eviction Priority
# scheduler.py:195-234
def pop_running_request_based_on_last_step(self, request) -> (Request, bool):

    # Case A: Only 1 running request → can only evict from pinned list
    if len(self.running) <= 1:
        # Select the one with latest pin end_time (retained longest, least urgent)
        return (latest_pin_end_request, True)  # True = is_unpin

    # Case B: Multiple running → select non-last_step with latest entry_time
    for req in self.running:
        if not req.is_last_step and job_entry_time > latest:
            latest_request = req
    if latest_request:
        return (latest_request, False)

    # Case C: All are last_step → can only select the latest one
    return (latest_request, False)
Eviction Priority Summary
| Priority | Eviction Target | Reason |
|---|---|---|
| 1 (evicted first) | Running with is_last_step=False and latest entry_time |
Not the last step = more tool calls ahead, can retry later |
| 2 | Running with latest entry_time (regardless of is_last_step) | Last resort |
| 3 (only 1 running) | Pinned list entry with latest end_time | Reclaim VRAM from pin |
8.3 After Eviction
# scheduler.py:391-403
self.kv_cache_manager.free(preempted_req)      # Free KV blocks
self.encoder_cache_manager.free(preempted_req)

if is_unpin:
    pass  # Evicted from pinned → do not put back in waiting (job is executing tool call externally)
else:
    preempted_req.status = RequestStatus.PREEMPTED
    preempted_req.num_computed_tokens = 0    # Reset to zero → requires re-prefill next time
    self.waiting.prepend_request(preempted_req) # Put back at the front of the waiting queue
9. Complete Request Lifecycle
Client (mini-swe-agent)
Sends API request with job_id + is_last_step via extra_body
Scheduler.add_request()
ToolCallEstimator.request_arrives()— if returning job → update exec_timeContinuum_Recorder.request_arrives()— record arrival_timewaiting.add_request()
Scheduler.schedule() — called each step
unpin_requests_regular()— clean up expired pinsContinuumRequestQueue.peek_request()- Pinned job in waiting → schedule first
- Otherwise → job-level FCFS
allocate_slots()— alloc KV blocks (evict if needed)running.append(request)
Prefill + Decode (GPU)
FlashAttention reads/writes KV cache blocks via block_table
Scheduler._free_request()
ToolCallEstimator.request_finished()— detokenize → parse tool → record_free_blocks():- Unpin old pin with same job_id
is_last_step? → free immediatelyset_up_pin(): no func → free | exec > 2s → free | exec ≤ 2s → pin 2s
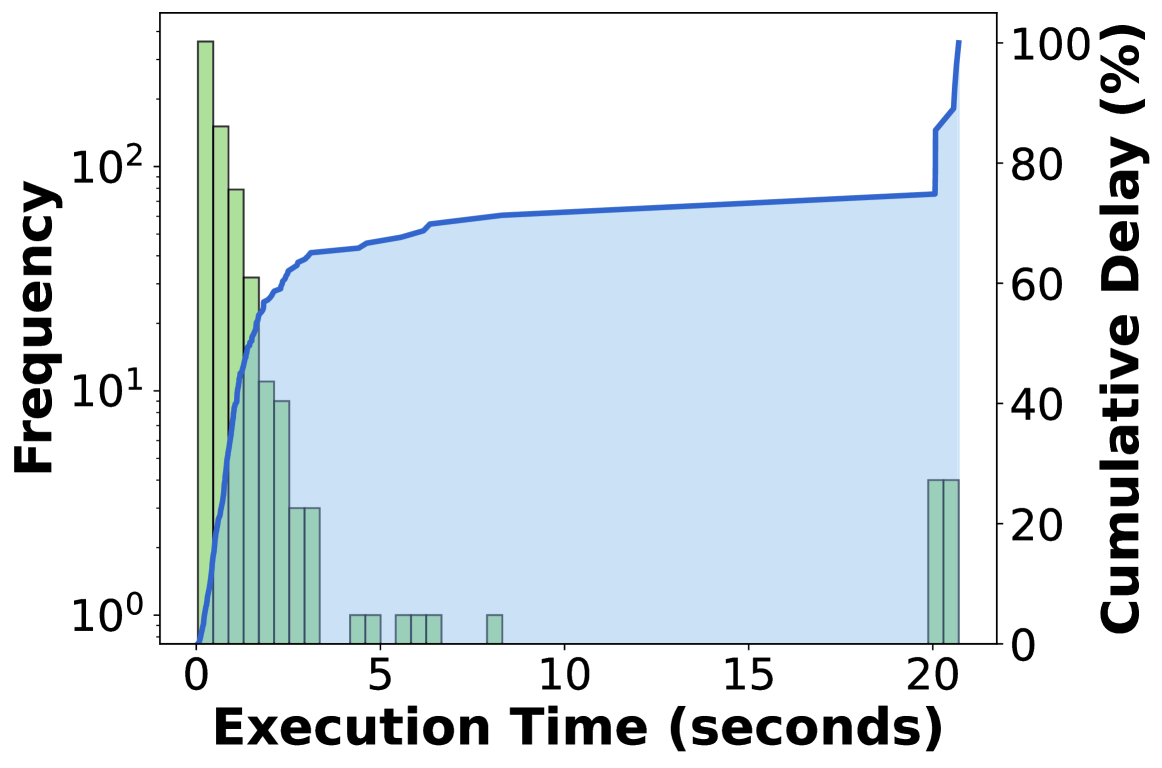
Agent executes tool in sandbox
ls ~0.1s | grep ~0.5s | pytest ~15s | pip install ~30s
Job re-enters
→ back to add_request()
TTL expires
→ unpin → free KV cache
10. Trace Recording (Continuum_Recorder)
File: vllm/v1/core/estimate_with_func.py:12-62
Continuum_Recorder inserts timestamps at each critical point in the request lifecycle,
and ultimately exports them as a JSON file for offline analysis.
10.1 Recorded Events
| Method | Recorded Key | Trigger Timing |
|---|---|---|
request_arrives() | Request_arrival_time | Job enters scheduler |
request_finished() | Request_departure_time | LLM generation complete |
request_pinned() | pinned_time | KV cache is pinned |
request_unpinned() | unpinned_time | KV cache is unpinned |
request_waiting_to_running() | waiting_to_running + prompt_length + hit_length | Transitions from waiting to running |
request_evicted_to_running() | evicted_to_running + prompt_length + hit_length | Rescheduled after preemption |
request_evicted_from_running_queue() | Request_evicted_from_running_queue_time | Preempted |
10.2 Export
# estimate_with_func.py:18-31
def print_history(self):
    output_dir = os.environ.get("RUN_OUTPUT_DIR", "./continuum_exp")
    os.makedirs(output_dir, exist_ok=True)

    # Atomic write (write to .tmp first then rename, preventing partial reads)
    final_path = os.path.join(output_dir, "scheduler_timestamps")
    tmp_path = final_path + ".tmp"
    with open(tmp_path, "w") as f:
        json.dump(self.job_id_to_history, f, indent=2)
    os.replace(tmp_path, final_path)
Output Format: scheduler_timestamps (JSON)
{
  "job_1": [
    {"Request_arrival_time": 1711234567.89},
    {"waiting_to_running": 1711234568.12, "prompt_length": 4096, "hit_length": 3800},
    {"Request_departure_time": 1711234575.00},
    {"pinned_time": 1711234575.01},
    {"Request_arrival_time": 1711234575.30},  // tool call completed, re-entered
    {"waiting_to_running": 1711234575.31, "prompt_length": 4352, "hit_length": 4096},
    // hit_length=4096 means KV cache hit, only need to prefill 256 new tokens
    ...
  ],
  "job_2": [...]
}
11. mini-swe-agent Interface
File: mini-swe-agent/src/minisweagent/models/vllm_model.py:124-141
The Agent communicates with the vLLM server via an OpenAI-compatible API,
passing Continuum-specific parameters in extra_body:
# vllm_model.py:124-141
# Compute is_last_step
is_last_step = False
if self.config.step_limit > 0:
    is_last_step = (self.n_calls + 1) >= self.config.step_limit

# Include Continuum-specific parameters
extra_body = {
    "ignore_eos": False,
    "job_id": str(job_id_value),       # SWE-bench instance ID
    "is_last_step": is_last_step        # Whether this is the last turn
}

return self.client.chat.completions.create(
    model=self.config.model_name,
    messages=messages,
    extra_body=extra_body,
)
Parameter Description
| Parameter | Type | Purpose |
|---|---|---|
job_id |
str | Identifies multi-turn requests from the same SWE-bench instance, allowing the scheduler to recognize them as the same job |
is_last_step |
bool | Agent tells the server "this is the last turn" → scheduler does not pin (because there will be no next turn) |
Experiment Automation
File: mini-swe-agent/run_experiments.py
SCHEDULING_POLICIES = ["fcfs", "continuum"]
JPS_VALUES = [0.05, 0.1, 0.15, 0.2, 0.25, 0.3, 0.5, 0.7, 0.9]
MODEL_NAME = "meta-llama/Llama-3.1-70B-Instruct"

# For each policy x JPS combination:
# 1. Start 2 vllm servers (GPU 0-3 + GPU 4-7, TP=4)
# 2. Start router (load balancer) → port 8100
# 3. Run mini-extra swebench --use-jps --jps X
# 4. Shutdown → export traces
12. Paper Experiment Design (arXiv:2511.02230 Section 6)
12.1 Hardware and Models
| Configuration Name | GPU | Model | TP | Source |
|---|---|---|---|---|
| Llama 8B (1xA100) | A100-SXM 80GB | Llama-3.1-8B-Instruct | 1 | Runpod |
| Llama 8B (1xB200) | B200 | Llama-3.1-8B-Instruct | 1 | On-prem |
| Llama 70B (4xB200) | B200 x4 | Llama-3.1-70B-Instruct | 4 | On-prem |
| Real SWE-Agent (H100) | H100 (Tensormesh) | Unknown | Unknown | Tensormesh internal testbed |
12.2 Datasets
| Dataset | Description | Trace Source |
|---|---|---|
| SWE-Bench | Run SWE-Bench coding tasks using mini-swe-agent | Traces generated by GPT-5, Poisson arrival |
| BFCL V4 | Berkeley Function Calling Leaderboard (Web Search category) | Traces generated by GPT-5, workload scaled 0.4x to fit 128k context |
12.A — In-Depth Discussion: How Were the Traces Generated and Used?
Step 1: Collecting Traces with GPT-5
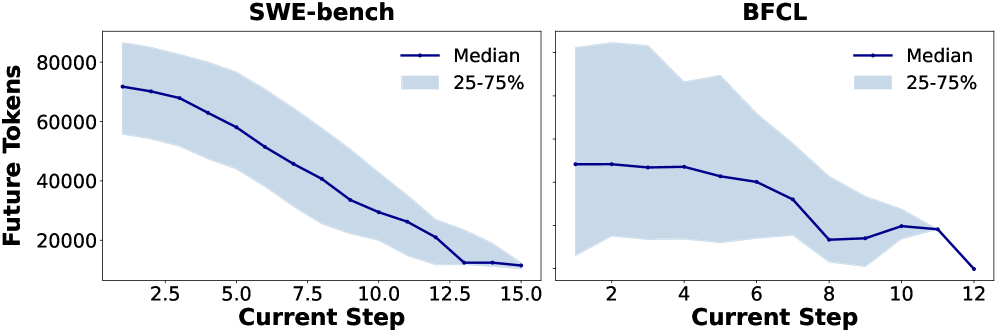
Paper Section 3.1: "We collect and analyze 100 traces from mini-swe-agent running SWE-Bench and 100 traces from BFCL V4, both running GPT-5 as the base model."
The process is:
mini-swe-agent (GPT-5 as backend)
  → LLM inference → output bash command → actually execute in Docker sandbox → tool output returned
  → LLM inference → ... repeat ~10 turns
  → Record each turn's (prompt, response, tool_call, tool_output, exec_time)
These traces record GPT-5's complete conversation history as a coding agent, including each turn's prompt token count, output token count, tool call command, and tool execution time.
Step 2: Using Llama to Evaluate on These Traces?
Paper Section 6.1: "For results other than the real SWE-bench experiments in Figure 11, we evaluate on two collected workloads running GPT-5 and using poisson distribution for the arrival pattern."
However, the repo does not contain a trace replay mechanism.
Looking at mini-swe-agent's code, the agent's execution flow is:
# agents/default.py — real agent loop, not replay
def run(self, task):
    self.add_message("system", system_prompt)
    self.add_message("user", task)
    while True:
        self.step()   # → query() → execute_action()

def step(self):
    response = self.query()              # 1. Send prompt to LLM → get response
    action = self.parse_action(response) # 2. Parse bash command from response
    output = self.env.execute(action)    # 3. Actually execute in Docker
    self.add_message("user", output)      # 4. Add tool output back to context
self.env.execute(action) actually runs the bash command in a Docker/bubblewrap sandbox,
not a simulation. There is no code path that "loads GPT-5 traces and skips LLM inference."
Two Possible Experimental Methods (Paper Does Not Explicitly State)
| Possibility | Approach | Issues |
|---|---|---|
| A. Llama runs real Agent | Use Llama as the LLM backend to actually run SWE-bench. GPT-5 traces are only used to analyze workload characteristics (Table 1, Fig 3, 5). Llama generates its own responses and output token counts. |
Llama-8B's coding capability is far inferior to GPT-5, producing entirely different tool call sequences. Paper Footnote 2 also acknowledges "Base small models often fail to accomplish the task." However, this may not affect scheduling experiments: the scheduler only looks at token counts and tool exec time, not code correctness. |
| B. Use GPT-5 traces to drive replay | Feed GPT-5's conversation history to Llama, controlling prompt length and turn count. Possibly fix Llama's output token count in some way (e.g., max_tokens). |
This mechanism does not exist in the repo. There is no trace loader or replay mode. If it exists, it may be in internal tools that were not open-sourced. |
The Output Token Count Problem
If method A is used (Llama runs real agent), the output token count is entirely determined by Llama. For the same SWE-bench instance:
- GPT-5 might output 200 tokens (precise patch + explanation)
- Llama-8B might output 50 tokens (incorrect attempt) or 500 tokens (verbose debugging process)
This means the statistics in Table 1 (Token Per Program: 70,126 +/- 19,732) are GPT-5 data, and may not represent the actual token counts during Llama experiments.
If method B is used (replay), the following needs to be resolved:
- Prompt length: Can be controlled — directly feed GPT-5 trace conversation history to Llama
- Output token count: Difficult to precisely control —
max_tokensonly sets an upper limit, cannot guarantee Llama generates exactly the same number of tokens as GPT-5 - Tool call content: If Llama generates a different bash command → tool exec time differs → the entire subsequent flow diverges
Conclusion
The paper does not explicitly state whether Llama is replaying GPT-5 traces in the Fig 8-10 experiments. The repo only contains the real agent loop (method A), no replay mechanism (method B). The most likely scenario is:
- Fig 8-10 (emulated): Run real SWE-bench agent with Llama, GPT-5 traces only used for workload characteristic analysis
- Fig 11 (real): Run real SWE-agent on Tensormesh (possibly with a stronger model)
- Llama's token counts and tool call sequences differ from GPT-5, but the paper uses Table 1's GPT-5 statistics to describe workload characteristics
This is a methodologically questionable point: if workload statistics come from GPT-5 but experiments run on Llama, then Table 1's data does not represent the actual experimental workload.
12.3 Baselines (6 total)
| Baseline | Version | Description | Implemented in Repo? |
|---|---|---|---|
| Vanilla vLLM | 0.10.2 | Standard FCFS + end-of-turn eviction, chunked-prefill chunk size 2048 | Yes (--scheduling-policy fcfs) |
| CPU DRAM offloading | vLLM 0.10.2 + LMCache 0.3.7 | KV cache offload to CPU DRAM (A100: 100GB, B200/H100: 200GB/GPU) | Partial (vLLM has built-in LMCache connector, but no standalone test script) |
| Autellix / Autellix+ | PLAS algorithm on vLLM | Program-Level Attained Service: ordered by cumulative service time. Autellix+ adds LMCache CPU offloading | No |
| InferCept | preserve/swap/evict on vLLM + LMCache | Static KV cache retain: unconditionally preserve KV cache during tool calls | No |
| SGLang | 0.5.5.post3 | Native cache-aware routing | Partial (has client class sglang_model.py, but no test script) |
| Dynamo | 0.7.0.post1 | ai-dynamo/dynamo — NVIDIA's distributed inference framework, 1P1D PD Disaggregation | No |
12.4 Paper Experiment Matrix
| Figure | Experiment | Compared Baselines | Hardware | Offloading |
|---|---|---|---|---|
| Fig 8 | End-to-end (no offload) | vLLM vs Continuum vs Autellix | 70B/4xB200, 8B/1xB200, 8B/1xA100 | Disabled |
| Fig 9 | End-to-end (with DRAM offload) | vLLM vs Continuum vs Autellix+ vs InferCept | Same as above | LMCache CPU offload |
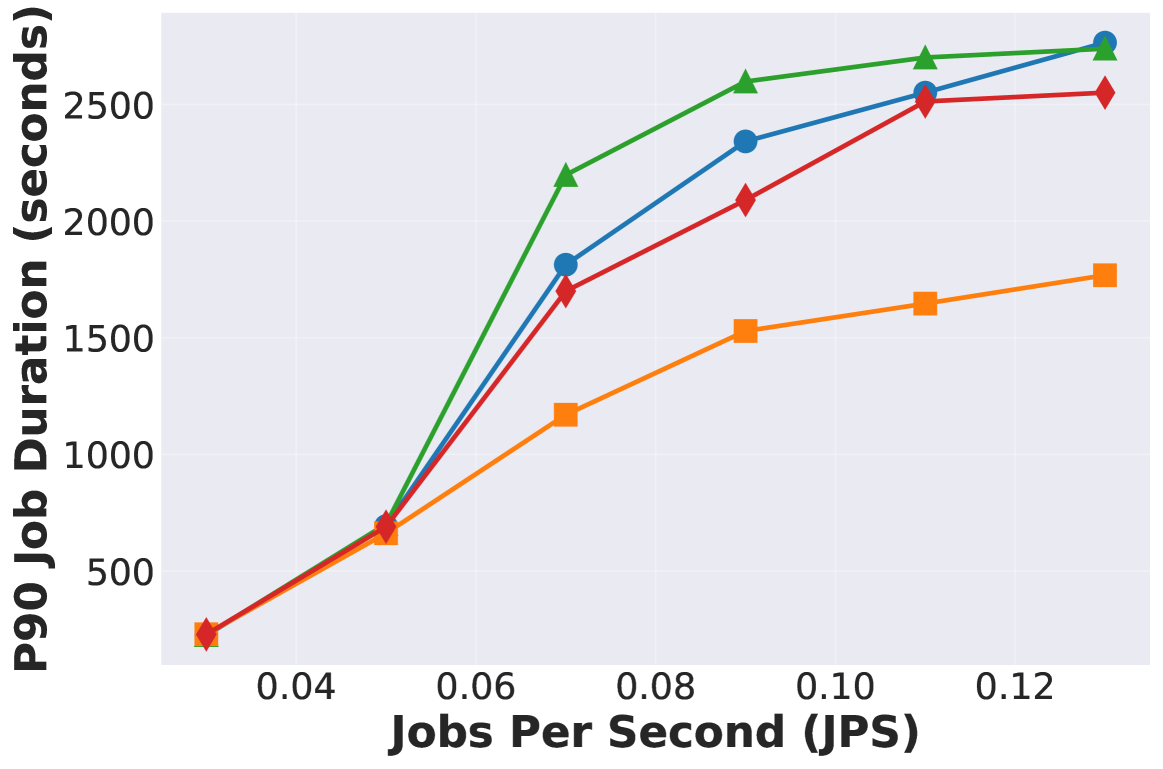
| Fig 10 | P90 / P95 tail latency | vLLM vs Continuum vs Autellix+ vs InferCept | 8B/1xB200 | LMCache CPU offload |
| Fig 11 | Real SWE-Agent distributed deployment | Continuum vs SGLang vs Dynamo | Tensormesh H100 | Unknown |
Fig 8-10: Emulated workload (Poisson trace replay)
- X-axis: Jobs Per Second (JPS) — Poisson arrival rate
- Y-axis: Average Job Duration (seconds)
- One subplot per Dataset (SWE-Bench / BFCL) x hardware configuration
- Traces were pre-collected using GPT-5, Llama model only handles serving
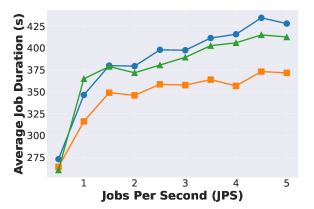
Fig 11: Real SWE-Agent (500 tasks on Tensormesh)
- Run real SWE-bench Verified (500 tasks) on Tensormesh internal H100 testbed
- Added job distributor for Poisson distribution
- Session-aware routing
- Left plot: Average delay vs JPS (Continuum vs SGLang vs Dynamo)
- Right plot: SWE-bench pass rate (Continuum has higher actual pass rate because baselines get preempted by 15min timeout)
12.5 Key Results from the Paper
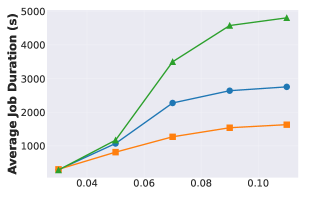

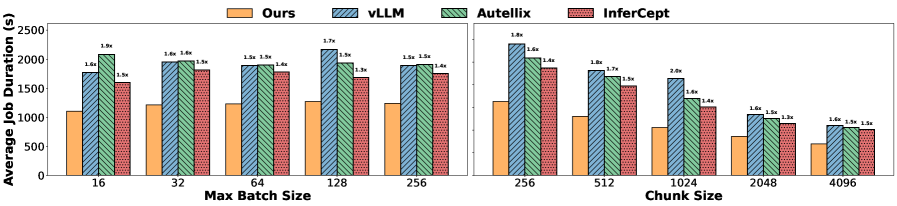


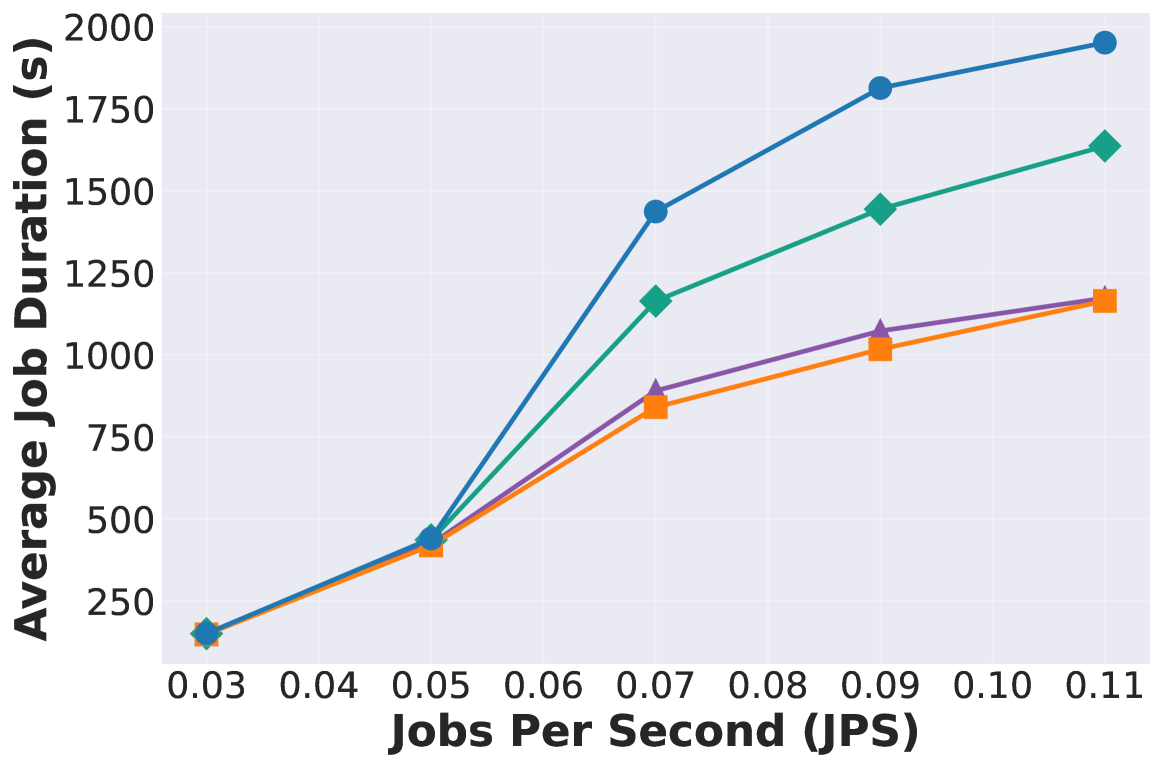
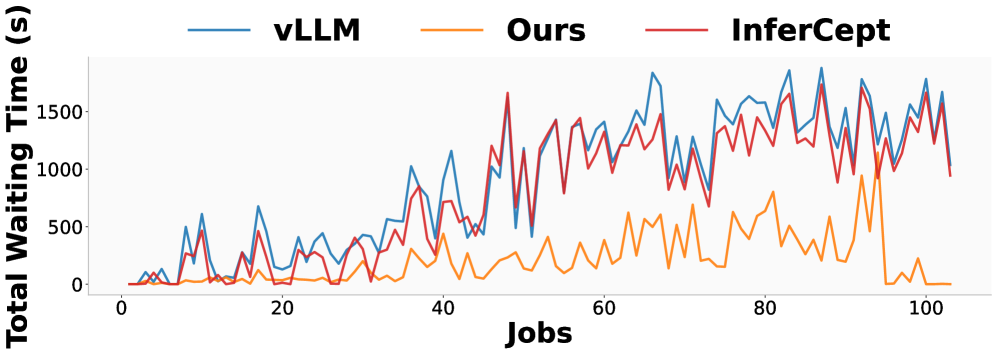
Latency Improvement
Continuum reduces latency by 1.12x ~ 3.66x compared to vanilla vLLM
Also shows significant improvement over Autellix/InferCept
Throughput Improvement
Improves throughput by 1.10x ~ 3.22x
Real SWE-Agent
Reduces latency by up to 8.18x on the Tensormesh testbed
Higher pass rate than baselines (baselines get killed by 15min timeout)
13. Executable Experiment Workflow in the Repo
The paper has 6 baselines, but the repo can only run FCFS vs Continuum. Below is the experiment code that actually exists in the repo.
13.1 Automation Script: run_experiments.py
# mini-swe-agent/run_experiments.py
SCHEDULING_POLICIES = ["fcfs", "continuum"]   # Only these two
JPS_VALUES = [0.05, 0.1, 0.15, 0.2, 0.25, 0.3, 0.5, 0.7, 0.9]
MODEL_NAME = "meta-llama/Llama-3.1-70B-Instruct"
PORT_1 = 8001
PORT_2 = 8002
ROUTER_PORT = 8100
Workflow
# Complete workflow (what run_experiments.py does internally):

# 1. Start 2 vLLM servers (same policy)
CUDA_VISIBLE_DEVICES=0,1,2,3 vllm serve $MODEL \
    --scheduling-policy $POLICY --port 8001 --tensor-parallel-size 4 &
CUDA_VISIBLE_DEVICES=4,5,6,7 vllm serve $MODEL \
    --scheduling-policy $POLICY --port 8002 --tensor-parallel-size 4 &

# 2. Start router (load balancer)
python continuum_exp/router.py --port 8100 --backends 8001,8002 &

# 3. Run SWE-bench workload (Poisson arrival)
mini-extra swebench \
    --model-class vllm --model $MODEL --port 8100 \
    --subset verified --split test \
    --use-jps --jps $JPS \
    --output $OUTPUT_DIR/swebench_output

# 4. Shutdown → trigger trace export
kill -TERM $SERVER_PID_1 $SERVER_PID_2
# → $RUN_OUTPUT_DIR/scheduler_timestamps

# 5. Analysis
python continuum_exp/analyze.py --input-dir $OUTPUT_DIRkill -9 skips the shutdown hook, and scheduler_timestamps will not be written.
13.2 Running a Single Experiment Manually
# Start server
vllm serve meta-llama/Llama-3.1-70B-Instruct \
    --scheduling-policy continuum \
    --port 8001 \
    --tensor-parallel-size 4

# Run workload (another terminal)
mini-extra swebench --model-class vllm --model $MODEL --port 8001 \
    --subset verified --split test --workers 4

# Or Poisson arrival
mini-extra swebench --model-class vllm --model $MODEL --port 8001 \
    --subset verified --split test --workers 64 --use-jps --jps 0.1
13.3 SGLang Client (code exists but no complete workflow)
# mini-swe-agent/src/minisweagent/models/sglang_model.py
# Has a SglangModel class that can connect to SGLang server
# But run_experiments.py does not start SGLang server
# To test SGLang, you need to:
#   1. Install + start sglang serve yourself
#   2. mini-extra swebench --model-class sglang --port 30000
13.4 Output Structure
14. Paper vs Repo: Gap Analysis
14.1 Algorithm Gaps
| Paper Description | Repo Implementation | Gap |
|---|---|---|
CDF: Use empirical CDF P(τ,f) = Σ𝟙[t≤τ] / |S[f]| to estimate tool call completion probability |
Only simple average avg(samples) |
CDF not implemented |
Cost Model: τ* = argmax P(τ,f) × Benefit(r) - Cost(τ,r) |
Fixed threshold if avg > 2.0s → free, else pin 2.0s |
Cost model not implemented |
| Benefit = CacheMissCost + OutofOrderCost | No benefit calculation | Not implemented |
Cost = MemUsage(r)/M × τ |
No cost calculation | Not implemented |
| Memoryfulness factor η = -Corr(k, N-k) | None | Not implemented |
| Dynamic TTL: Each request computes a different τ* based on tool call + cost model | All pinned for a fixed 2.0 seconds | Severely simplified |
Cold-start: When |S[f]| ≤ K, use global CDF, then fall back to T_default |
First-time tool → exec_time=0 → directly pin for 2s (optimistic strategy) | Different cold-start strategy |
| Offline profile: Fit quadratic curve for prefill vs context length, measure GPU-CPU bandwidth | No offline profiling code | Missing |
14.2 Experiment Reproducibility Gaps
| Paper Experiment | Reproducible with Repo? | What's Missing |
|---|---|---|
| Fig 8: vLLM vs Continuum vs Autellix (no offload) | Partial | Autellix (PLAS) is not open-sourced |
| Fig 9: vLLM vs Continuum vs Autellix+ vs InferCept (with offload) | No | Autellix+ and InferCept are not open-sourced; LMCache integration has no test script |
| Fig 10: P90/P95 tail latency | No | Same as above |
| Fig 11: Real SWE-Agent (Continuum vs SGLang vs Dynamo) | No | Requires Tensormesh H100 testbed + Dynamo 0.7.0.post1 deployment + job distributor + session-aware router (none open-sourced) |
| vLLM (FCFS) vs Continuum comparison | Yes | run_experiments.py can be run directly |
| Table 1: SWE-Bench / BFCL trace statistics | No | GPT-5 generated trace data is not included in the repo |
14.3 Code Quality Indicators
| Aspect | Status | Description |
|---|---|---|
| TODO / NOTE (Hanchen) | 15+ | Numerous incomplete markers scattered throughout scheduler.py |
| Unit tests | 0 | No Continuum-specific tests at all |
| Debug print | Multiple | Commented-out #print(...) left in the code |
| CDF algorithm | Not implemented | Only moving average + fixed threshold |
| C++/CUDA modifications | 0 | 191 CUDA files have zero modifications, only Python scheduler changed |
| vLLM version | 0.10.2 fork | Upstream git history not preserved (initial commit contains the entire vLLM) |
15. Analysis Methods
File: continuum_exp/analyze.py
15.1 JCT Computation
# JCT for each job:
JCT = max(departure_times) - min(arrival_times)  # Including all turns

# Global wall time:
wall_time = max(all jobs' departure) - min(all jobs' arrival)
15.2 Statistical Metrics
| Metric | Computation |
|---|---|
num_jobs | Number of jobs with complete arrival + departure records |
average_duration | Arithmetic mean of all JCTs |
median_duration | P50 |
percentile_95 | P95 (linear interpolation) |
percentile_99 | P99 (linear interpolation) |
min_duration / max_duration | Fastest / slowest job |
total_duration | Global wall time |
15.3 Derivable Cache Metrics
From the waiting_to_running events in scheduler_timestamps, the following can be computed:
| Metric | Computation | Meaning |
|---|---|---|
| Cache Hit Ratio | hit_length / prompt_length |
KV cache hit rate (successful pin → hit_length ≈ prompt_length) |
| Prefill Savings | 1 - (prompt_length - hit_length) / prompt_length |
How much prefill computation was saved |
| Queue Wait Time | waiting_to_running - Request_arrival_time |
How long the request waited in the queue |
| Pin Duration | unpinned_time - pinned_time |
How long the KV cache was pinned |
15.4 Usage
python continuum_exp/analyze.py --input-dir ./path/to/run_output

# Example output:
# === Job Duration Statistics ===
# Number of jobs: 20
# Average duration: 342.50 seconds
# Median duration: 318.20 seconds
# 95th percentile: 567.80 seconds
# 99th percentile: 612.40 seconds