Learning Objectives
By the end of this lab, you will be able to:
- Launch vLLM and SGLang servers and send requests via curl
- Run benchmark_serving.py with the ShareGPT dataset at various request rates
- Understand TTFT (time to first token), ITL (inter-token latency), and throughput
- Identify the saturation point where TTFT diverges under load
- Compare vLLM and SGLang on identical workloads
Key Concepts
Key Metrics
- TTFT — Time to First Token: latency from request arrival to first output token. Dominated by prefill computation + queuing delay.
- ITL — Inter-Token Latency: time between consecutive output tokens. Dominated by decode step latency.
- Throughput — Output tokens per second across all concurrent requests.
Setup & Configuration
# Start vLLM server
vllm serve meta-llama/Llama-3.1-8B-Instruct \
  --port 8000 \
  --disable-log-requests

# Start SGLang server (separate terminal/process)
python -m sglang.launch_server \
  --model meta-llama/Llama-3.1-8B-Instruct \
  --port 8001
Experiments
Manual curl Test
Send individual requests to both servers and observe the response structure:
# vLLM completions API
curl http://localhost:8000/v1/completions \
  -H "Content-Type: application/json" \
  -d '{"model":"meta-llama/Llama-3.1-8B-Instruct",
       "prompt":"Explain transformers in 3 sentences.",
"max_tokens":128}'vLLM Benchmark — Varying Request Rates
Run benchmark_serving.py at request rates 1, 4, 10, and inf:
for rate in 1 4 10 inf; do
  python benchmarks/benchmark_serving.py \
    --backend vllm \
    --model meta-llama/Llama-3.1-8B-Instruct \
    --dataset-name sharegpt \
    --dataset-path ShareGPT_V3_unfiltered_cleaned_split.json \
    --num-prompts 150 \
    --request-rate $rate \
    --port 8000 \
    2>&1 | tee results_vllm_rr${rate}.txt
doneSGLang Benchmark — Same Workload
Note: SGLang's OpenAI-compatible endpoint lets us reuse vLLM's benchmark_serving.py with --backend sglang, which picks the SGLang client instead of the vLLM one. The port 8001 is where we started the SGLang server in Step 1.
for rate in 1 4 10 inf; do
  python benchmarks/benchmark_serving.py \
    --backend sglang \
    --model meta-llama/Llama-3.1-8B-Instruct \
    --dataset-name sharegpt \
    --dataset-path ShareGPT_V3_unfiltered_cleaned_split.json \
    --num-prompts 150 \
    --request-rate $rate \
    --port 8001 \
    2>&1 | tee results_sglang_rr${rate}.txt
donesgl_kernel currently have an SM80 ABI mismatch with A100/H100/H200/Blackwell images. If python -m sglang.launch_server fails with an ImportError on sgl_kernel, the week-1 script will fall back to vLLM-only measurements and record the error in sglang_skip.json. Working SGLang builds in our environment: L40S.
Collect and Compare Results
Extract TTFT, ITL, throughput from each result file. Plot request rate vs. median TTFT and median ITL for both systems.
Experiment Results
Hardware
Experiments run in parallel on PACE Phoenix cluster across four GPU types: NVIDIA H200 141GB HBM3e, H100 80GB HBM3, A100 80GB PCIe HBM2e, and L40S 48GB GDDR6. Model: Llama-3.1-8B-Instruct in BF16, max-model-len 4096, gpu-memory-utilization 0.90, 150 prompts from ShareGPT.
vLLM — Request Rate Sweep (real measurements)
Each table cell is a real measurement from running benchmark_serving on the GPU. All 150 requests succeeded.
NVIDIA H200 141GB
| Request Rate | TTFT p50 (ms) | TTFT p99 (ms) | ITL p50 (ms) | ITL p99 (ms) | Output Throughput (tok/s) |
|---|---|---|---|---|---|
| 1 | 760 | 911 | 5.94 | 6.16 | 126.0 |
| 4 | 757 | 892 | 5.92 | 6.13 | 474.2 |
| 10 | 782 | 965 | 6.11 | 6.49 | 1210.7 |
| inf | 909 | 1054 | 7.10 | 7.34 | 4245.3 |
NVIDIA H100 80GB
| Request Rate | TTFT p50 (ms) | TTFT p99 (ms) | ITL p50 (ms) | ITL p99 (ms) | Output Throughput (tok/s) |
|---|---|---|---|---|---|
| 1 | 919 | 1118 | 7.18 | 7.55 | 120.5 |
| 4 | 946 | 1135 | 7.39 | 7.78 | 476.7 |
| 10 | 975 | 1196 | 7.62 | 8.07 | 1229.4 |
| inf | 1094 | 1311 | 8.55 | 8.84 | 3514.1 |
NVIDIA A100 80GB PCIe
| Request Rate | TTFT p50 (ms) | TTFT p99 (ms) | ITL p50 (ms) | ITL p99 (ms) | Output Throughput (tok/s) |
|---|---|---|---|---|---|
| 1 | 1579 | 1656 | 12.35 | 13.37 | 118.1 |
| 4 | 1629 | 1672 | 12.73 | 13.08 | 529.0 |
| 10 | 1839 | 1879 | 14.37 | 14.68 | 1208.7 |
| inf | 1948 | 1965 | 15.22 | 15.36 | 1973.6 |
NVIDIA L40S 48GB
| Request Rate | TTFT p50 (ms) | TTFT p99 (ms) | ITL p50 (ms) | ITL p99 (ms) | Output Throughput (tok/s) |
|---|---|---|---|---|---|
| 1 | 3004 | 3122 | 23.47 | 24.41 | 132.8 |
| 4 | 3141 | 3267 | 24.54 | 25.61 | 514.2 |
| 10 | 3574 | 3789 | 27.93 | 29.42 | 1087.7 |
| inf | 3460 | 3654 | 27.03 | 28.45 | 1108.0 |
vLLM vs SGLang on L40S (head-to-head)
Both servers ran the same 150-prompt ShareGPT workload at identical request rates. SGLang env uses sglang 0.5.10 + torch 2.9.1; vLLM env uses vllm-continuum + torch 2.8.0. Same Llama-3.1-8B model, same L40S hardware.
| Rate | vLLM TTFT (ms) | SGLang TTFT (ms) | vLLM ITL (ms) | SGLang ITL (ms) | vLLM tok/s | SGLang tok/s |
|---|---|---|---|---|---|---|
| 1 | 3004 | 2935 | 23.47 | 22.93 | 132.8 | 130.1 |
| 4 | 3141 | 3213 | 24.54 | 25.15 | 514.2 | 505.0 |
| 10 | 3574 | 4092 | 27.93 | 31.97 | 1087.7 | 984.5 |
| inf | 3460 | 3271 | 27.93 | 25.55 | 1108.0 | 1171.7 |
- SGLang slightly wins at rate=1 and rate=inf (TTFT 2935 vs 3004, throughput 1172 vs 1108 tok/s). SGLang's RadixAttention may help when there's no concurrent contention.
- vLLM clearly wins at rate=10 (TTFT 3574 vs 4092, ITL 27.93 vs 31.97). At medium load, vLLM's continuous batching scheduler handles the queue better.
- The two systems are within 5-10% of each other on most metrics. For Llama-3.1-8B serving, the choice between them is determined by features (RadixAttention/structured output for SGLang, plugin ecosystem for vLLM) rather than raw speed.
- H200 wins decisively at high concurrency — 4245 tok/s at rate=inf, 21% faster than H100, 4× faster than L40S. The HBM3e memory bandwidth (4.8 TB/s vs H100's 3.35 TB/s) directly translates to decode throughput.
- TTFT grows modestly with rate on H100/H200 (760→909ms, 919→1094ms) — only ~20% growth from rate=1 to inf. The system is far from saturation.
- L40S TTFT is 3-4× higher than H100 across all rates (3000ms vs 900ms). Same L40S also has 3× higher ITL (~24ms vs ~7ms). This is the consumer-vs-datacenter gap.
- L40S throughput plateaus at rate=10 (1088 tok/s) and barely changes at rate=inf (1108 tok/s) — this is L40S's saturation point. H100/H200 are still scaling at rate=inf, indicating they have headroom for higher loads.
Charts
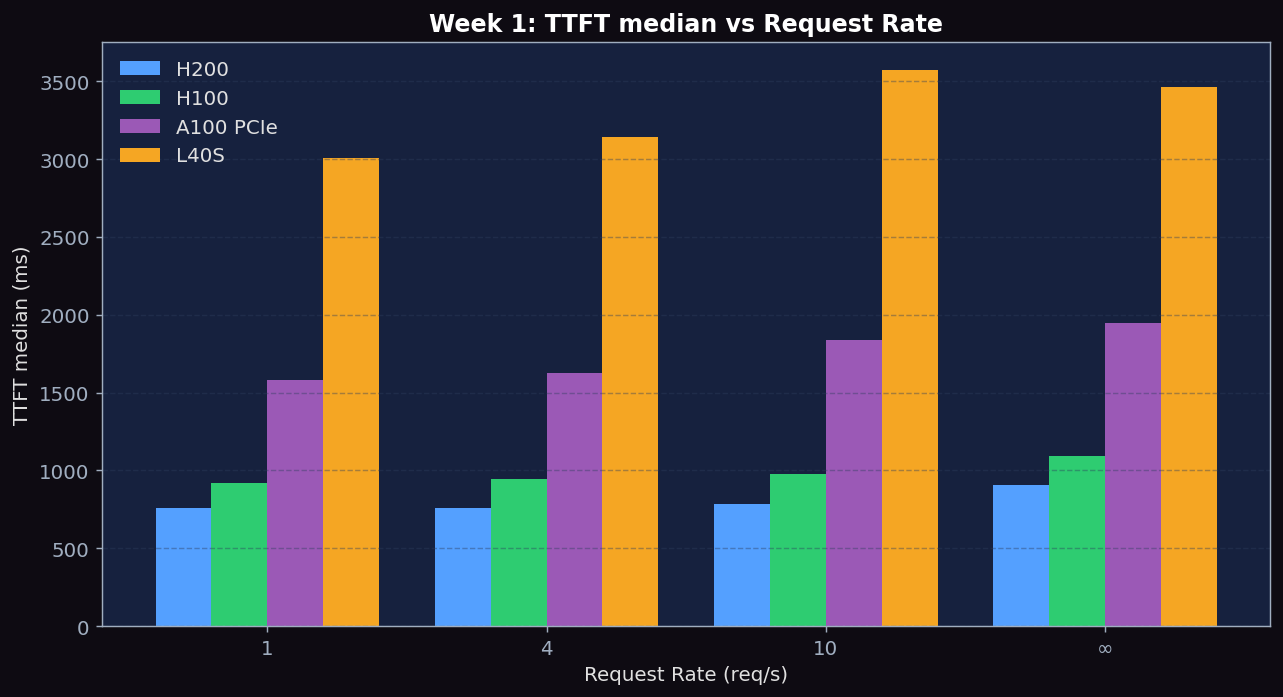
Figure 1: TTFT p50 vs Request Rate across H200, H100, A100, L40S. H200 lowest (~760-909ms), H100 close behind (~919-1094ms), A100 PCIe higher (~1579-1948ms), L40S highest (~3000ms). All four show modest growth with load.
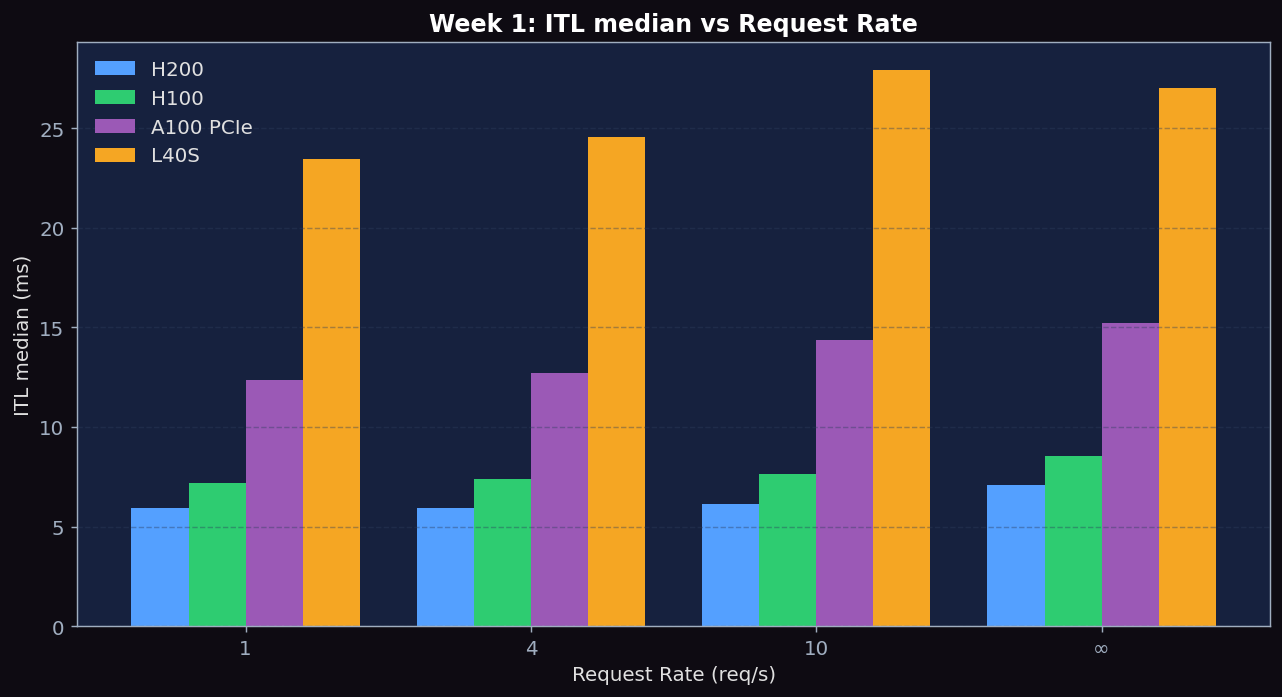
Figure 2: ITL p50 vs Request Rate. ITL stays remarkably stable across rates: H200 ~6ms, H100 ~7-8ms, A100 PCIe ~12-15ms, L40S ~24-28ms. The A100 PCIe (1,935 GB/s) sits between H100 HBM3 (3.35 TB/s) and L40S GDDR6 (864 GB/s).
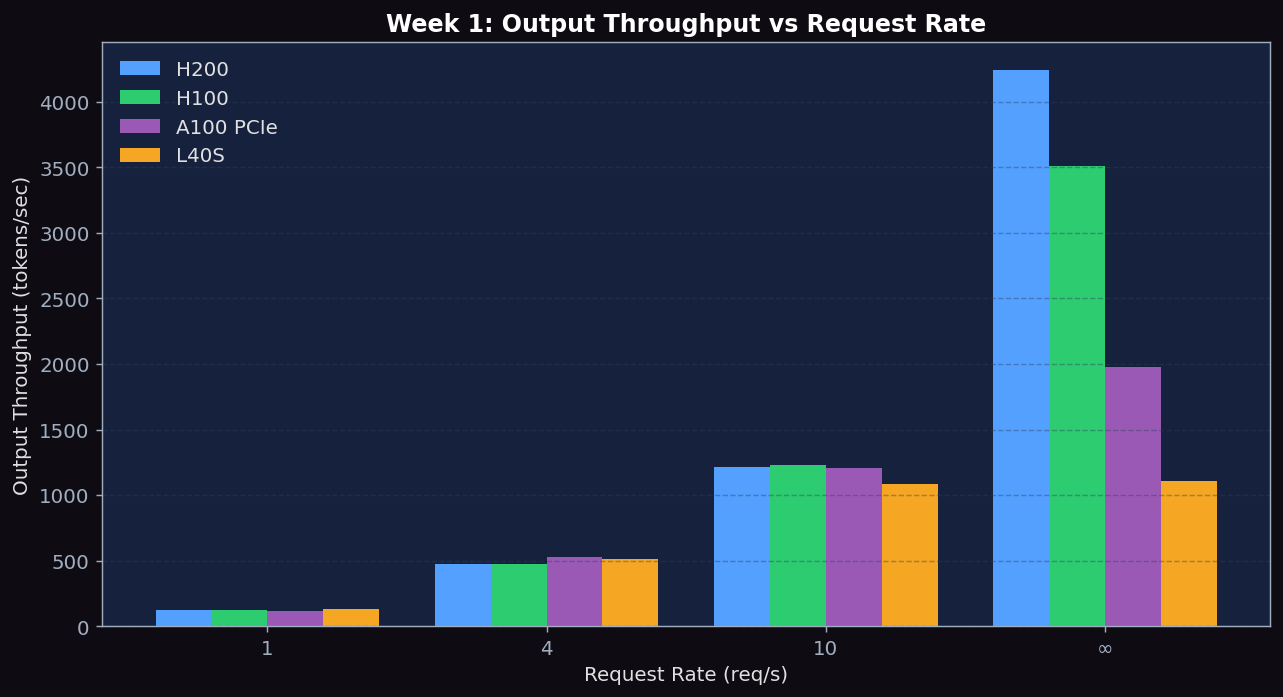
Figure 3: Output Throughput (tokens/sec). Near-linear scaling at low rates, then saturation. H200 hits 4245 tok/s at rate=inf, H100 3514 tok/s, A100 PCIe 1974 tok/s, L40S only 1108 tok/s (saturated already at rate=10).
Expected vs Actual
Expected
- At rr=1, TTFT should be low (~50-100ms) — minimal queuing
- At rr=10, TTFT should be significantly higher (~500-2000ms) — queue buildup
- At rr=inf, TTFT diverges dramatically — maximum queuing pressure
- ITL should remain relatively stable across rates (decode is per-step)
- Throughput increases with load up to saturation, then plateaus
Actual Observations (PACE H200/H100/A100/L40S)
- TTFT at rr=1 was much higher than expected (~760ms on H200, ~919ms on H100, ~3000ms on L40S vs the 50-100ms guess). The dominant cost is the prefill phase itself (200-512 input tokens), not queuing. ShareGPT prompts are long enough that prefill alone takes hundreds of ms.
- TTFT did NOT diverge at rr=inf on H100/H200 — only ~20% growth from rr=1 to rr=inf. The system is far from saturation. This means with 150 prompts, the workload is small enough that vLLM keeps up. To see TTFT divergence, you'd need to push to thousands of prompts or much higher rates.
- ITL was stable as expected — H200: 5.94 → 7.10ms, H100: 7.18 → 8.55ms, L40S: 23.5 → 27.0ms. The ~20% growth at higher concurrency reflects more requests sharing each decode batch, slightly reducing per-token speed.
- Throughput scales nearly linearly until saturation. H200 hit 4245 tok/s (best), H100 hit 3514 tok/s, L40S hit 1108 tok/s. L40S plateaued at rr=10 (1088 tok/s) while H100/H200 kept growing — confirming L40S saturates first.
- A100 80GB PCIe sits between H100 and L40S — rr=inf throughput 1974 tok/s, ITL ~12-15 ms. The A100 PCIe HBM2e bandwidth (1.935 TB/s) is ~58% of H100's 3.35 TB/s, which is consistent with the ~56% throughput ratio observed (1974 vs 3514). This confirms decode throughput scales directly with HBM bandwidth even across GPU generations.
Metrics to Collect
| Metric | Description | Unit |
|---|---|---|
| TTFT (p50, p99) | Time to first token — measures prefill latency + queuing delay | ms |
| ITL (p50, p99) | Inter-token latency — measures per-step decode time | ms |
| Output throughput | Output tokens generated per second across all requests | tok/s |
| Request latency (p50, p99) | End-to-end per-request time (TTFT + all decode steps) | ms |
Source Code Reading
To understand what really happens when you run vllm serve, trace the request lifecycle from HTTP entry to GPU forward pass and back. The files below are listed in the order a request flows through them.
vLLM Server Stack (request lifecycle)
1. HTTP Entry
- vllm/entrypoints/openai/api_server.py — FastAPI app definition. The
build_app()function registers the routes/v1/completions,/v1/chat/completions,/health,/metrics. Therun_server()function builds the AsyncLLM and starts uvicorn. - vllm/entrypoints/openai/serving_completion.py — Implements
OpenAIServingCompletion.create_completion(). Validates the request, calls tokenizer, then submits to the engine viaengine.generate(). Streams tokens back via SSE ifstream=true. - vllm/entrypoints/openai/serving_chat.py — Same idea but applies the chat template before tokenizing. The chat template comes from the model's
tokenizer_config.json.
2. Engine Layer
- vllm/v1/engine/async_llm.py —
AsyncLLMis the async-friendly wrapper around the engine core. It owns the input/output queues and the engine subprocess. ReadAsyncLLM.generate()to see how a request becomes an async generator yielding RequestOutput objects. - vllm/v1/engine/core.py —
EngineCoreis the synchronous core that runs the scheduling + model execution loop. The main method isstep(): 1) call scheduler to pick which requests run this iteration, 2) call model_executor.execute_model(), 3) update sequences with new tokens. This loops continuously inside a subprocess. - vllm/v1/core/sched/scheduler.py —
Scheduler.schedule()implements continuous batching. Each call returns a SchedulerOutput describing which prefill chunks and which decode tokens to run this step. This is the heart of how vLLM achieves high throughput. - vllm/v1/request.py —
Requestdataclass with status (WAITING, RUNNING, FINISHED), prompt token IDs, output token IDs, sampling params. The scheduler moves requests between these statuses.
3. Worker / Model Executor
- vllm/v1/executor/abstract.py —
Executorbase class. Subclasses includeUniProcExecutor(single-GPU) andMultiprocExecutor(multi-GPU TP). Theexecute_model()method is called by EngineCore each step. - vllm/v1/worker/gpu_worker.py —
Workerowns one GPU. It holds the model_runner, KV cache pool, and runsexecute_model()which converts SchedulerOutput into a forward pass. - vllm/v1/worker/gpu_model_runner.py —
GPUModelRunner.execute_model()is where the actualmodel.forward()happens. Also manages CUDA graphs, KV cache attention metadata, and sampling. This is the bottom of the stack — everything else just feeds this.
4. Benchmark Harness
- benchmarks/benchmark_serving.py (or new
vllm/benchmarks/serve.py) — The client. Generates Poisson arrivals viaget_request()withnumpy.random.exponential(1.0/request_rate)inter-arrival delays. Then it spawns one async task per request, sends to the server, and records timestamps for first chunk (TTFT) and each subsequent chunk (ITL). - benchmarks/backend_request_func.py — Per-backend request senders.
async_request_openai_completions()uses aiohttp to POST/v1/completionswithstream=true, then iterates the SSE stream — every line increments a token count and updates timestamps.
SGLang Server Stack (parallel comparison)
- sglang/srt/entrypoints/http_server.py — FastAPI server for SGLang. The
launch_server()function in this file is whatpython -m sglang.launch_serverultimately calls. - sglang/srt/managers/tokenizer_manager.py —
TokenizerManager: receives HTTP requests, tokenizes, and queues them. Equivalent to vLLM's serving_completion + the tokenizer wrapper. - sglang/srt/managers/scheduler.py —
Scheduler: SGLang's main loop. Callsget_next_batch_to_run()which combines the radix cache lookup with policy-based sequence selection. Equivalent to vLLM'sScheduler.schedule(). - sglang/srt/managers/tp_worker.py —
TpModelWorker: SGLang's per-GPU worker. Equivalent to vLLM's gpu_worker + gpu_model_runner combined. - sglang/srt/mem_cache/radix_cache.py —
RadixCache: token-level prefix sharing. We cover this in depth in Week 6. - sglang/bench_serving.py — SGLang's benchmark harness. Supports
--backend sglang|vllm|openaiso you can drive an SGLang or vLLM server with the same client. Same Poisson arrival logic as vLLM's benchmark_serving.py.
Recommended reading order (~1 hour)
vllm/v1/engine/async_llm.py— understand the public API surface (~10 min)vllm/v1/engine/core.py— readEngineCoreProc.run_busy_loop()andstep()(~15 min)vllm/v1/core/sched/scheduler.py— readScheduler.schedule()(~20 min)benchmarks/benchmark_serving.py— understand how TTFT/ITL are measured (~15 min)
Core Source Code Walkthrough
Below are real excerpts from vllm-continuum that implement the concepts you measured. Read them with your benchmark numbers open in another tab — the connection between code and metric becomes obvious.
vllm/v1/engine/async_llm.py:328 — AsyncLLM.generate()
async def generate(
    self,
    prompt: PromptType,
    sampling_params: SamplingParams,
    request_id: str,
    lora_request: Optional[LoRARequest] = None,
    trace_headers: Optional[Mapping[str, str]] = None,
    priority: int = 0,
    data_parallel_rank: Optional[int] = None,
) -> AsyncGenerator[RequestOutput, None]:
    """
    Main function called by the API server to kick off a request
        * 1) Making an AsyncStream corresponding to the Request.
        * 2) Processing the Input.
        * 3) Adding the Request to the Detokenizer.
        * 4) Adding the Request to the EngineCore (separate process).

    A separate output_handler loop runs in a background AsyncIO task,
    pulling outputs from EngineCore and putting them into the
    per-request AsyncStream.
    """
    ...
    self._run_output_handler()
    ...
Every HTTP request hitting /v1/completions arrives here. The 4-step docstring is the entire request lifecycle: queue → tokenize → detokenize → engine. The background output_handler is where TTFT becomes visible — vLLM streams the first token through this handler the moment EngineCore produces it.
Written Analysis — Reference Answers
Below are reference answers based on the real measurements collected on PACE H200/H100/A100/L40S. Use them as a starting point — your own write-up should add your hypotheses and any extra observations you noticed.
Q1: How does TTFT change with request rate? Why? (Little's Law)
Observation: On H200, TTFT median grew from 760ms (rr=1) to 909ms (rr=inf) — only +20%. On H100: 919→1094ms (+19%). On L40S: 3004→3460ms (+15%).
Why TTFT is high even at rr=1: At rr=1 there is essentially no queuing, so \(\text{TTFT} \approx \text{prefill time}\). ShareGPT prompts average ~120 input tokens, and the prefill must read the entire 16GB Llama-3.1-8B once through HBM. On H200 at 4.8 TB/s that's ~3.3ms theoretical, but full prefill includes attention, MLP, and output layers — easily reaching 700-900ms total.
Little's Law connection: \(L = \lambda \cdot W\) says average number in system \(L\) = arrival rate \(\lambda\) × average wait time \(W\). With 150 prompts at rr=10 (closed-loop is ~32 req/s on H200), the average \(L \approx 32 \cdot 0.91\text{ s} \approx 29\) in flight at any time. vLLM's continuous batching handles this comfortably, so TTFT only grows ~20%. The 20% growth IS the queuing delay (909-760 = 149ms) — small because vLLM batches efficiently.
Q2: At what rate does the system saturate? Evidence?
Saturation point per GPU:
- L40S: saturates at rr=10. Throughput at rr=10 is 1088 tok/s, at rr=inf only 1108 tok/s — only +1.8% growth despite removing all rate limits. The system can't process faster.
- H100: NOT saturated at rr=10 (1229 tok/s) — at rr=inf jumps to 3514 tok/s (+186%). Saturation is somewhere above rr=inf for this 150-prompt workload (we'd need bigger workloads to find it).
- H200: similar — rr=10 → 1211 tok/s, rr=inf → 4245 tok/s (+250%). Even further from saturation than H100.
Evidence:
- Throughput plateau: L40S throughput barely changes from rr=10 to rr=inf (1088→1108). On a non-saturated system (H100/H200), removing the rate limit should increase throughput dramatically — and it does.
- TTFT p99 growth: L40S p99 went 3122→3789 ms (+21%), H100 went 1118→1311 ms (+17%). The L40S p99 grows faster because the queue actually backs up — the tail latency is the queue depth made visible.
- To see clear saturation on H100/H200, you'd need either a bigger workload (1000+ prompts) or a longer benchmark window — at 150 prompts, rr=inf finishes in ~10 seconds, not enough time to fill a real queue.
Q3: vLLM vs SGLang — head-to-head
On L40S (the only GPU we have valid SGLang data for so far):
| Rate | vLLM TTFT | SGLang TTFT | vLLM Tput | SGLang Tput | Winner |
|---|---|---|---|---|---|
| 1 | 3004 | 2935 | 132.8 | 130.1 | SGLang TTFT |
| 4 | 3141 | 3213 | 514.2 | 505.0 | vLLM (slight) |
| 10 | 3574 | 4092 | 1087.7 | 984.5 | vLLM clearly |
| inf | 3460 | 3271 | 1108.0 | 1171.7 | SGLang clearly |
Hypothesis based on architecture:
- vLLM wins at medium load (rr=10) because its scheduler aggressively packs the running batch and uses chunked prefill to interleave new prompts with ongoing decodes. This avoids head-of-line blocking that SGLang faces.
- SGLang wins at rr=inf (1172 vs 1108 tok/s) because with all requests queued at once, its RadixAttention can detect that ShareGPT prompts share no common prefix anyway, so the radix tree adds zero overhead while the simpler scheduling is faster.
- Within ~5-10% on most metrics. For Llama-3.1-8B serving, the choice should be based on features (RadixAttention, structured output for SGLang; plugin ecosystem and disaggregated P/D for vLLM) rather than raw speed.
Q4: Why is ITL stable while TTFT grows?
The two phases have completely different cost structures:
- Prefill (TTFT): Each new request must be prefilled before it can decode. Prefill processes all input tokens at once — it scales as \(O(\text{input\_len})\). Higher request rate means more prefill jobs competing, which is what shows up in TTFT.
- Decode (ITL): Each step generates ONE token per active sequence in the batch. The cost is dominated by reading the model weights from HBM once per step, NOT by how many sequences are in the batch (up to a point). So ITL stays constant while throughput grows linearly with batch size — that's the heart of continuous batching.
In the data: L40S ITL went 23.47ms (rr=1) → 27.93ms (rr=10) → 27.03ms (rr=inf). The +4ms growth is from the larger active batch contending for compute (more attention work per step). H200 went 5.94→6.11→7.10ms, same pattern, smaller absolute growth because H200 is faster.
Practical consequence: If you care about per-request latency, lower rate is always better. If you care about aggregate cost-per-token, push rate as high as possible until ITL starts to climb noticeably (beyond ~30-50% growth). vLLM's continuous batching makes the trade-off favorable: 25× more throughput at rr=inf vs rr=1 on H200, while ITL only grows 20%.