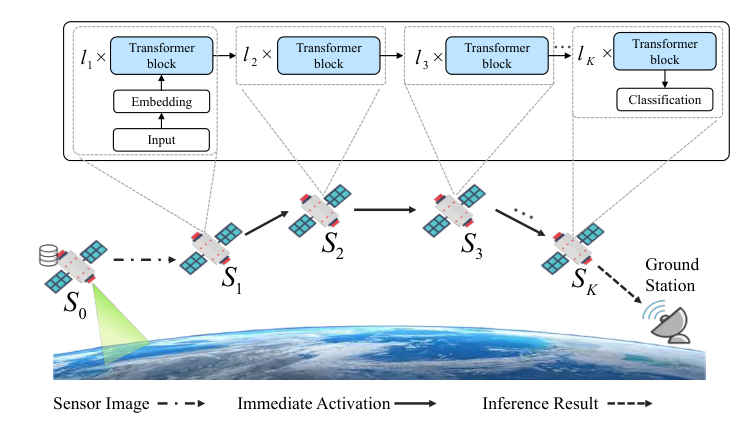
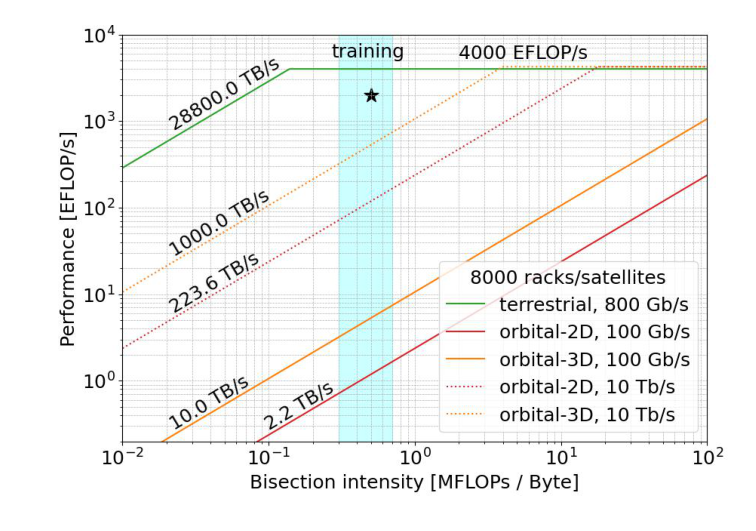
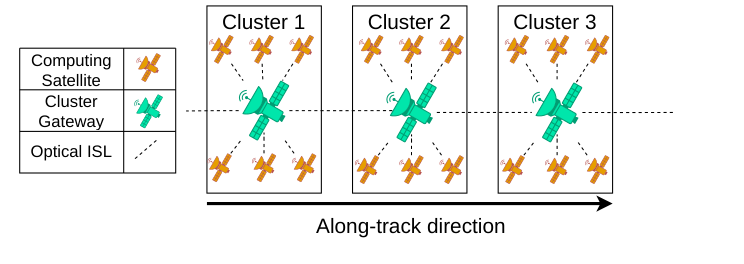
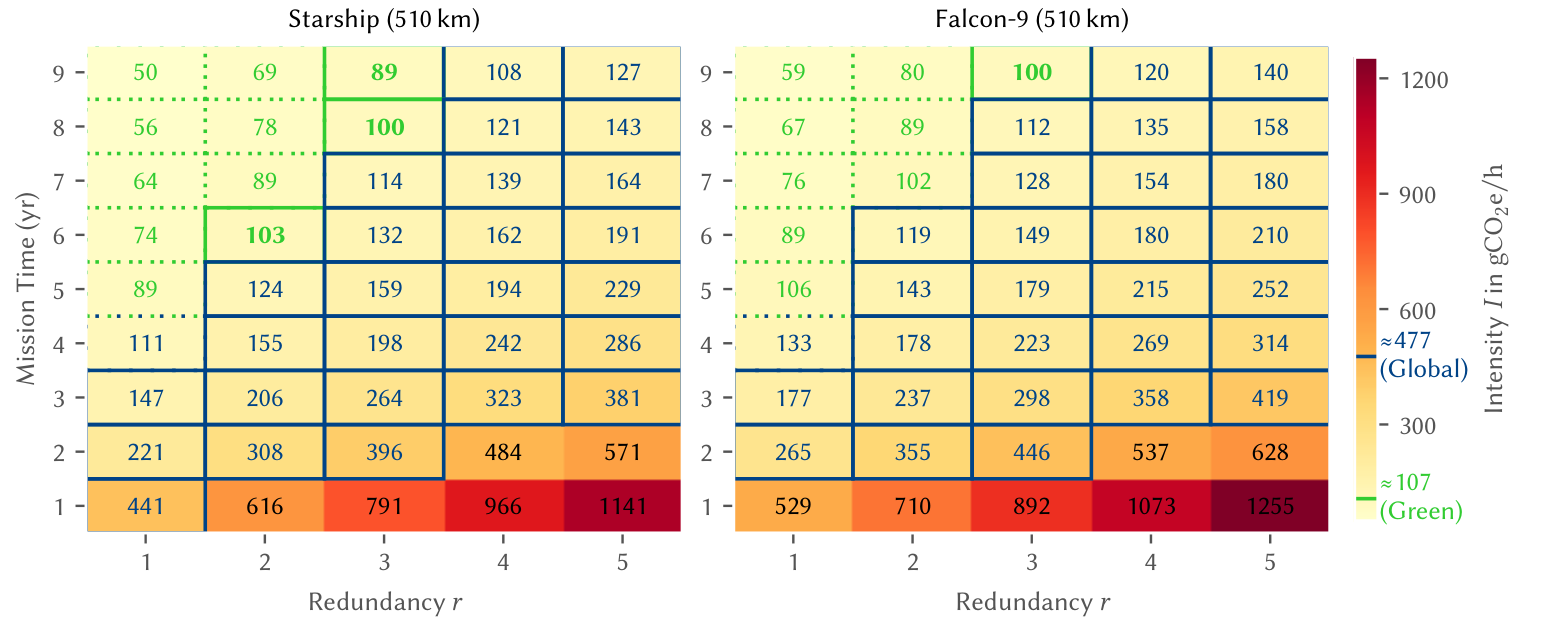
Large language models run inside datacenters whose internal network sets their speed. Several engineering programmes now propose putting such a datacenter in orbit, where sunlight is continuous and land costs nothing. This report works through the networking question that follows. Between accelerators on separate spacecraft, the links are optical paths that open and close on a schedule the orbit fixes in advance.
Two words carry most of the argument. A collective is one communication operation shared by many participants. AllReduce is the common example, where every participant contributes a value, the values are combined, and the result returns to all of them before the next training step begins. A fabric is the set of links, switches and control mechanisms that carries those messages.
The claim under test is this. Link availability changes on a schedule that can be predicted, and a collective or an inference request has dependencies that care about timing. Together those two facts create room for a network that reserves, places and recovers communication against a known future schedule. The claim holds only while such a network beats a strong terrestrial algorithm that receives the same links, the same workload and the same forecast. Matching job completion time, service quality and useful accelerator time across the physically credible range would settle the question the other way.
Results travel with their setting. A broadband measurement on a global constellation speaks for that access case. An optical analysis of a tight formation speaks for a local fabric. Carrying a number from one to the other calls for fresh accounting of distance, link count, pointing time, power and workload synchronization.
The next section gives the publication record behind this question and the three directions it opens.
Satellite networking at the top venues
Satellite networking became a regular subject at the top networking conferences two years ago. This section gives the shape of that record and the opening it leaves for AI workloads in orbit. The appendix analyses each paper.
The numbers
SIGCOMM is the main annual conference for computer networking. Its satellite papers run as follows.
Year
Satellite papers
All main-track papers
2022
1
57
2023
0
73
2024
0
62
2025
6
88
2026
4
109
2025 is the turning point, and 2026 added a session named Satellite and Non-Terrestrial Networks. Four papers out of 109 keeps the subject under four percent of the programme. The recent canon is short enough to read in full, and it is what a reviewer will have read.
Those ten papers cover four things. Measurement of commercial links through LeoCC and Dissecting the StarLink. Traffic engineering and constellation design through SaTE and TinyLEO. Placement of content and imagery through StarCDN and CoOrbit. Radio access and onboard processing through SN², CommSAR, Planet-Scale IoT and DeepSpace. They share one property. The traffic is paced by a person or a sensor and tolerates being slowed.
Other venues carry the rest. NSDI ran a satellite session in 2024. IMC and CoNEXT publish the Starlink measurement line every year. MobiCom carries six months of measurements aboard a satellite. HotNets sets the agenda about two years early, with position papers on the physical limits of LEO network scale and on the software challenges of space computing.
The other line at the same conference
Over the same years SIGCOMM filled with networks built for machine learning, from one paper in 2022 to thirty in 2026, more than a quarter of the programme. Those papers schedule collective operations, move cached attention state between serving nodes, and reconfigure optical fabrics around the workload. They assume a link that stays up, a capacity that holds, and a controller that owns the schedule.
Between two spacecraft the optical link has an end time written in the ephemeris. That single difference is what an orbital contribution has to answer for.
Satellite papers arrived in 2025. Networks built for machine learning grew every year and reached thirty in 2026. Work spanning both stays at workshop and preprint level.
Where orbital AI work publishes today
Satellite-to-ground systems already have peer review behind them. ACM Multimedia 2025 and SenSys 2026 each split a vision-language model between a small onboard model and a large one on the ground. OrbitalBrain trains an image model across a fleet at a smaller conference. The across-spacecraft case, where a model spans several satellites over inter-satellite links, stays at workshop and preprint level. Two preprints reach the state question directly, one striping a key-value cache across satellites and one ranking cache entries by importance inside a handover window.
What that opens
Each line answers half of the same question. The satellite line supplies contact schedules, measured link behaviour and byte budgets. The machine-learning line supplies collectives, cache movement and fabric scheduling. Three questions sit where they meet.
Commit cached state before a contact ends, weighing the bytes still pending against the moment the link closes. Carry a collective across a scheduled cut, finishing inside the window or handing over the chunks already committed. Decide what to keep aboard the satellite, driven by the request and bounded at the level of the answer, where CoOrbit already does the imagery version from the ground.
A 2019 space-standards recommendation already routes over a known contact plan, giving each contact a volume equal to its duration times its rate. The arithmetic transfers. What a new design adds is the computation waiting on those bytes, with local recomputation available as an alternative.
The rest of this page builds the substrate underneath. Orbits and contact schedules come next, then the byte volumes an AI workload moves, the power and heat a spacecraft carries, and three experiments with their stopping rules.
From orbit to an Internet path
This section builds the vocabulary required to read satellite-network papers. Each term corresponds to an observable physical constraint or a place where a networking system makes a decision.
Low Earth orbit (LEO) places a spacecraft relatively close to Earth. Orbital motion continually changes which ground locations it sees. A constellation is a coordinated population of satellites, commonly arranged in orbital planes. Altitude sets distance and orbital period. Inclination sets the tilt of a plane relative to the equator. Orbital phase sets a satellite’s location within that plane. A shell groups satellites with similar orbital parameters. These parameters determine coverage before routing begins. ESA’s orbit guide describes these orbit families and the role of sun-synchronous orbits.
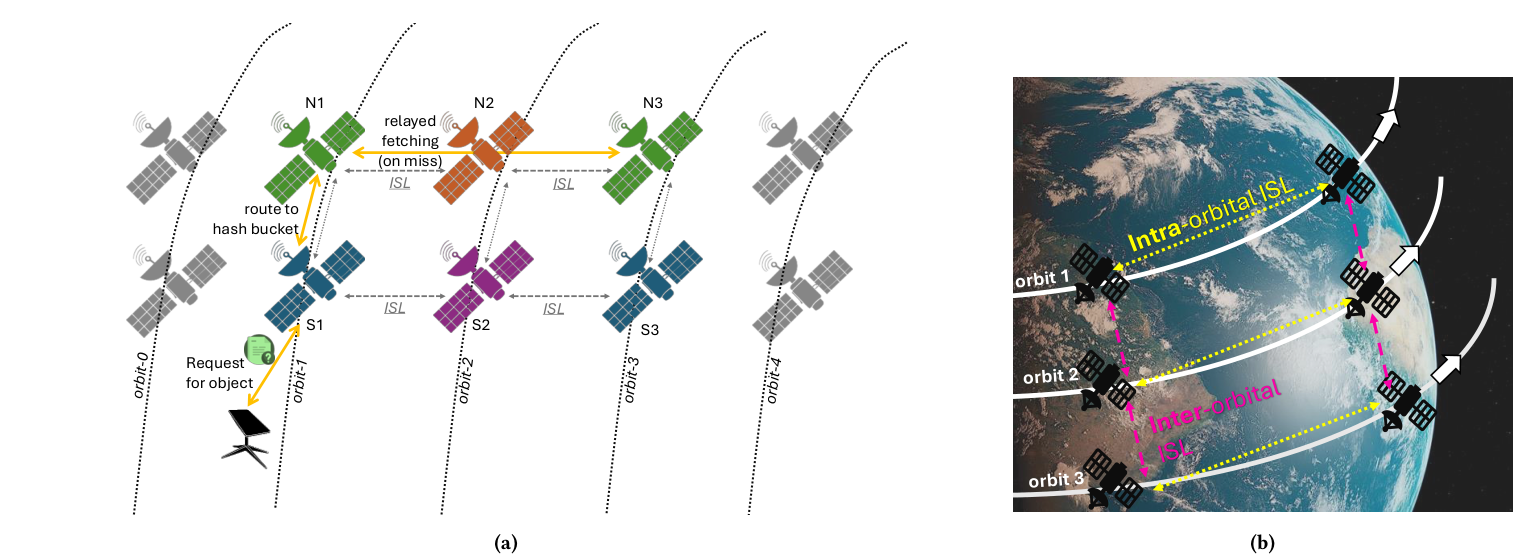
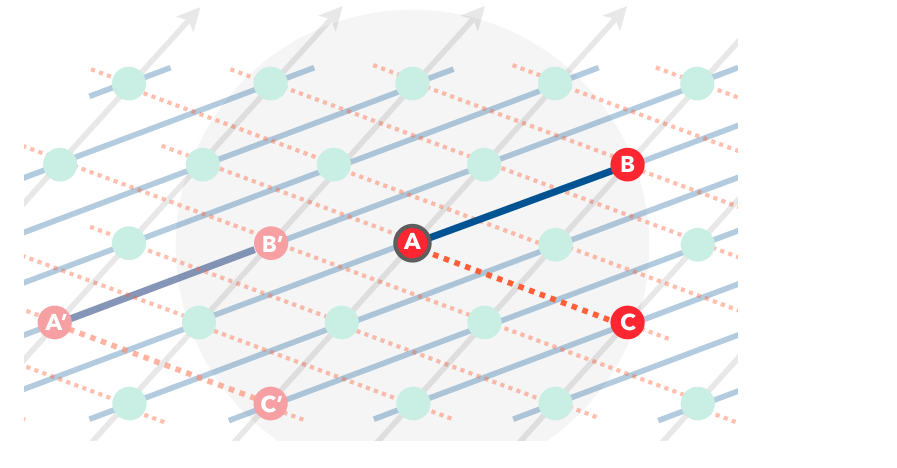
Orbital planes contain satellites following similar trajectories. An intra-plane ISL joins neighbors in one plane. An inter-plane ISL joins spacecraft in different planes. A +Grid topology assigns two along-plane neighbors and two neighboring-plane links when those links are physically legal. Polar seams, range limits and terminal availability determine the actual edge set. The diagram shows a local patch. Wraparound and seam rules complete a specific constellation. Hypatia and Motifs describe these graph constructions.
Blue joins along-plane neighbors. Orange joins neighboring planes. The constellation model supplies wraparound and polar-seam rules.
Vertical edges connect neighbors within an orbital plane. Horizontal edges cross planes. A routing algorithm sees the graph produced by the legal-link rules.
Walker notation i:T/P/F describes inclination i, total spacecraft T, orbital planes P and an inter-plane phase factor F. For example, 53°:72/6/1 specifies 72 spacecraft in six planes, twelve per plane, and the stated phasing convention. A Walker Delta and a Walker Star use different plane-spacing conventions. A reproducible experiment specifies its variant and epoch. A two-line element set (TLE) records mean orbital elements at an epoch. SGP4 propagates those elements into predicted positions. Geometry then yields visibility and potential contacts. CelesTrak’s TLE format supplies the field definitions.
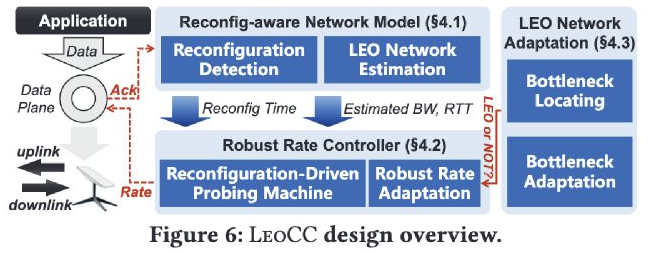
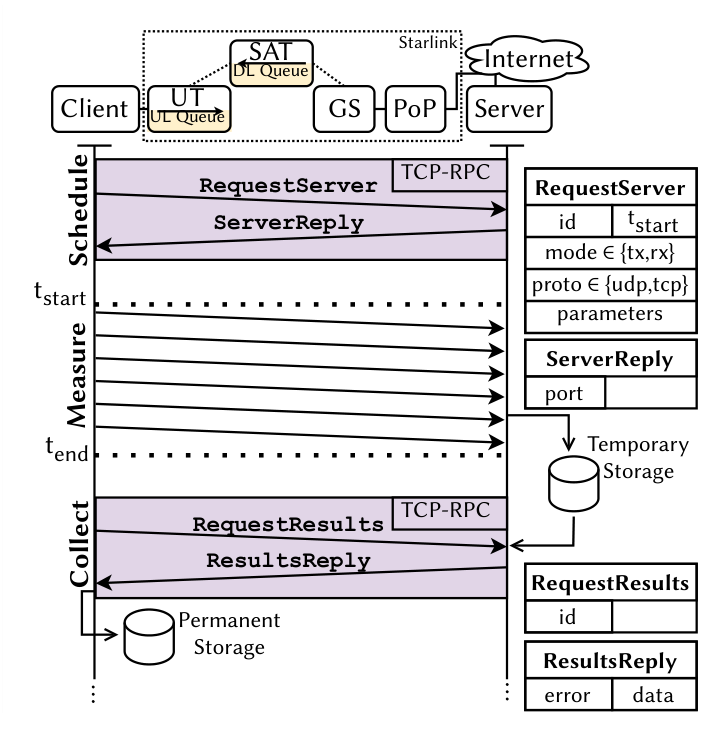
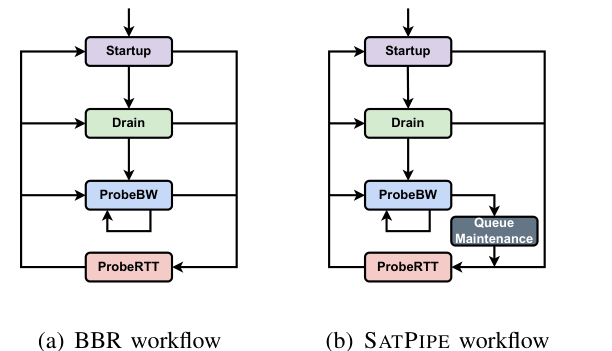
A recurring 15-second service reconfiguration is a measured Starlink control cadence in the reviewed deployments. Its boundary can update radio allocation or the service path. A spacecraft identity change needs additional telemetry. LeoCC, SATPIPE and Dissecting the StarLink use this observation with distinct transport and measurement methods. Treat the cadence as deployment evidence with date and location, and test propagation, capacity and queue changes separately.
This compact glossary defines the orbit, packet and compute terms used in the system figures and tables. The later modeling and AI sections develop the mechanisms behind these names.
Term
Expanded name
Role in the report
MEO / GEO
Medium Earth orbit / geostationary orbit
MEO lies between the LEO region and GEO altitude. GEO is an equatorial, circular, prograde orbit near 35,786 km with a sidereal-day period, giving a fixed ground direction.
Doppler
Carrier-frequency shift from relative radial motion
An approaching transmitter raises received carrier frequency. A receding transmitter lowers it. RF receivers compensate this shift for acquisition and synchronization.
RTT
Round-trip time
The elapsed time for a packet and its response. Propagation, processing and queues all contribute.
ECMP distributes flows among equal-cost routes. ECN marks packets to communicate congestion to endpoints.
NIC / RDMA / PFC
Network interface card / remote direct memory access / priority flow control
A NIC transmits packets. RDMA places data in remote memory through a transport. PFC pauses selected Ethernet priorities and can couple neighboring queues.
GNN
Graph neural network
A learned model aggregates features along graph edges. SaTE trains it with solver-generated allocation labels.
MPC
Model predictive control
A controller optimizes a future horizon, executes its first decision, and repeats with updated observations. Orbit forecasts supply future contact constraints.
LP / ILP / MILP
Linear / integer linear / mixed-integer linear program
LP uses continuous variables and linear constraints. ILP restricts decisions to integers. MILP combines integer and continuous decisions.
MDP / RL
Markov decision process / reinforcement learning
An MDP defines state, action, transition and reward. RL learns a policy from sampled interaction with that decision environment.
KV / HBM
Key/value cache / high-bandwidth memory
KV stores earlier attention keys and values during autoregressive inference. HBM is accelerator-local memory whose capacity constrains model and state residency.
NCCL / SLO
NVIDIA Collective Communication Library / service-level objective
NCCL executes GPU collectives. An SLO specifies a measurable target such as token delay or completion success.
A sun-synchronous orbit maintains approximately the same local solar time when crossing a ground location because its orbital plane slowly rotates with the annual Earth–Sun geometry. A dawn–dusk configuration places that orbit near the day–night boundary and can increase sunlight exposure under the mission’s geometry. Inclination and altitude determine ground reach and orbital behavior. The selected orbit therefore trades power availability against service access.
Radio frequency (RF) communication uses electromagnetic waves in a radio band. A user terminal is the customer’s RF endpoint. A gateway is a ground station linking the space segment to a terrestrial backbone. A point of presence (PoP) is the operator’s terrestrial interconnection or service location. A user packet may travel terminal → satellite → gateway → PoP → destination, or traverse several satellites before reaching a gateway. A bent-pipe payload forwards signals toward a ground endpoint. A regenerative payload processes traffic onboard. End-to-end delay therefore combines the access link, the space route, and the terrestrial route.
Term
Physical meaning
Networking consequence
RF access / feeder link
A radio link connects a terminal or gateway to a satellite.
Spectrum, beam scheduling, elevation, and interference constrain service.
ISL / OISL
An inter-satellite link (ISL) joins spacecraft. An optical ISL uses a laser.
Line of sight, terminal count, pointing, and acquisition set feasible edges.
PAT
Pointing, acquisition, and tracking align and maintain an optical beam.
A geometric contact becomes usable after terminal setup and stabilization.
Ephemeris / contact
An ephemeris predicts position over time. A contact is an interval of usable communication.
The controller can schedule routes before a link transition.
Elevation mask
A ground station accepts satellites above a specified angle over its horizon.
The visibility window and slant range depend on the chosen threshold.
A link budget accounts for transmitted power, propagation loss, receiver optics or antenna gain, and the signal quality required by a modulation format. In free-space optics (FSO), a beam expands with distance, so aperture size, divergence and pointing error influence received power. A radio beam similarly distributes finite spectrum and power among terminals. The resulting usable payload capacity also reflects coding and framing overhead. NASA’s communications chapter describes RF and optical subsystem choices. A queue buffers arriving packets while the outgoing link serves earlier packets. Queueing delay measures that waiting time.
Blue: ground access. Purple: space endpoints. Orange: the packet route. Gray: terrestrial transit.
A packet path spans radio access, optional optical forwarding, and terrestrial transit. Each layer contributes delay and a separate source of capacity variation.
Here h is altitude in meters, Earth radius R_E is approximately 6.371×10⁶ m, gravitational parameter μ_E is approximately 3.986×10¹⁴ m³/s², path length ℓ is in meters, and light speed c is approximately 2.998×10⁸ m/s. A circular 550 km example yields about 95.5 minutes per orbit. An ideal overhead 550 km hop yields 1.83 ms one-way propagation. Two such space-ground hops yield 3.67 ms. These are calculated geometric components. Processing, slant range, queueing, return paths, and terrestrial transit enter the measured latency separately.
The latency budget should separate propagation, serialization, processing, queueing, and waiting for a contact. Serialization sends S bytes over a C bit/s link in 8S/C seconds. A fast laser can reduce serialization while keeping distance-dependent propagation. A gateway change can shift terrestrial transit even when the user’s satellite range varies smoothly. This layered view is the first tool for interpreting broadband measurements.
Five deployment codes
Every paper on this page carries a letter. The letter says where the application sits and how often the links are available, because those two facts decide which capacity model applies. Four letters name a population of spacecraft. The fifth names the path to the ground, which the other four all share.
Reading a result across letters calls for care. A broadband number measured on a communication constellation describes that access case. An optical analysis of a tight formation describes a local fabric. Moving a number between them means recounting distance, link degree, pointing time, power and workload synchronization.
Code
What sits where
Link availability
What limits it
A · Communication constellation
Users stay on the ground and the satellites forward their traffic. Phones, fixed terminals and sensors receive broadband, direct-to-cell or IoT service.
Radio access follows gateway windows. Inter-satellite links follow whatever the operator or the model provides. An IoT system can hold data and forward it at the next contact.
Radio allocation, handover, queues and gateway capacity. SpaceCore, LeoCC, SN², SaTE, TinyLEO, Planet-Scale IoT and CosMAC sit here.
B · Tight AI formation
Accelerators fly in a dedicated local formation and talk over short optical hops.
Neighbours keep their identity while the range between them shifts. Terminal count and the time to acquire a beam both bound what the formation can carry.
Collective service, pointing, optical electronics, power and heat. The space-based design study sits here.
C · Space to ground path
Any of the other four exchanges prompts, data, model state or checkpoints with services on the ground. This code names that path rather than a population.
Gateway access, the choice of relay shell, weather at the ground station and transit across the terrestrial wide area.
Ingress and egress, admission, and keeping state continuous across a handover. The connectivity study and StarCDN sit here.
D · Distributed orbital compute mesh
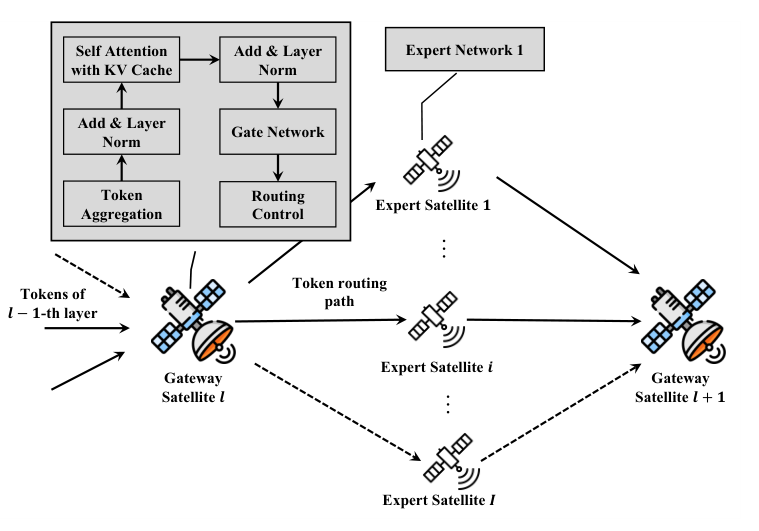
Separated spacecraft hold different parts of one model, so experts or pipeline stages live on different satellites.
Long inter-satellite links with a limited number of terminals per spacecraft. Each compute-to-compute edge follows its own range and availability.
Propagation, the capacity of a cut through the mesh, uneven compute and where the experts sit. SpaceMoE sits here.
E · Observation and contact fleet
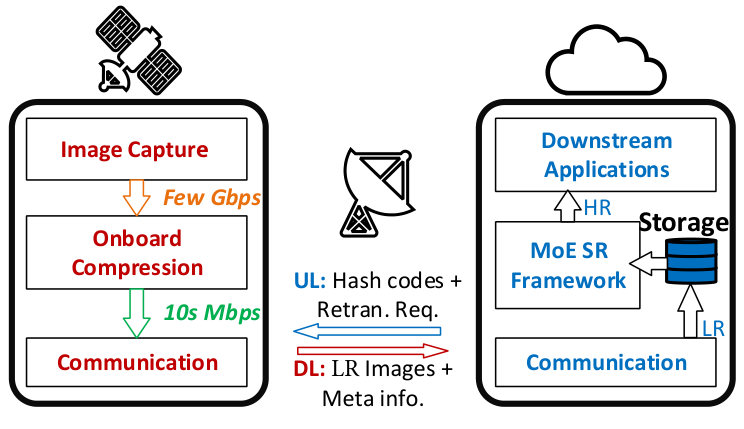
Sensors produce imagery or tasks, and onboard compute reduces or schedules what eventually goes down.
Sparse ground contacts dominate. Whether inter-satellite links exist depends on the individual design.
Storage, when the observation happens, task quality, battery and the downlink window. CoOrbit, DeepSpace, Serval, SpaceSched, PHOENIX and OrbitalBrain sit here.
Users sit on the ground and forwarding happens in orbit. The operator's radio and link policies decide the usable graph.
A local formation acts as the accelerator fabric. Optical setup, terminal electronics and the physical budget set its capacity.
This path layer is shared by the four populations. A relay constellation and a compute formation occupy different layers of the same graph.
Application endpoints sit on separated spacecraft, so expert and stage traffic crosses the orbital graph.
Observations, local storage and intermittent delivery join up. A design with inter-satellite links carries its own edges and capacity.
Each paper card below carries its letter. A result about protocol access speaks for the service path. A result about scheduling an observation speaks for observation and delivery. A result about an optical formation speaks for a local fabric.
Time-varying graphs and contact schedules
The next step turns motion into a networking model. A time-varying graph expresses instantaneous connectivity. A temporal graph expresses which sequences of transmissions can actually finish.
Let G(t)=(V,E(t)) represent spacecraft, gateways, and relevant terrestrial endpoints. Each edge has capacity C_e(t), propagation delay d_e(t), setup time τ_e, and a validity interval. A snapshot computes a route at a selected instant. A packet using that route later sees updated positions and queues. Snapshot intervals should resolve the shortest important transition, and a convergence study should show whether finer intervals change the result. A contact schedule can instead give each edge an explicit start, end, and deliverable byte budget.
B_e is usable contact capacity in bits when setup occupies the first τ_e seconds and the interval satisfies a+τ_e≤b. C_e is usable payload bit/s after framing overhead. f_e^k is commodity k’s allocated bit/s. A route can satisfy instantaneous capacity yet miss its deadline. Temporal feasibility additionally checks when each hop receives and forwards the data.
A time-expanded graph creates a copy (v,j) of each node at discrete time j. Transmission edges move data between spacecraft and forward in time by the transfer delay. Storage edges keep data on one spacecraft until the next slot, subject to buffer limits. An earliest-arrival path finds the first feasible destination arrival. A temporal min-cut bounds bytes deliverable by a deadline. Contact graphs offer a more compact representation when communication windows are sparse. The model should state whether it permits storing an entire object, packet streaming, or pipelined forwarding, since these choices change earliest-arrival time.
Gray: storage through time. Orange: transmission with arrival delay. Labels identify node and slot.
The vertical dimension tracks physical nodes and the horizontal dimension tracks time. Storage edges make waiting explicit. Diagonal edges represent transmissions that consume both capacity and time.
Predictability has a scope. Orbital geometry offers a forecast. Equipment faults, demand bursts, atmospheric attenuation, and pointing residuals require measured distributions or uncertainty bounds. A useful controller combines the scheduled component with feedback and reports sensitivity to timing and capacity error. Treating predicted connectivity as an input with confidence intervals supports a stronger experiment than treating every edge as perfectly known.
Consider a 2 MB atomic object ready at A at t=0. A direct A→C contact offers 10 Mbps during [0,1] s, giving 1.25 MB of deliverable capacity. A snapshot may prefer this one-hop route by propagation distance. The temporal route instead uses A→B at 20 Mbps during [0,1], stores the completed object at B, and uses B→C at 20 Mbps during [2,3]. Each hop serializes for 0.8 s and arrival is t=2.8 s. This hand calculation sets propagation and processing to zero and assumes complete-object store-and-forward with a 2 MB buffer. A packet-streaming model receives its own timing calculation. The numerical example instantiates the storage edges in the time-expanded figure.
Six satellite-network control problems
The graph model exposes separate control problems. Routing chooses paths, traffic engineering distributes demand, handover changes attachments, congestion control changes sending rates, and resource allocation establishes the capacity available to those decisions.
Problem
Formulation
Design family
Critical baseline and metric
Topology control
Choose links subject to terminal degree, geometry, acquisition, and power.
Strong sequential allocation. Useful work per joule and constraint violations.
Routing and traffic engineering optimize different objects. A shortest path for each demand can congest a shared latitude band or gateway. Traffic engineering considers those demands together and may trade a longer route for lower queueing. A predictive design must charge for route churn, version distribution, stale forwarding, and packet reordering. In a flowlet design, the gap that triggers a path change should exceed the path-delay difference sufficiently to preserve the required ordering behavior.
Handover combines a physical transition with a logical continuity problem. A terminal may change satellites. A satellite may change gateways. A service may move its compute endpoint. These events can change RTT, address anchoring, queue occupancy, and the location of application state. An LLM request additionally carries a key–value cache and token-generation progress. A paper should identify which of these events its handover mechanism handles and which state it transfers.
Transport sees several causes of rate variation through a small set of signals. Increased RTT can reflect distance, a gateway change, or queue growth. Packet loss can reflect congestion, RF impairment, or transition disruption. Separating these causes is an identification problem. A schedule-aware transport proposal needs tests with independent propagation, capacity, and queueing changes, followed by combined events. The literature mechanisms in the appendix can then be compared by the information they observe and the action they control.
An access transition and an application-state transition are separate decisions. Request routing can preserve a resident KV cache while changing the path that reaches it.
For a worked handover example, assume a 1.074 GB KV state, a 1 Gbps usable state-transfer path and a sequential 20 ms activation interval. Full state transfer takes 8.592 s, producing an 8.612 s state-and-activation budget. If an earlier contact stages a consistent 95% of state, the remaining 53.7 MB takes 429.6 ms. The same activation interval gives 449.6 ms. A 0.5 s contact delivers 62.5 MB at the assumed rate, enough for that remainder. These are byte-accounting assumptions for the toy example. A real experiment verifies the KV version, transfer overlap and measured token gap, and gives the forecast-aware serving baseline the same pre-staging opportunity.
The terrestrial comparison and its operating assumptions
Terrestrial networks provide algorithms and implementation techniques for the orbital problem. Their applicability depends on which assumptions about paths, clocks, capacity, and state remain valid in the selected regime.
Dimension
Terrestrial baseline
Orbital operating condition
Experimental consequence
Connectivity
A wired fabric has fixed physical endpoints. Optical circuits may reconfigure.
Visibility, geometry and PAT jointly determine usable contacts.
Compare against reconfigurable optical fabric algorithms with matched setup costs.
Capacity
Port rates provide a nominal budget. Shared queues determine payload service.
Link budget, terminal assignment and spacecraft power can change the budget.
Measure available payload service over time and model correlated reductions.
Delay and control
Rack-scale propagation supports fast centralized or distributed reactions.
Wide-area paths and contact transitions may outlast a control reaction. Local formation paths may be short.
Report decision time, feedback age and future-information advantage.
Failure and maintenance
Operators replace components and isolate failed links or devices.
Remote recovery, spare capacity and radiation-induced events shape continuity.
Evaluate software recovery plus lost compute and checkpoint traffic.
Energy and heat
A facility power/cooling system supplies a managed operating envelope.
Arrays, batteries and radiator geometry establish a spacecraft envelope.
Keep energy and thermal constraints identical across scheduling baselines.
The strongest comparison retains the mechanisms of a terrestrial AI network: collective scheduling, topology-aware placement, adaptive load balancing, receiver admission, congestion feedback, and fault recovery. It then gives these algorithms the orbital schedule available to the proposed system. Any remaining advantage can be attributed to the new treatment of temporal dependencies or physical resources. Static ECMP alone is usually an informative reference point. An adaptive and schedule-informed comparator makes the causal claim sharper.
The named baselines below make the experiment executable. Their faithful configurations and explicit orbital extensions form separate comparisons, so the measurement can isolate forecasting, topology adaptation and collective scheduling. Every extension receives the same forecast information and pays the same physical transition costs.
Run nccl-tests and real training with a recorded NCCL version, rank map, message size, dtype and protocol. Ring and tree forced configurations diagnose the algorithm. Automatic selection supplies the production-style library comparator.
Give each configuration the same physical service trace and byte-correct collective. Compare p95 step time, delivered bytes, tail stalls and control overhead. A schedule-informed rank/group placement variant receives the same future contacts as the proposed system.
The released synthesizer uses communication sketches, profiled latency/bandwidth, routing MILP, ordering and exact scheduling. Its source evaluated NCCL v2.8.4-1. A fresh experiment pins and reports its available software versions.
Include a faithful fixed-topology schedule for each stable interval, plus a clearly labeled epoch-resynthesized extension under the same forecast. Charge synthesis time, installation, queue drain and interrupted chunks. Compare completion/correctness at matched degree and usable capacity.
Alternate parallelization search and degree-limited topology/routing search. The faithful baseline keeps a job’s topology fixed. The paper’s OCS-reconfig comparator updates circuit matching from demand at a configured refresh interval.
Restrict every candidate edge to the same range, line of sight, terminal concurrency and forecast. Compare fixed-interval TopoOpt and explicitly labeled epoch-adaptive TopoOpt/OCS-reconfig. Charge identical acquisition time and terminal power. Report the same task graph and common convergence target.
Choose compute, model averaging and data transfer from profiled utility and resource budgets. Its image-model adaptation supplies a training-scheduler precedent.
Declare the adaptation from local model averaging to the actual LLM training semantics. Give the planner the same forecasts, memory, energy and legal transfers. Compare common-target convergence separately from per-step collective completion.
The terrestrial reference fixes accelerator hosts and exposes the network topology as a programmable resource. Orbital adaptation changes the admissible edge schedule and its costs, while preserving each baseline’s collective semantics and hardware budget.
The 2024–2026 literature makes the orbital novelty claim substantially narrower and more useful. Temporal collective optimization, schedule swapping, bandwidth-adaptive KV compression, ordered endpoint mobility and topology-aware expert dispatch each have current primary-source implementations or analytical models. The comparison below includes twenty-one terrestrial AI/fabric works and one optical-terminal comparator. Its evidence column distinguishes measured application execution, trace replay, emulation, simulation and synthesis runtime. The residual column specifies the extra orbital mechanism to investigate.
Centrally managed GPU training clusters synthesize collective schedules for a known topology and finite communication demand.
Epoch-indexed chunk buffers, transmissions and in-flight state already express temporal collective capacity. AllGather uses MILP and AllToAll uses LP. Bounded-horizon optimization carries progress between rounds.
Published PDF. Schedule-model experiments plus real execution on 32 AMD GPUs. The synthesizer can require hundreds of GB of memory and hours at larger scales.
Feed the same contact-capacity matrix and horizon to TE-CCL. Test terminal acquisition, delayed agreement and deadline-safe in-flight completion with charged solver cost.
Cloud providers manage collectives across tenant GPU jobs while preserving an application-facing NCCL-like interface.
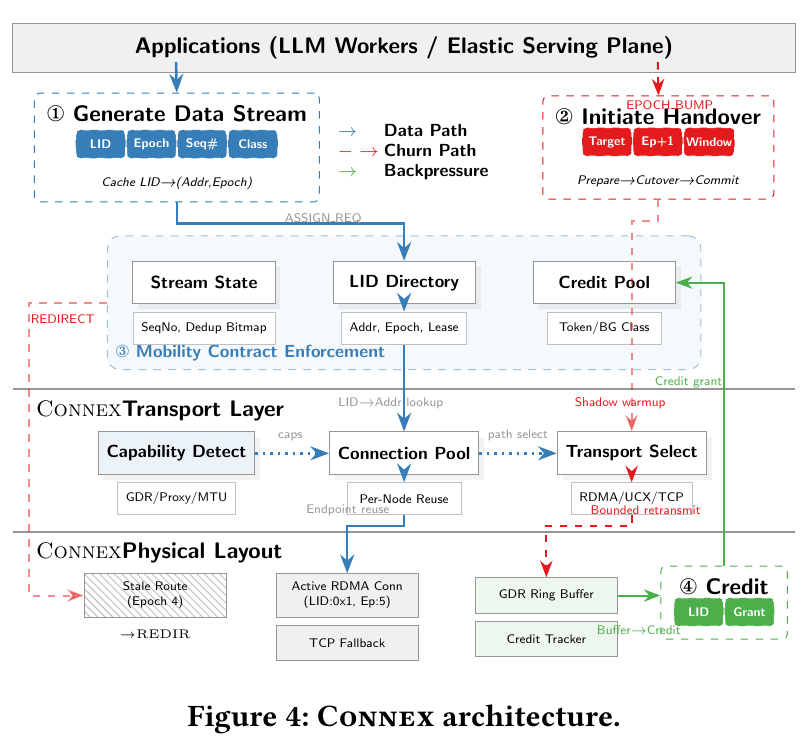
Provider services manage collective RDMA flows. A sequence-number AllGather establishes the common drain prefix before connection rebuilding.
Published PDF. Eight RTX 3090 GPUs on four 100 Gbps hosts, training-trace replay, and a separate 768-GPU flow simulation. Small messages pay 50–80 μs service latency.
Equip the service with the shared forecast and the same routing choices. Measure contact-expiry consistency and receiver resource reuse through actual training execution.
Multi-job training clusters share inter-host paths and PCIe resources. The operator targets aggregate useful GPU computation.
Compute intensity and overlap correction determine communication priorities and least-congested paths. A compressed switch-priority DAG realizes the allocation.
Published PDF. Real training on 96 A100 GPUs and production-trace simulation for 2000+ GPUs. Aggregate utilization gains trade against some individual job completion times.
Supply the same future capacities and workload profiles. Test release/deadline constraints and energy-driven compute availability using both step tails and job fairness.
Long-running GPU applications select among custom collective schedules as expert loads, NIC health and synthesis quality evolve.
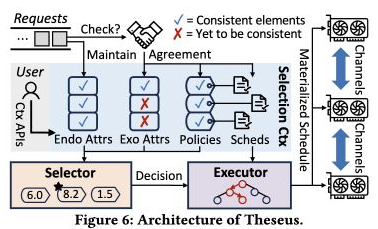
Runtime attributes, common-context agreement and hot-swappable schedules already adapt collectives to skew and degraded NICs. Lazy resource migration preserves reusable state.
Official full conference reader. Real Qwen MoE and Llama training on 32 A100 GPUs. A reported 1.73× communication gain accompanies about 1.07× Qwen training gain in its scoped experiment.
Use contact/health forecasts as exogenous attributes and share candidate schedules. Test progress agreement during control partitions and contact-deadline-safe swaps.
LP routing separates spatial allocation from finite-chunk scheduling. Feasibility cuts and symmetry improve synthesis scalability. Lifetime-average link capacity supports the routing model.
Author conference PDF. Simulated schedule quality and measured CPU synthesis runtime. GPU application execution remains a distinct validation stage.
Run a temporal-capacity adapter with matched solve budget. Test finite contact deadlines, propagation-sensitive realizability and measured workload execution.
AllReduce on bidirectional rings and regular multidimensional direct-connect tori, including TPU-like topology families.
Simultaneous peers at ±3^k distances reduce AllReduce startup stages on regular multiport graphs. Full-vector and ReduceScatter/AllGather variants trade latency against bytes.
Full arXiv 2602.17254 plus official venue identity. Packet-level SST simulation on stable rings/tori. Hardware reduction and training provide subsequent evidence.
Evaluate both variants on each feasible stable slice. Attribute gains to deadline/membership handling after equalizing available degree, capacity and propagation.
Long-lived TCP flows traverse recurrent electrical/optical time-division paths with sharply different bandwidth and RTT.
Recurring paths retain separate congestion, RTT and in-flight state inside one sequence space. Tagged notifications and ACKs support transition-aware recovery.
Published PDF. Linux 5.8 endpoints with Etalon/Click emulation and 20× time dilation. Primary workloads are long flows across two recurring path regimes.
Provide identical path announcements and forecasts. Test congestion-state aging over contact gaps and partial-window deadline goodput under orbital RTT.
An actual optically switched rack implements periodic connectivity and multi-hop Opera forwarding through commodity Linux endpoints.
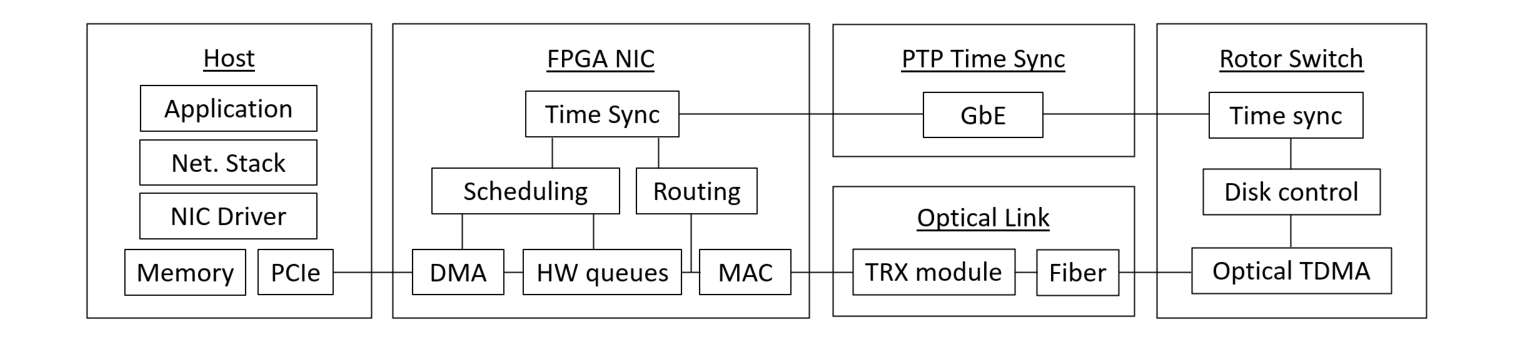
A physical rotor switch plus PTP-synchronized FPGA NIC queues realizes periodic matching, guard masks and multi-hop routing.
Published PDF. A 128-port manufactured switch and a 16-server 10 Gbps/lane cluster validate optical timing, throughput and queues.
Reuse the full-stack timing methodology. Replace rotor timing with measured orbital PAT, terminal concurrency and contact service, then validate application tails.
Opera-like varying-expander fabrics retain multi-hop routes during microsecond optical reconfiguration and carry general datacenter traffic.
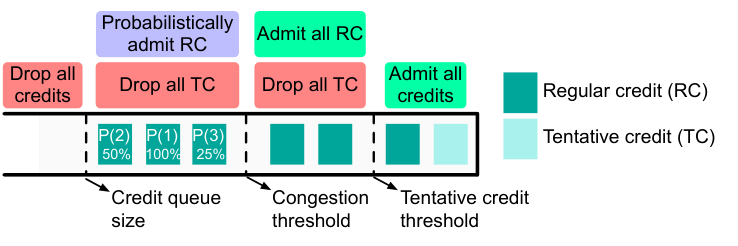
Receiver credits preserve reverse credit–data path symmetry across scheduled circuits. Tentative credits, RTT slots and hop-aware priorities improve utilization.
Published PDF. 648-host htsim evaluation plus a four-server/three-Tofino2 40 Gbps prototype. Hardware validates scoped queue and fairness behavior.
Share the contact schedule and compute round-trip feasibility. Measure asymmetric contact service and collective-critical credit priorities against the faithful protocol.
Repeated long contexts are reused across terrestrial LLM serving requests through compressed KV bitstreams fetched from storage or another worker.
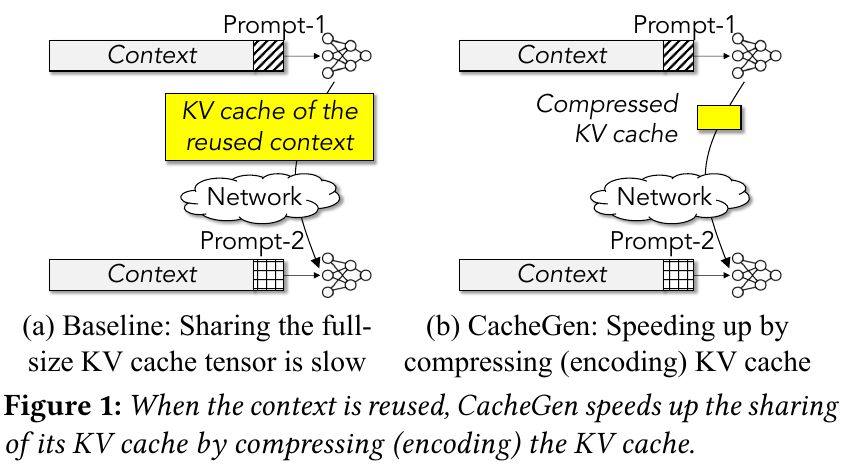
Token-delta encoding, layer-sensitive quantization and arithmetic coding compress KV. The chunk streamer already adapts compression versus text recomputation to bandwidth.
Published PDF. Four A40 GPUs, 662 long contexts and measured random-bandwidth streaming. The main result uses 3 Gbps at matched task quality.
Share codec options, profiles, model quality and contact forecasts. Test committed state completion before contact expiry and interrupted-transfer repair.
Terrestrial PD-disaggregated serving and prefix-cache offloading select KV compression by workload quality and service latency.
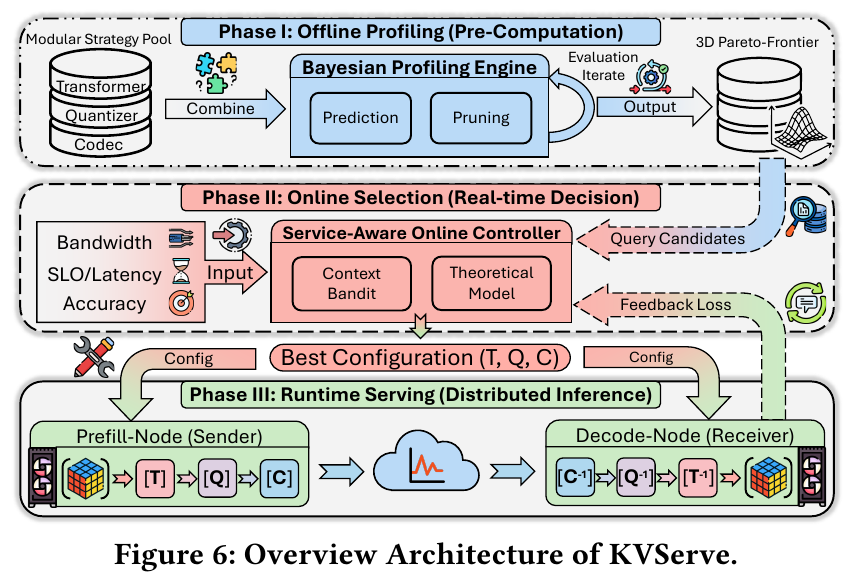
Service-aware compression already uses a quality/ratio/throughput Pareto frontier, an analytic benefit boundary, a small bandit and latency-residual adaptation.
Measured full-text version arXiv 2605.13734. Official conference identity. vLLM serving spans 10/50/100 Gbps and multiple GPU tiers with held-out quality datasets.
Give the controller the shared contact forecast and compression budget. Test joint contact admission, placement, battery/thermal cost and commit recovery.
Multi-turn agentic inference reloads high-hit-rate KV state from SSD-backed distributed storage into separate prefill and decode workers.
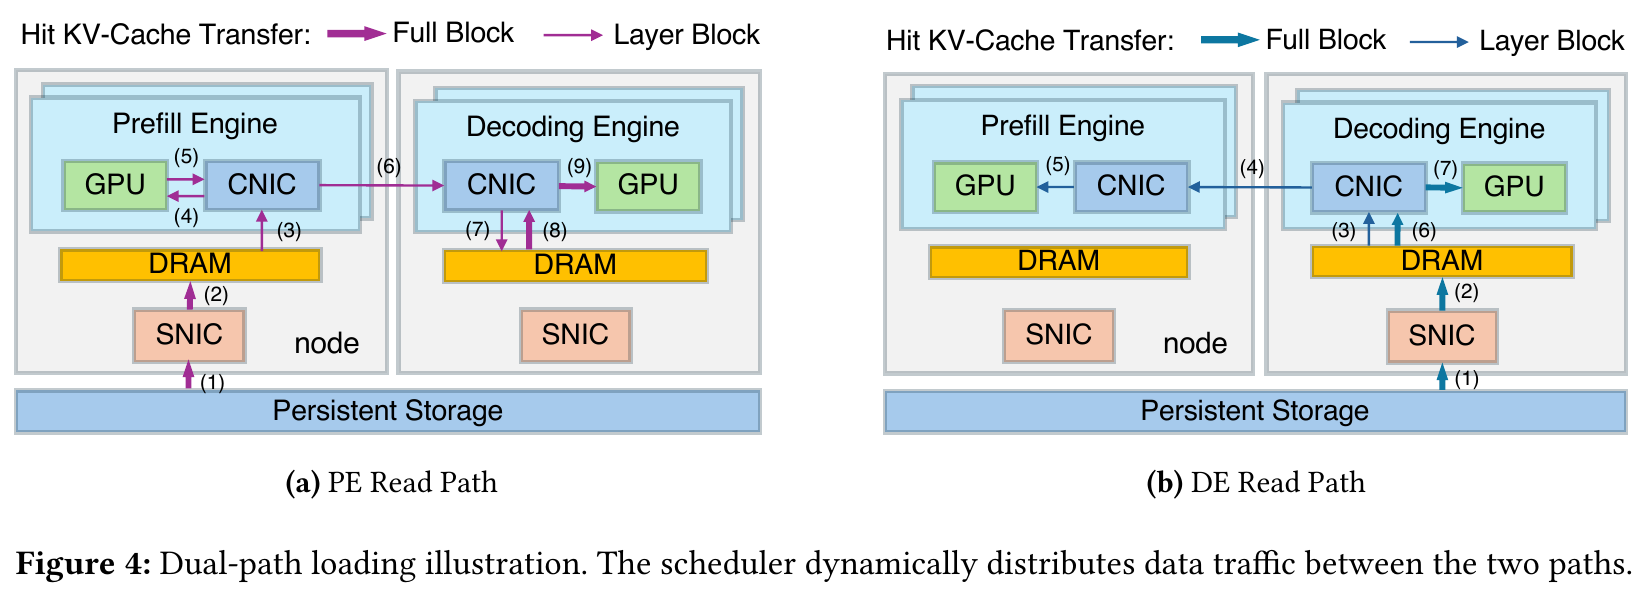
KV loads use storage→prefill and storage→decode→prefill paths. CNIC traffic isolation, global storage routing and compute quotas exploit spare compute-fabric bandwidth.
Measured version arXiv 2602.21548v2, 26 February 2026. Updated conference title verified. Large-scale agentic experiments reach 1152 Hopper GPUs.
Charge every relay hop to the shared ISL budget and preserve model-critical traffic. Test relay feasibility before expiration with matched storage and memory placement.
Author camera-ready PDF and complete official reader. Five servers with 20 A40 GPUs test PD/PP serving churn and continuity.
Share migration opportunities, forecasts and link traces. Test state-byte admission and commit before predicted separation with delayed or partitioned control.
Distributed sparse-MoE training can choose an expert-centric token exchange or a data-centric expert-weight fetch for each MoE block.
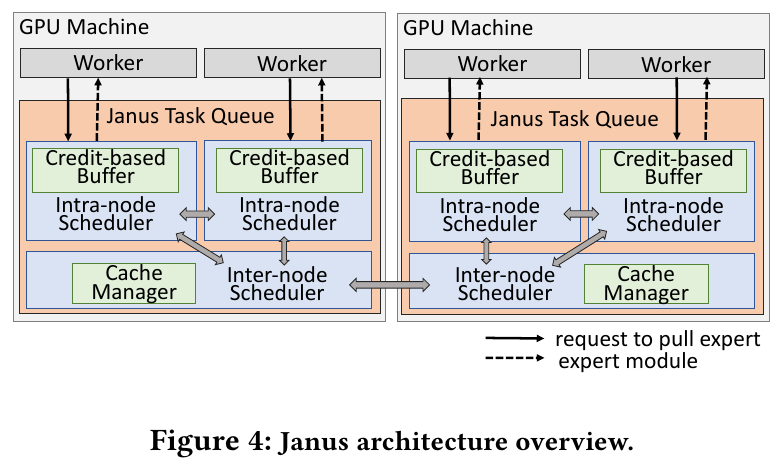
MoE training selects tokens-to-experts versus weights-to-tokens by communication-volume ratio. Expert caches, prefetch and merged gradient return already reduce traffic.
Published PDF. 32 A100 GPUs on four 200 Gbps hosts train MoE-BERT/GPT/Transformer-XL. Standard iteration gains and the variant maximum have separate scopes.
Make the ratio-based choice contact-feasible with the shared forecast. Charge expert refresh, dispatch/combine and backward gradients under common freshness semantics.
MoE inference dispatch on hierarchical superpod fabrics exposes globally addressable memory and low-latency remote access.
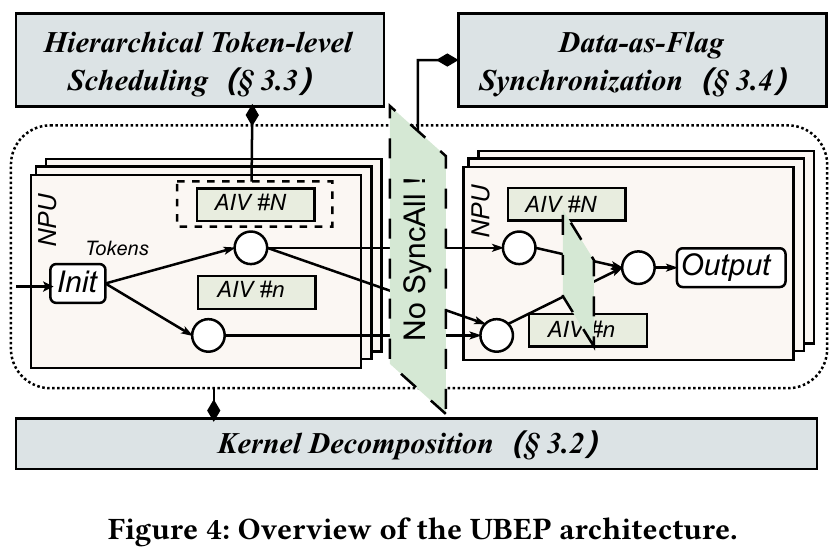
MoE inference dispatch decomposes dependencies on vector cores and schedules hierarchical token hops. Data-as-Flag relies on globally addressed atomic-memory semantics.
Conference-formatted arXiv 2607.06202v2. 256 Ascend NPU dies on 16 servers. Same-platform dispatch latency and end-to-end TPOT have distinct result scopes.
Transfer topology-aware pipelining through an explicitly priced message-readiness protocol. Test expiring-contact dispatch with reliability, ACK and epoch costs included.
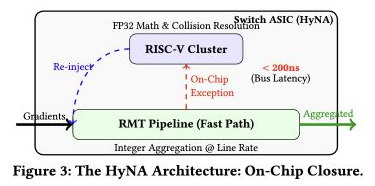
Terrestrial training gradient AllReduce uses in-switch accumulation with a fast integer pipeline and embedded exception cores.
MoE training gradient AllReduce combines line-rate INT32 accumulation with RISC-V exception recovery for collisions and FP32 overflow. Expert dispatch is a separate phase.
Complete official reader. 100 Gbps FPGA, two physical generators replaying 256 logical workers, ASIC synthesis and separate dense-model convergence checks.
Match aggregation precision, SRAM, exception cost and energy. Test partial-gradient lifetime, onboard recovery and contact-aware acknowledgments separately from EP inference.
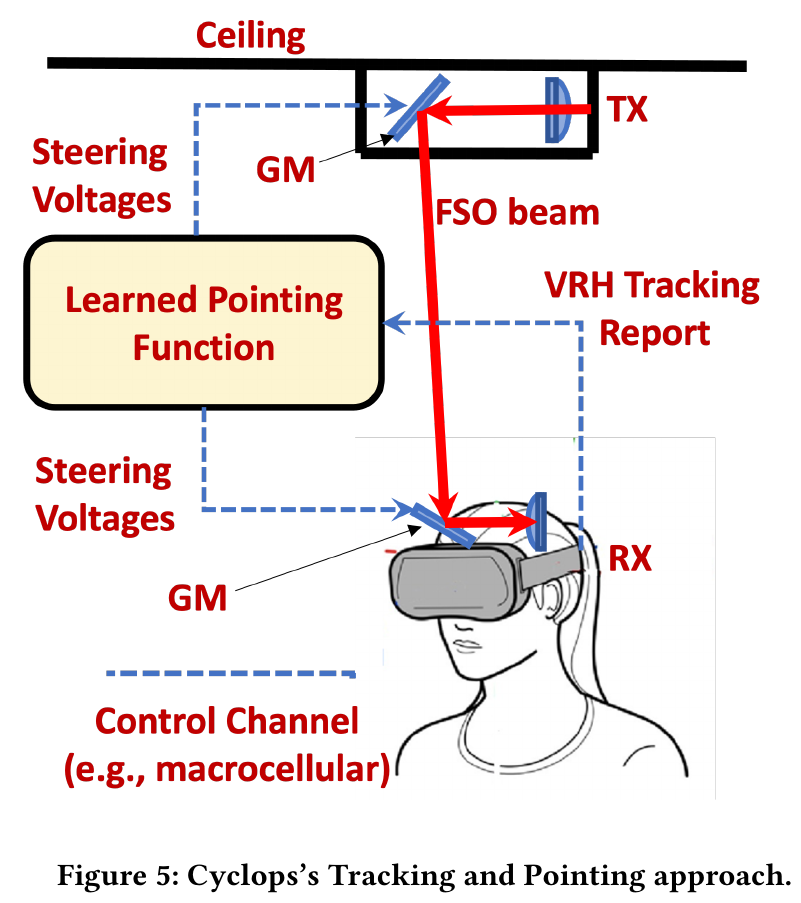
Published PDF. 1.5–2 m 10G/25G prototypes measure 9.4/23.5 Gbps, with separate 500-head-motion-trace connectivity simulation.
Reuse pointing calibration and error decomposition. Establish orbital range, attitude jitter, solar background, acquisition and terminal power through orbital component evidence.
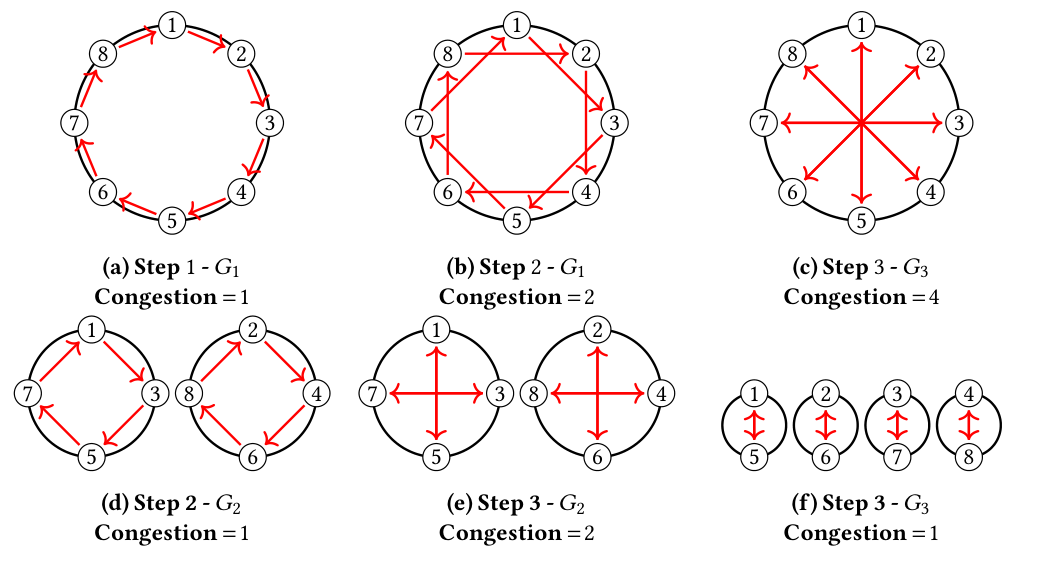
Photonic scale-up domains with typically 8–64 GPUs, predetermined step-wise collective traffic, bounded per-GPU optical port degree, and GPU multi-hop forwarding. A synchronized controller can choose each topology and the reconfiguration instants.
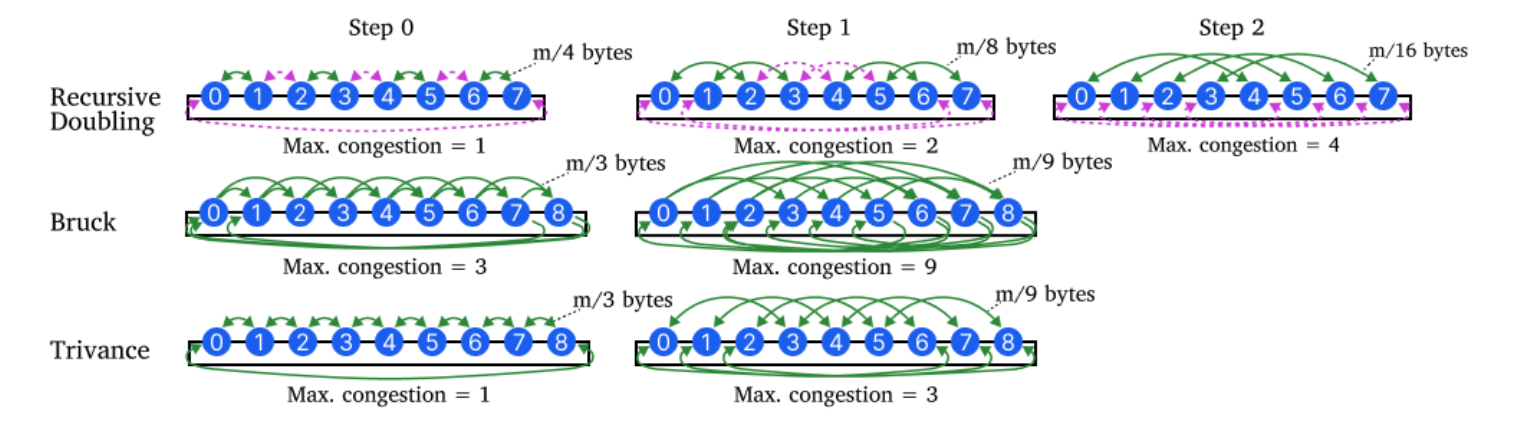
Partition collective steps into contiguous intervals. Each interval receives one optimized topology from a degree-constrained maximum-concurrent-flow MISOCP. A dynamic program chooses interval boundaries and then the reconfiguration count. Recursive Doubling connectivity and interval-topology structure yield an analytical subproblem with polylogarithmic schedule synthesis and cached schedules.
Author-hosted ACM-format PDF, 25 pages. Full primary text reviewed. ASTRA-sim packet-level extensions, flow/numerical optimization, and an eight-GPU emulation testbed cover 8–64-GPU scale-up domains. Analytical Recursive Doubling runtime scales to 1024 modeled nodes. Simulated ports use 800 Gb/s. The eight BlueField-3 NICs use 100-Gb/s optics and GPUDirect RDMA. NCCL operations execute step by step. Measured runtimes are summed with a supplied fixed switch penalty. Reconfiguration latency spans 10 ns–10 ms.
Provide the same eligible contact graph, collective steps and measured PAT/setup cost to its topology DP/MISOCP. Test imposed expiry, forecast error and persistent partial progress under the same buffers/control service.
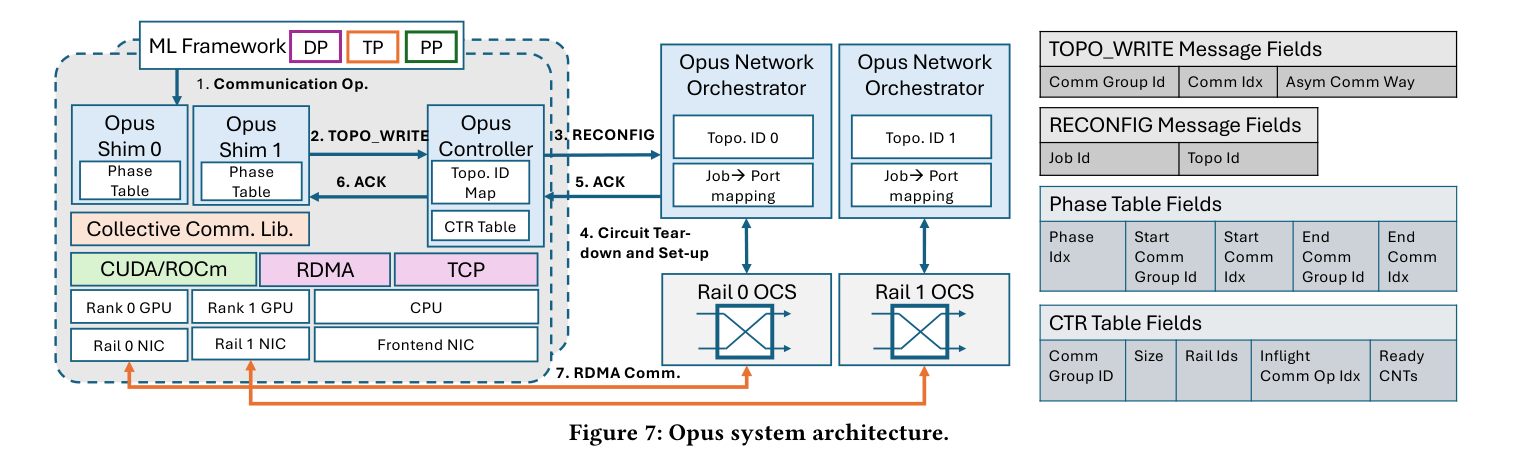
Rail-optimized scale-out ML clusters with predictable hybrid-parallelism phases, strong scale-up connectivity, commodity one-to-one OCS circuits, per-rail orchestrators and an application-level coordination network.
A PyTorch shim profiles the first five steps, intercepts collectives, classifies management versus data traffic and identifies phase boundaries. A per-job controller synchronizes ranks and issues topology IDs to per-rail OCS orchestrators. Locks and completion callbacks drain affected traffic before circuit changes. Provisioning starts the next configuration after the previous phase. Per-stage sub-mappings permit asynchronous pipeline progress.
arXiv 2602.12521v3, 2026-07-03. Conference DOI verified. Full primary text reviewed. Physical hardware: four dual-L40 servers, a 64-port Polatis 6000 OCS, dual ConnectX-6 Dx NICs per server and two 100-Gb/s rails, running six-layer Llama-3. Perlmutter emulation executes TorchTitan training up to 64 A100 GPUs with logically enforced circuit connectivity and injected switching delays. ASTRA-sim with Chakra traces evaluates dense/MoE iteration times up to 2048 modeled H200/B200 GPUs, 0–1000-ms switching and 100–1600-Gb/s scale-out links.
Retain rank-ready locks, traffic draining, provisioning and fallback under identical contacts. Price physical link-up and injected-latency experiments separately. Test deadlines imposed while a phase remains active.
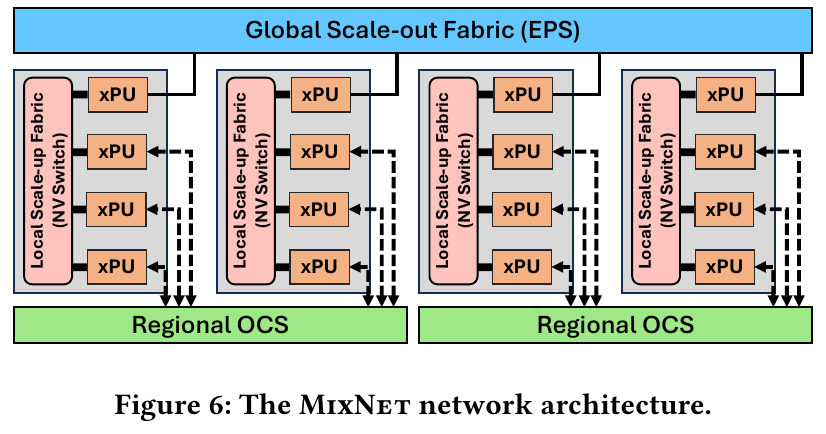
Distributed MoE training on a terrestrial GPU cluster augments a global electrical packet fabric with runtime-reconfigurable regional optical circuits. TP remains inside the local scale-up domain. Regional EP traffic uses OCS, while DP and PP use the electrical fabric.
Regional topology controllers collect expert demand. A greedy bottleneck-pair algorithm allocates degree-bounded circuits and permutes NIC mappings for NUMA locality. The custom RDMA collective runtime delegates inter-server EP traffic through gateway GPUs, overlaps inter-host and intra-host transfers, and retains hierarchical DP all-reduce on EPS. Four collective matrices within a layer share identical or transposed structure. Available compute phases hide later reconfigurations.
Author-hosted SIGCOMM 2025 conference PDF, 21 pages. Full primary text reviewed. Production profiling uses 128 H800 GPUs and 128 ConnectX-7 400Gbps NICs. The prototype has four servers, 32 A100 GPUs, 16 ConnectX-6 100Gbps NICs, a32×32 Polatis OCS and SN3700 Ethernet switch. Each server assigns 3 NICs to OCS and 1 to EPS. RoCEv2, NCCL and ibverbs carry real Megatron-LM training of truncated Mixtral8×7B, LLaMA-MoE and Qwen-MoE models. FlexFlow plus htsim evaluates full Mixtral8×7B/8×22B, Qwen-MoE and DeepSeek-R1 configurations, normally 1024 GPUs, 100–800Gbps links, 1µs propagation and 25ms OCS setup. Scale sweeps reach 32768 GPUs.
Retain conditional-load prediction, traffic partition and optical/electrical fabric choices at equal degree and memory. Test contact-expiry feasibility plus terminal/energy constraints with identical forecasts and update cadence.
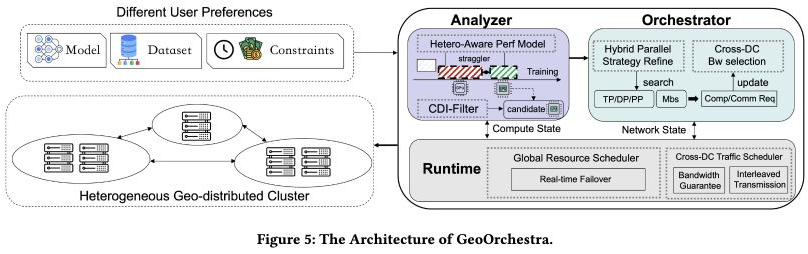
Dense LLM training across heterogeneous terrestrial GPU clusters shares a constrained WAN. The planner combines resource selection, intra-DC parallelism, inter-DC pipeline partitioning, memory buffering and bandwidth allocation.
An Analyzer prunes resource subsets through optimistic latency and cost bounds. The Orchestrator greedily shifts contiguous layers away from straggler stages or expands activation buffers to hide WAN delay, then adjusts bandwidth toward the rate needed by the compute window. The Runtime combines virtual-hard-pipe time slots with work-conserving interleaving, candidate-plan failover, synchronized Check-and-Commit launch and RDMA gateway buffering through final receiver commit ACK.
Official ACM conference reader, 14 pages. Full primary text reviewed. A six-node physical testbed has 48 GPUs, 24 H20-141GB and 24 V100-32GB. Each server has four ConnectX-7 100Gbps NICs. The cross-cluster WAN spans 2000km with 10Gbps capacity and 20ms RTT. Experiments cover dense OPT1.3B–175B and Qwen1.5 1.8B–72B families. Simulations extend to 256–1024 mixed V100/H20/A100/H100 GPUs across 4–16 clusters. Two-cluster traces validate simulator error within 5%. Reported metrics include throughput, iteration/memory prediction error and planner latency.
Retain WAN-slot planning, Check-and-Commit, gateway commit ACKs and byte-range restart/reroute. The adapter receives the same forecast/control trace and buffer budget. Test collective progress over enforced expiry and paid retries.
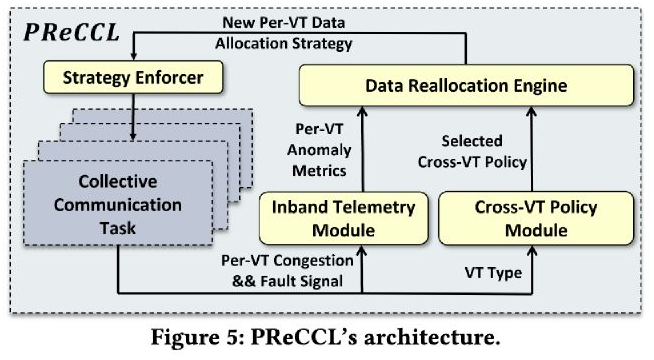
Repeated training collectives share heterogeneous virtual topologies in multi-tenant GPU clusters, where one slow topology delays the entire collective.
Four modules collect FIFO stall counts, choose valid cross-VT policies, compute allocation and enforce it at collective boundaries. Ring/Tree use independent contiguous tensor blocks. AlltoAll uses an intra-node, single-relay GPU policy that prices the extra hop. Epoch-tagged piggyback metadata carries VT ordering and checksum. All ranks validate and deterministically derive the next allocation after the current collective completes, retaining existing NCCL transport connections. Partial-VT failure triggers auxiliary socket signaling, masking, collective retry and lightweight recovery probes.
Official ACM conference reader, 19 pages. Full primary text reviewed. The real testbed has four servers with 32 Hopper GPUs, 80 GB HBM per GPU, eight 400 Gbps ConnectX-7 NICs per server, NVLink/NVSwitch and a two-tier leaf–spine fabric. NCCL v2.29 and Megatron-LM run concurrent GPT, Qwen-MoE and BERT training. Multiverse simulates 512/1024 GPUs with Poisson job arrivals and random four-host placements. Matched testbed bus-bandwidth points agree within 6%. A separate 300-job Crux-placement replay runs on 1024 H200 GPUs. The production trial compares 146 completed jobs over two weeks with a preceding two-week NCCL period on 1024 H200 GPUs across 256 servers. Appendix K labels this evidence observational.
Retain immutable CCT epochs, common metadata validation and partial-VT retry through its auxiliary socket channel. Match recovery-control service, failure evidence, forecast age and retry/terminal budgets. Compare resumed tensor correctness.
The measured and modeled baselines play complementary roles. Theseus provides a current measured runtime baseline for adaptive collectives. TE-CCL supplies the existing epoch-flow formulation and an executed synthesis baseline. Connex provides a measured migration contract, while CacheGen and KVServe provide measured compression controllers. Janus supplies measured training choices between token and expert-weight movement, and UBEP supplies measured inference dispatch on a different accelerator substrate. HyNA measures gradient aggregation. A comparison preserves each phase and hardware capability, then reports the cost of its orbital adapter.
For each transferred baseline, publish two configurations: the source-faithful mechanism running on the common service trace, and an explicitly documented orbital adapter receiving the shared forecast. Preserve ordering, quality, precision, cache size and application semantics. Debit forecast dissemination, control agreement, solver time, schedule installation, acquisition guards, retransmissions and relay bytes against the same compute/network budget. Run reactive, shared-forecast and clairvoyant information levels as parallel experimental conditions. The shared-forecast comparison tests mechanism value. The information-level comparison tests forecast value.
A reading map of representative system frameworks
The following primary papers instantiate the framework in concrete systems. Read the problem, mechanism, model and evidence together. Each original figure supplies the paper’s own architectural or measurement view. The detailed appendix adds baselines and operating assumptions.
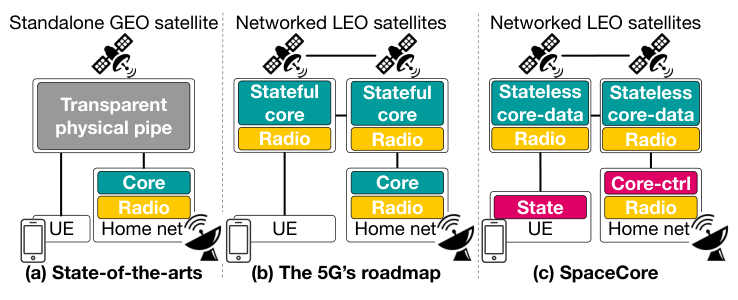
A Case for Stateless Mobile Core Network Functions in Space
Satellite-hosted 5G core functions serve terrestrial mobile users.
Problem formulation
High orbital mobility repeatedly migrates per-user core state and creates signaling overhead.
Algorithm and system design
Decouple function execution from state. Anchor service areas geographically. Store authenticated user state at the device and retrieve it locally.
Mathematical and graph model
Function/state split taxonomy, geographic grid addressing, orbital dynamics, protocol state-machine analysis and cryptographic state tokens.
Evaluation methodology
Commodity Raspberry Pi 4 satellite prototype, UERANSIM device emulation and Open5GS home core. Operational Tiantong/Inmarsat and terrestrial 5G signaling datasets. Constellation-scale replay.
Results and evidence conditions
For Starlink-like replay, satellite signaling reductions are 122.2× versus 5G NTN, 17.5× versus SkyCore, 40.3× versus DPCM and 49.3× versus Baoyun (Table 4).
Original Figure 1 · SpaceCore separates mobile-core packet functions from session state and home-network control. This separation lets a moving satellite process traffic while the state remains at a stable endpoint.Paper source · Open the full-resolution figure
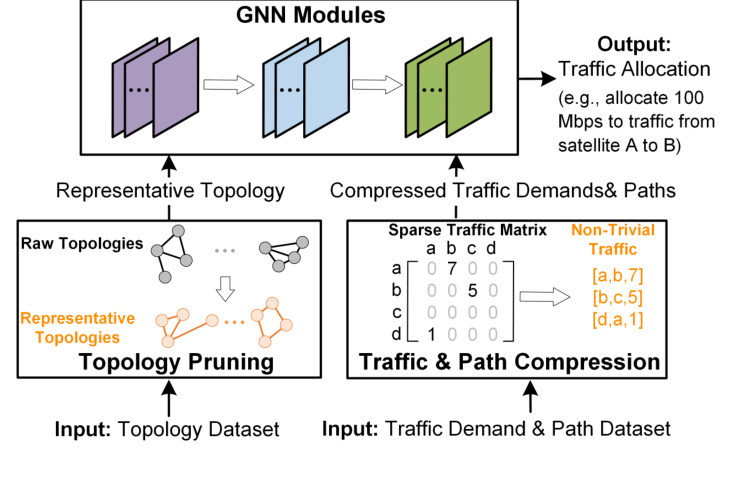
SaTE: Low-Latency Traffic Engineering for Satellite Networks
A controller allocates traffic across paths in a 4,236-satellite network.
Problem formulation
Solver latency makes allocations stale while links and traffic change.
Algorithm and system design
Use a heterogeneous graph of satellites, paths and traffic. Three graph-attention modules predict allocations, with capacity trimming and topology/traffic/path pruning.
Mathematical and graph model
Path-based multi-commodity throughput maximization. Supervised GNN labels from Gurobi. Determinantal Point Process topology sampling.
Evaluation methodology
FCC-derived orbital simulations. 3M population-weighted users and 1,000 gateways. Poisson arrivals 125–500 flows/s. Scaled 200Mbps ISLs and 50Mbps access. Azure A100. Train/test 4:1 across 10,000 snapshots.
Results and evidence conditions
17ms mean allocation inference, 2,738× faster than Gurobi. Online satisfied demand improves 23.5% with cross-shell lasers and 46.6% with ground relays. Incremental path calculation separately averages 56ms.
Original Figure 5 · SaTE prunes repetitive topology structure and compresses traffic/path inputs before supervised graph-neural allocation. These components reduce allocation latency. Route installation has its own timing budget.Paper source · Open the full-resolution figure
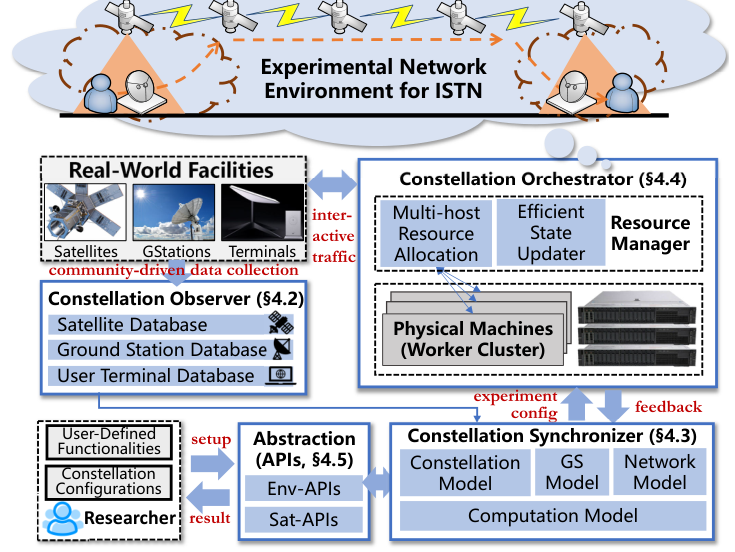
StarryNet: Empowering Researchers to Evaluate Futuristic Integrated Space and Terrestrial Networks
Containerized satellite and terrestrial network software runs against time-evolving constellation links.
Problem formulation
Thousands of mobile nodes require synchronized geometry, network-state updates and realistic software execution on terrestrial hosts.
Algorithm and system design
Combine public orbital information, physical-to-virtual mapping, Linux containers, traffic-control link updates and multi-host manager/worker orchestration.
Mathematical and graph model
Orbit propagation, geometric link feasibility, time-dependent graph mapping, resource capping and distributed event synchronization.
Evaluation methodology
Eight Dell PowerEdge R740 servers. Starlink, Kuiper and Telesat configurations. Ping/iperf validation against live European Starlink traces and CoreMark checks for virtual compute capacity.
Results and evidence conditions
A 4,408-satellite configuration initializes in 21.2 minutes using seven workers. 1-second updates consume 39.6% host CPU in the reported setup.
Original Figure 1 · StarryNet couples constellation geometry, measured facilities and a multi-host emulation cluster. Real protocol traffic runs through the generated link schedule, which enables controlled comparison at a scale set by host resources.Paper source · Open the full-resolution figure
Known Knowns and Unknowns: Near-realtime Earth Observation Via Query Bifurcation in Serval
Main conferenceE/C · Observation and ground delivery
NSDI · 2024 · Bill Tao; Om Chabra; Ishani Janveja; Indranil Gupta; Deepak Vasisht
Built for
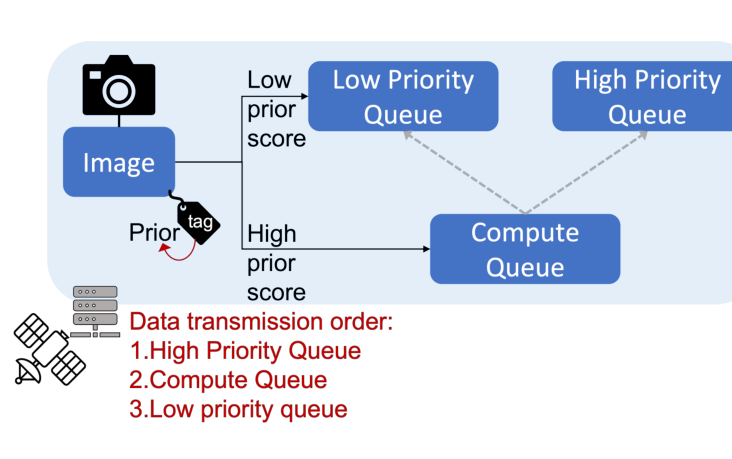
Nearly 200 Planet Dove imaging satellites answer prioritized Earth-observation queries.
Problem formulation
Downlink queues place urgent imagery behind large background collections. Onboard compute and energy budgets constrain image filtering.
Algorithm and system design
Bifurcate queries into slowly changing ground-precomputed predicates and dynamic onboard predicates. Schedule compute and downlink by query priority.
Mathematical and graph model
Boolean query composition, spatial intersections, contact schedules, compute queues and solar/battery energy accounting.
Evaluation methodology
Planet metadata for ten million images over July 1–20, 2021. Jetson AGX Orin profiling at 15 W and 30 W. Orbit/contact simulation with traditional and distributed ground stations, keeping aggregate downlink constant.
Results and evidence conditions
At 15 W, traditional-station median latency drops from 78.2 h to 1.1 h. Distributed-station median drops from 71.71 h to 0.03 h. The 47-minute P90 headline uses the distributed-station condition.
Original Figure 4 · Serval tags images with a query prior and separates compute, high-priority transmission and low-priority transmission queues. Queue placement reflects how much of the user query can be resolved onboard.Paper source · Open the full-resolution figure
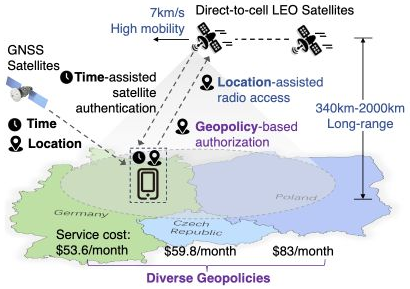
Multiple mobile operators lease LEO satellites to serve regular phones and IoT devices.
Problem formulation
Hop-by-hop cellular sessions couple satellite operators, mobile operators and devices as orbital movement repeatedly changes their relationship.
Algorithm and system design
Signed pay-as-you-go service tokens let satellites locally authorize service. Geographic cells and end-to-end mobile sessions stabilize service policy.
Mathematical and graph model
Protocol state machines, cryptographic trust tokens, function-split deadlines, geographic service mappings and orbital trace replay.
Evaluation methodology
Commodity cellular/SIM prototype and constellation-driven signaling simulations. Evaluate multi-operator access, paging load and service resumption.
Results and evidence conditions
Reported service-resumption latency improves 4.71–14.25× and signaling costs improve 850–7,640× in the evaluated multi-tenant mobility conditions.
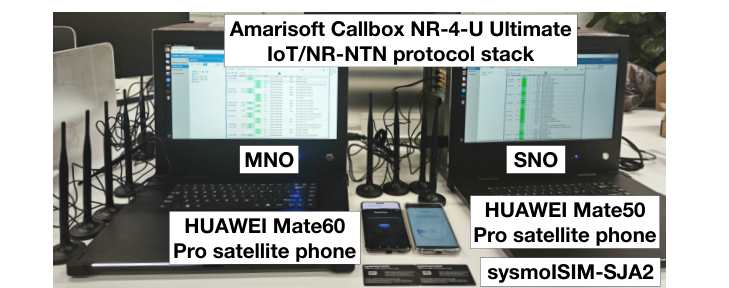
Original Figure 13 · MOSAIC evaluates satellite/operator integration with a cellular callbox, two commodity satellite phones and a programmable SIM. This hardware picture identifies the interfaces behind the protocol-stack evidence.Paper source · Open the full-resolution figure
CommSAR: Enabling Bidirectional Communication in SAR Imaging Satellites via Shared Waveform
SAR satellites exchange control data through the imaging waveform and reflected echoes.
Problem formulation
Dedicated communication hardware, spectrum and power impose constellation-scale overhead.
Algorithm and system design
Encode downlink data by chirp-start frequency offsets. Programmable ground metasurface uses differential phase modulation for uplink. Opposite-slope pilots compensate mobility.
Mathematical and graph model
Linear-frequency-modulated signal equations, matched filtering and radar cross section, Doppler estimation, differential BPSK, BER versus SNR.
Evaluation methodology
Actual commercial satellite supplies uplink IQ echoes and downlink channel traces. Proposed downlink waveform is tested with FPGA channel replay in anechoic chamber. UAV interleaved imaging A/B isolates waveform effects.
Results and evidence conditions
Maximum modeled/tested waveform rates 105Kbps DL and 112Kbps UL. Imaging evidence uses resolution, PSLR and ISLR. Final PDF112Kbps governs the author-page 120Kbps discrepancy.
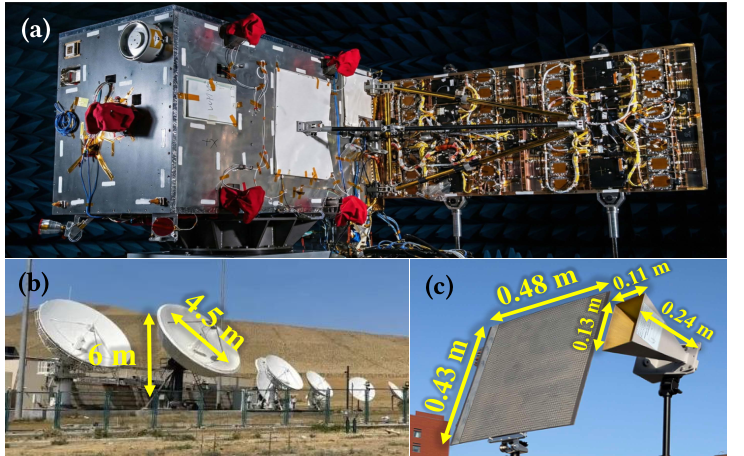
Original Figure 1 · CommSAR’s figure identifies the satellite SAR hardware, receiving ground antennas and metasurface. Flight evidence and downlink waveform replay exercise distinct components of the proposed bidirectional design.Paper source · Open the full-resolution figure
OrbitalBrain: A Distributed Framework for Training ML Models in Space
NINeS · 2026 · Om Chabra; Chenning Li; Kevin Hsieh; Santiago Segarra; Behnaz Arzani; Peder Olsen; Ranveer Chandra
Built for
Earth-observation satellites incrementally train local image models, exchange weights and selected raw imagery, and contribute updates to a ground global model.
Problem formulation
Limited downlink, energy, and storage combine with skewed geographic labels and stale local models to slow distributed training convergence.
Algorithm and system design
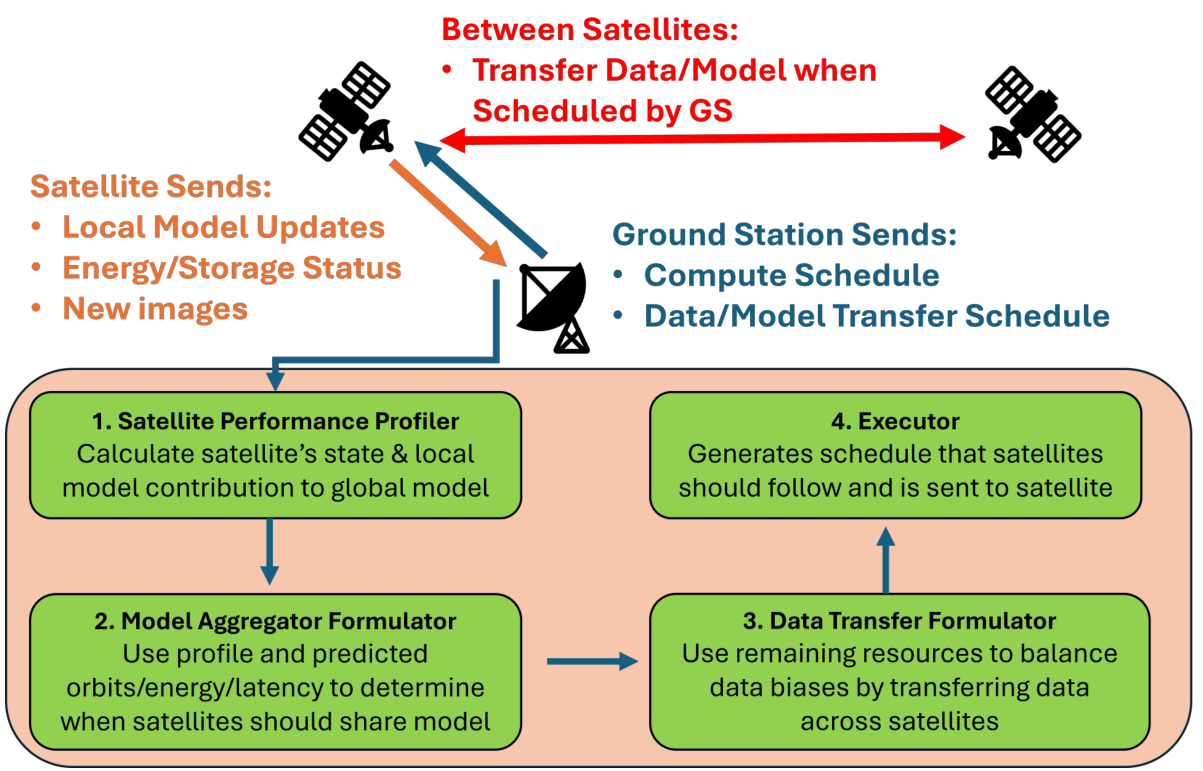
A cloud planner profiles loss, staleness, predicted compute, and label distributions. It chooses local compute, shortest-path-tree model averaging rooted at the satellite with most ISLs, or utility-ranked raw-data transfer. Ground contacts deliver schedules and model updates.
Mathematical and graph model
A binary resource-allocation formulation maximizes accuracy gain under window, energy, and storage constraints. The practical O(S² log S) greedy planner uses loss/staleness utility, a decaying aggregation threshold, and Jensen–Shannon label-divergence reduction. The appendix calls the formulation MILP. Its accuracy function requires an explicit linear surrogate for a solver-ready MILP.
Evaluation methodology
CosmicBeats orbital traces drive FLUTE/OpenMPI learning simulation: Planet 207 and Spire 117 satellites, 12 ground stations, 24 hours, five-minute windows, 100 Mbps bounded ISLs, and 360 GB storage. Final-five-layer DenseNet-161/fMoW and ResNet-50/So2Sat adaptation uses a Jetson Orin Nano 4 GB compute model. Power assumptions include 7 W solar generation, 7.5 W GPU/ISL demand, and 50 W downlink TX.
Results and evidence conditions
Table 3 reports 1.52–12.42× faster attainment of selected baselines’ own 24-hour final accuracy. Table 2 gives OrbitalBrain fMoW accuracy 52.8/59.2% versus BentPipe 47.3/50.2%, and So2Sat 47.9/47.1% versus 46.0/43.0%. Differences are percentage points.
Original Figure 4 · OrbitalBrain places its profiler, aggregation planner, data-transfer planner, and executor in the ground cloud. Satellites exchange local weights or imagery over scheduled ISLs. Ground contacts relay statistics and schedules.Paper source · Open the full-resolution figure
Mathematical tools and the questions they answer
Mathematical models encode assumptions as constraints. This section separates exact optimization, analytical bounds, and learned control so that a reader can recognize the actual claim behind a reported algorithm.
Tool
Question and formulation
Evidence to report
Continuous multi-commodity flow
Allocate splittable demands over capacity and flow-conservation constraints.
State the objective, path set and time horizon. Retain the relaxed optimum as a bound.
ILP / MILP
Integer linear programming chooses placements, paths or terminal matches. Mixed-integer models add continuous rates.
Report solver runtime, optimality gap, instance size, and implementable rounding.
This illustrative traffic-engineering program minimizes peak utilization u plus a penalized routing-change term. A is the node–edge incidence matrix. B specifies commodity injection and withdrawal. F is flow rate. The example uses one snapshot per j and an explicitly scaled coefficient λ, with units chosen so both objective terms are comparable. A deployment version adds demand admission, feasible paths, contact deadlines, terminal degree, and control-plane cost. A temporal formulation couples slots through storage and transmission timing.
Q, service S and arrivals A use bytes per slot in the queue recursion. Little’s law L=λ_aW relates average items in a stable system to arrival rate and average time. It requires consistent item units and the appropriate long-run conditions. A periodic contact gap can create a queue even when long-run average service exceeds arrivals. An M/M/1 approximation additionally assumes Poisson arrivals and exponential service. Bursty synchronized collectives require a measured or task-driven arrival model.
Orbital phase is a useful state variable for decision models. A controller that observes only current queue lengths may face different futures at two geometrically similar instants. Include phase, predicted contacts, thermal state, battery state, and workload progress when these quantities affect transitions. Partial observation motivates a belief state or history-based policy. A deterministic rolling-horizon optimizer often provides a simpler and stronger first baseline than RL. RL becomes scientifically useful when its learned adaptation improves held-out regimes under matched information and computation.
A policy π maps a state s to an action distribution. An MDP transition kernel P describes the next-state probability after action a. Fixing π induces the Markov chain P_π. Thus a Markov chain describes policy-fixed evolution, while an MDP describes controlled evolution. The state must retain the information needed to predict its next-state distribution: orbital phase, queue state and application progress are candidate components. An empirical transition model needs validation across held-out timing and demand conditions.
The discounted Bellman equation defines optimal expected reward V* when rewards r are bounded and the state/action model satisfies the MDP assumptions. γ is a dimensionless discount factor. A model-based solver uses the transition model. RL can learn values or policies from interactions. A reward should express the intended service metric and explicitly charge missed deadlines, energy consumption and reconfiguration. Constrained control additionally enforces hard capacity, battery and thermal limits during action selection.
Evaluation through complementary evidence
Research teams build credible satellite results by connecting measurements, physical models, packet behavior, and application execution. Each method answers a particular question. Agreement across methods is more informative than one large simulation.
Evidence layer
What it establishes
Calibration and limitations
Useful artifact
Commercial terminal measurement
Observable RTT, loss, goodput, outages and application behavior on a deployed service.
Gateway selection, scheduler and ISL path remain latent variables. Stratify geography, load and time.
Timestamped traces, terminal metadata and measurement protocol.
Orbit/contact simulation
Geometry, visibility, propagation and scheduled contact opportunities.
Declare propagator, epochs, elevation, degree and link-budget assumptions.
Reproducible ephemeris-to-contact generator and parameter table.
Packet/event simulation
Queue evolution, control reactions, routing transitions and many-node scaling.
Validate packet size, serialization, ACKs, drops and buffer treatment on small instances.
Traffic matrices, seed manifests and runtime/scaling curves.
Network emulation
Real protocol code and application interactions under controlled impairment traces.
Measure timer resolution, queue placement, NIC offloads, CPU load and achievable rates.
Trace replay harness, packet captures and emulator calibration.
Ground optical / compute testbed
Hardware throughput, pointing sensitivity, accelerator stalls and software integration.
State distance, vibration, optics and environment. Map each result to its tested subsystem.
Bench diagrams, calibrated instruments and direct execution traces.
In-orbit prototype
Integrated performance under actual spacecraft operations for the flown configuration.
Report mission duration, hardware, visibility and workload scope.
Flight telemetry and paired hardware/software configurations.
Each layer contributes a measured subsystem. Match its claims to the exercised hardware and protocol scope.
The evidence ladder joins a calibrated physical schedule to real packet code and application traces. Each upward step adds an observed subsystem and a defined operating scope.
Commercial observations constrain the end-to-end service, while interior mechanisms remain an inverse problem. A recurring RTT jump supports a recurring service-path event. Assigning it to a specific satellite handover requires corroborating telemetry or a carefully validated identification method. Conversely, a geometry simulator produces potential visibility, and an operator’s scheduling policy selects actual service. Calibrate observable predictions, disclose the latent choices, and sweep plausible values for those choices. This keeps operational evidence and architectural inference distinct.
The evaluation appendix records the evidence actually used by each paper. Methods vary across systems: some emphasize commercial measurements, some validate emulators, some derive schedules from orbit models, and some run compute prototypes. The main synthesis compares these evidence combinations and ties each experiment to the claimed mechanism. A paper’s mechanism determines the strongest appropriate experiment: transport needs packet-level feedback, placement needs real application dependencies, and link feasibility needs physical optics.
Two recent examples show why component-level evidence labels matter. Collaborative LLM inference evaluates partitioning and compression using a vision Transformer on EuroSAT/RESISC45 with four Jetson devices and an RTX 4070 Ti. The listed 0.5 Gbps ISL, 6 Gbps ground link and batch 64 describe that test. Token-by-token decoder service requires its own execution evidence. Its 24-hour simulation horizon is an experiment duration. A 500 km circular orbit has a calculated period near 94.5 minutes. CommSAR combines an actual satellite uplink, a UAV-assisted CSLFM component, and replay of an in-orbit downlink channel. Each measurement establishes its exercised component and direction.
The following matrix synthesizes the eleven satellite-centric SIGCOMM main papers. L denotes live subscriber service, S an operational spacecraft asset, H hardware/protocol prototypes, R workload or channel replay, E network emulation, O orbit-derived simulation, and A analytical/solver modeling. A route describes the exercised evidence, while the last column names its calibration anchor.
Jetson execution and imagery traces calibrate constellation storage/communication replay. Byte-hours and downlink bytes remain distinct.
Inference from this eleven-paper sample: two papers anchor transport/queue claims in live subscriber service. Two include an operational spacecraft asset. The remaining seven use hardware, replay, emulation or orbit/solver models as their principal scalable evidence. This observed mix supports a layered evaluation argument: measure the proposed mechanism where access exists, calibrate the projected substrate, and keep the application and scale claims within the exercised conditions. A future reviewer judgement additionally depends on novelty, correctness and the quality of the chosen baselines.
Inference · Live-service pattern. Transport and queue claims become stronger when measured subscriber traces are paired with controlled replay at the same offered load. Publish the terminal/software version, timing alignment, queue observables and error bars. The replay then tests the causal mechanism on matched feedback conditions.
Inference · Operational-asset pattern. A spacecraft experiment supports the measured direction, waveform, orbit and deployment interval. Report each uplink/downlink component separately, alongside channel replay and power/timing telemetry, so the end-to-end claim follows the exercised path.
Inference · Model-scale pattern. A scale result receives its mechanism anchor from measured hardware kernels, protocol execution or a validated solver. Report the calibrated range, simulation-step convergence, actual baseline runtime and held-out trace behavior. An extrapolation sweep then states the modeled regime and uncertainty.
Reviewable claims, baselines and confounders
This section translates evaluation practice into an evidence standard for a SIGCOMM submission. Acceptance is a committee decision. A careful experiment makes the technical claim easier to assess and reproduce.
Start with a mechanism-level causal question. If the proposal anticipates a contact gap, compare it against a reactive policy, a schedule-informed policy, and an oracle that uses exact future events. Give practical policies the same forecast and computation budget. Report the oracle as an upper bound, with its information advantage visible. If the proposal changes placement and routing together, include placement-only, routing-only, and joint variants to locate the source of improvement.
Confounder
Observed effect
Repair and evidence
Extra optical capacity
A new policy finishes sooner because it receives more terminals or bit/s.
Match terminal count, per-link capacity, setup and power across comparisons.
Future-information advantage
The proposed controller anticipates a disruption while its comparator observes only current state.
Add a schedule-informed comparator and an explicitly labelled oracle.
Emulator bottleneck
Host CPU or shaping queues dominate the measured completion time.
Calibrate sustained rate and timer error. Collect CPU, NIC and queue counters.
Correlated repetitions
Many runs replay the same geometry or arrival trace and understate uncertainty.
Use independent trace/seed units and paired comparisons. Disclose the sampling unit.
Average-only reporting
Mean throughput hides transition stalls and deadline misses.
Report p50/p95/p99, service deficits, transition windows and completion distributions.
Parameter transfer
A commercial wide-area capacity is combined with close-formation delay or ideal pointing.
Maintain coherent regime-specific parameter bundles and show separate sensitivity curves.
A convincing artifact includes source code, contact generation, trace provenance, complete configuration, versioned baselines, raw summary metrics, and small reproductions of the key mechanism. Report absolute job times and link utilization alongside speedups. Statistical intervals should use independent workloads, orbit epochs, or request traces as the sampling unit. A scalability result should include controller runtime, memory, messages, and the age of the decision when installed. These measurements establish the operating range of the implementation.
Part II · Orbital compute substrate
Compute spacecraft: power, heat, mass and optical terminals
An orbital AI center needs a physically consistent accelerator envelope before networking gains can be interpreted. This section derives a screening model and labels every illustrative parameter as an assumption.
A compute satellite dedicates electrical power, memory, packaging and heat transport to accelerators. A communication satellite primarily budgets resources for beams, payload electronics and forwarding. The distinction is a payload allocation. The feasible GPU count follows the electrical, thermal and mass budget. Solar-array output, end-of-life degradation, battery reserve, host power, network terminals and radiator heat rejection jointly bound the accelerator count. Mission reliability then determines spare capacity, shielding, error correction and recovery overhead.
NASA’s power chapter distinguishes peak beginning-of-life array output from orbital-average payload power. Its thermal chapter explains conductive heat transport inside a spacecraft and radiative heat exchange with its environment. These support the coupled power-and-heat accounting below. Actual design additionally incorporates Earth infrared, albedo, solar absorption, view factors, coatings and allowable component temperatures.
Solar irradiance S☉ is 1361 W/m² from NASA solar-irradiance measurements. Array area A_s is m². Η_s is conversion efficiency. Η_p is electrical delivery efficiency. Α_s combines sunlight duty, projection and degradation for this screening calculation. For sustained loads, battery charge/discharge efficiency and the actual sunlight timeline must also enter the energy balance.
Radiator emitting area A_r is in m². Emissivity ε and view factor F are dimensionless. Stefan–Boltzmann constant σ is 5.6704×10⁻⁸ W/(m²K⁴). Temperatures use kelvin. Q_absorbed and fixed heat use watts. p_g and q_g are per-accelerator electrical and thermal budgets. The inequality is a screening upper bound, rounded down to an integer. Radiator temperature is a heat-rejection temperature, and chip junction temperature additionally depends on thermal resistance. Here Q_0 excludes optical terminals. The screening bound conservatively converts their full electrical draw p_t into onboard heat. Emitted optical output can refine the flight thermal model.
Keep area fixed. Change radiator temperature to 280 K.
Ideal rejection falls to 31.4 kW. Thermal bound ≈37. Environmental heat and view-factor losses tighten both cases.
Gold: electrical supply. Purple: compute and communications. Green: heat rejection. The scheduler consumes both budgets.
The same job consumes accelerator power, terminal power and radiator capacity. Solar-array and radiator geometry also influence pointing and the links available to the scheduler.
The example’s 34-accelerator result is an illustrative electrical upper bound under the listed assumptions. It carries a terrestrial accelerator datasheet into an idealized spacecraft balance. Memory capacity, shielding, packaging, terminal electronics, launch envelope and safe thermal margins require separate engineering constraints. For mass, write m_total=m_bus+m_compute+m_array+m_radiator+m_battery+m_terminals+m_shield+m_propellant, with array mass P_peak/specific_power and radiator mass A_r×areal_density. A mission should source each specific-power and density value from its actual hardware or identify it as a sweep parameter.
This mass ledger separates accelerator-package mass m_g, array specific power s_P in W/kg, radiator areal density ρ_r in kg/m², terminal count q, per-terminal mass m_t and electrical bus draw p_t. P_0 is the assumed fixed load excluding optical terminals. Peak array power determines array mass. The B1 duty and efficiency factors determine usable electrical power.
Worked component
Parameter source or assumption
Result in this illustrative bundle
Radiator mass
100 m² emitting area × 10 kg/m². Areal density carried from Dark Clouds, Table 1. The 300 K heat balance remains the report’s own B2 bundle.
1,000 kg radiator.
Array mass
B1 inputs give peak 40.83 kW. Assume 100 W/kg beginning-of-life array specific power. Sweep 50/100/200 W/kg.
408.3 kg array. Sweep gives 816.6/408.3/204.2 kg. Usable power stays 29.3976 kW under B1 factors.
Optical terminal placeholder
Dark Clouds Table 1 assumes 50 W electrical load and 0.5 kg per terminal. Its discussion calls for capacity-sized optical accounting.
q=2/4/8 draws 0.1/0.2/0.4 kW and weighs 1/2/4 kg. With P_0=5 kW and 0.7 kW per accelerator, electrical counts are 34/34/34.
Optical link-budget inputs
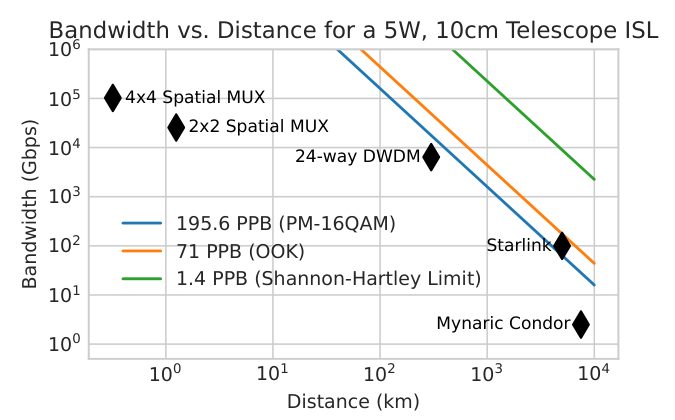
Suncatcher §4.2 Eq.(1): transmitted optical power P_T=5 W and 10 cm telescope aperture, with about 80% aperture efficiency. These describe optical transmission and collection.
Electrical terminal draw additionally uses amplifier efficiency, transceiver electronics and PAT. A measured bus profile establishes power for an actual rate.
Terminal sensitivity
Assume 10% optical-amplifier efficiency for the 5 W transmitted optical output plus 200 W electronics/PAT: p_t=250 W. This is a stress-test electrical assumption.
q=2/4/8 draws 0.5/1/2 kW. Electrical accelerator counts become 34/33/31 under the same usable power. Conservatively counting terminal draw as heat gives thermal counts 51/50/49 at 300 K and 36/36/34 at 280 K for q=2/4/8. The electrical count remains binding in each case.
Worked total mass
At q=4 in the 50 W bundle, assume 10 kg per compute package, bus 100 kg, battery 200 kg, shielding 100 kg and propellant 50 kg. These are explicit screening inputs.
For N=34: 1,000+408.3+340+100+200+2+100+50 = 2,200.3 kg. Deployment hardware, launch loads and flight packaging require component-level mass evidence.
What close-formation evidence establishes
Project Suncatcher is a useful bridge between satellite geometry and accelerator networking. Its engineering evidence should be read by subsystem and kept separate from the screening assumptions in the previous section.
Suncatcher, §§2.1–2.3 and 4.1–4.3, reports commercial optical ISLs in the 1–100 Gbps range and targets aggregate links around 10 Tbps through short distance, dense wavelength-division multiplexing (DWDM, many wavelengths on one optical path) and spatial multiplexing (separate parallel beams). Its bench demonstration achieves 800 Gbps in one direction across a short free-space path. An illustrative formation uses 81 spacecraft, 650 km mean altitude and 1 km cluster radius. Relative dynamics preserve a local neighborhood while distances change. Proton testing characterizes Trillium TPU radiation effects, with memory sensitivity and recovery implications. These are subsystem and modeling results. The paper identifies thermal management, ground connectivity and on-orbit reliability as subsequent engineering milestones.
For a networking paper, the next question is how a fabric turns feasible short optical links into usable collective service. The experiment must establish endpoint counts, aggregate versus per-direction bandwidth, duplex behavior, terminal degree, setup time, host/NIC transfer overhead, and buffers. Then it should map an accelerator communication dependency onto that fabric. A physical feasibility curve gives the admissible parameter envelope. A network execution trace establishes the application consequence within that envelope.
Radiation adds several fault classes to this execution model. Total ionizing dose accumulates across a mission. Single-event effects arise from individual particle interactions. Network-visible outcomes include a correctable memory event, a device reset, a host interruption, or corrupted application state. Treat each outcome through a documented fault-injection model and measured recovery path. Training correctness requires loss/convergence and state-integrity checks in addition to job completion. Inference requires request correctness and service-level recovery.
The substrate distinction also changes how recent proposals should be read. The LEO-NET connectivity study uses a dedicated relay shell to connect a space datacenter. That relay architecture and a compact 81-spacecraft compute formation address separate graph layers. SpaceMoE’s simulation uses a 1,056-satellite, 550 km, 87° constellation with 100 Gbps links and a 7.28 GFLOPS radiation-tolerant CPU model. This is a wide-area CPU-constrained scenario. Its 200 snapshots and independent 0.95 link-survival assumption should accompany any placement result. Correlated formation faults require a separate experiment.
Parameter provenance similarly matters for thermal estimates. the Dark Clouds physical analysis gives an idealized 3.03 m²/kW radiator estimate with 10 kg/m² areal density under its stated assumptions. Read that number as a heat-rejection component estimate. Complete spacecraft mass accounting adds the bus, attitude determination and control system (ADCS), shielding and the other mass-ledger terms in B7. The report’s own 300 K example uses a separate emissivity and ideal environmental balance, so the two estimates remain distinct parameter bundles.
Part III · AI networking opportunities
AI workload communication: bytes and dependencies
An AI workload becomes a network problem through the objects it moves and the computation that waits for those objects. Byte accounting identifies the bottleneck before selecting a routing or transport design.
Parallelism or state
Transferred object
Dependency and suitable regime
Data parallelism · DP
Gradient buckets are synchronized across replicas. Sharded optimizer variants add parameter/state exchanges.
Step completion depends on collective completion. Useful in B with sufficient cut capacity.
Tensor parallelism · TP
Layer activations or partial results pass through frequent collectives.
Fine-grained latency enters every layer. First keep TP within the fastest local island.
Pipeline parallelism · PP
Microbatch activation tensors cross stage boundaries. Training returns activation gradients.
Stage imbalance and contact gaps form pipeline bubbles. Coarse stages may fit D or B.
Expert parallelism · EP
Mixture-of-experts dispatch sends selected token vectors to experts and combines outputs.
Routing skew and all-to-all contention couple placement with time-varying cuts.
Inference KV state
Key and value tensors encode processed tokens across attention layers.
Migration affects handover, prefill/decode split and user continuity in A or C.
Checkpoint / model staging
Weights, optimizer state, RNG state and recovery metadata move to durable storage or replicas.
Large background transfers compete with foreground collectives and gateway windows.
For an uncompressed ring all-reduce, n ranks synchronize P gradient elements of b_g bytes each. V is outbound bytes per rank. α is per-stage latency in seconds. C_eff is achieved bit/s on the critical ring edge. The approximation assumes uniform stages and describes this implementation, while overlap, hierarchical collectives and sharding change the actual critical path. An assumed P=7×10⁹, b_g=2, n=8 yields 24.5 GB outbound per rank. Ideal serialization is 1.96 s at 100 Gbps and 19.6 ms at 10 Tbps, before latency and contention.
B4
$$V_{\mathrm{PP}}=B_\mu s h b_a,\qquad V_{\mathrm{EP,remote}}\approx 2\rho k B_t h b_a,\qquad V_{\mathrm{KV}}=2L B s H_{\mathrm{KV}}d_hb_{\mathrm{KV}}$$
PP volume is one activation tensor at one stage boundary, with microbatch size B_μ, sequence length s, hidden width h and element size b_a. EP volume estimates aggregate dispatch plus combine across the selected expert-parallel group for B_t tokens, top-k selection and remote-expert fraction ρ, assuming equal vector widths. Padding and metadata add bytes. KV volume includes keys and values over L layers, batch B, s tokens, H_KV KV heads, head width d_h and element size b_KV. The formulas count payload bytes and state their scope. A trace captures actual layouts, quantization and repeated exchanges.
DP illustrates ring synchronization among replicas. PP shows forward activations and backward gradients. EP shows a selected-token all-to-all and its combine phase. KV shows a versioned state transfer. Node positions represent dependencies rather than physical satellite positions.
DP synchronizes replicas, PP sends stage activations, EP exchanges selected tokens, and KV migration moves session state. Their communication graphs create distinct network requirements.
An assumed grouped-query model with L=32, H_KV=8, d_h=128, b_KV=2, B=1 and s=8192 holds 1.074 GB of KV payload. Its ideal serialization is 85.9 ms at 100 Gbps and 859 ms at 10 Gbps. These calculations use decimal GB and count one full transfer. They motivate evaluating state residency and incremental migration before splitting every token step across a wide-area path. A task DAG, a directed acyclic graph of compute and transfers, then connects these byte objects to critical-path completion.
B8
$$V_{\rm TP,rank}=m_{\rm AR}L\,2\frac{n_t-1}{n_t}B s h b_a,\qquad V_{\rm weights}=P b_w$$
The TP expression counts outbound ring AllReduce bytes per rank for an assumed m_AR activation-sized AllReduces per layer, L layers, n_t tensor-parallel ranks and activation shape B×s×h. The selected parallelism implementation determines m_AR and any ReduceScatter/AllGather alternatives. Weight staging counts P parameters of b_w bytes. An optimizer checkpoint adds its actual optimizer, master-weight and recovery states.
Object and assumptions
Payload bytes
Ideal serialization at 100 Gbps
PP stage boundary: B_μ=4, s=2048, h=4096, b_a=2. One forward activation. Training returns an equal-size gradient under the stated shape.
1.879 GB outbound per rank for the assumed layer collectives.
150.324 ms summed payload serialization. Layer dependencies and overlap enter the application timeline.
Weight staging: P=7×10⁹, b_w=2. This object contains model weights.
14 GB. An assumed Adam training bundle with 2-byte weights, 4-byte master weights and two 4-byte moments contains 98 GB before other recovery state.
1.12 s weights. 7.84 s for the stated 98 GB bundle.
Temporal cuts, reconfiguration and collective execution
The interaction between an AI dependency graph and the contact schedule is the central systems opportunity. It connects topology control, workload placement, transport service and fault recovery through a shared temporal budget.
The left side counts bits of objects required to cross a partition S before b. The right side integrates usable cut capacity in bits. Setup, pointing loss and reserved control traffic reduce C_usable. This is a necessary bandwidth condition for the specified partition and deadline. A time-expanded cut also accounts for the order of contacts, storage and arrival times. Repeated training phases can exceed a temporal cut even when peak links look fast.
A reconfigurable fabric can reserve a set of optical circuits for an upcoming collective, but the reservation displaces other traffic and consumes terminal setup. Let τ be circuit setup time and t_s be useful transfer time. The idealized usable fraction is t_s/(τ+t_s). At t_s=1 ms and assumed τ=10 ms, that fraction is 9.1%. At t_s=1 s, it is 99.0%. These assumptions illustrate why aggregation granularity matters. A design should measure its actual switching or PAT cost and compare stable circuits, demand-driven reconfiguration and a dependency-aware reservation policy. Harvest already places reconfiguration delay, congestion and propagation inside collective topology scheduling. Opus already reconfigures photonic rails at application phase boundaries. The fraction calculation therefore motivates setup calibration and a strong comparator. The proposed extra scope is externally imposed, forecast-bounded expiry while work or control remains in flight.
This phase-level roofline lower bound uses work F_work in floating-point operations, achieved compute rate R_compute in operations/s, required cut-crossing payload V_cut in bytes and fixed usable cut rate C_cut in bit/s. Both terms are seconds. It assumes the phase needs both compute and communication and allows ideal overlap. Actual execution adds dependency order, startup and contention. A temporal cut replaces the fixed-rate term when service changes. Compare trace-measured stall time with this bound before attributing a training bottleneck to orbit.
The runtime declares readiness and bytes. The fabric declares an achievable interval. Both precede the next compute step.
A collective-ready path requires both a completed compute predecessor and usable network service. Reserving a future contact helps when setup, queue drain and dependency order align.
A productive abstraction is a byte-and-deadline contract for each communication phase. The runtime describes ready time, destination set, payload volume, completion deadline and recovery semantics. The fabric replies with an achievable service interval and an admission decision. The scheduler can then change microbatch size, place experts inside a temporary high-capacity island, or delay background checkpoint traffic. Correctness remains tied to the collective or inference dependency: each receiver executes its next operation after the required data and version arrive.
Research gaps at the satellite–AI interface
This matrix organizes opportunities by the mechanism inherited from each community and the orbital-specific question that requires evidence. The appendix establishes the dated paper coverage behind each family.
Capability
Terrestrial AI mechanism
Satellite mechanism
Orbital AI question
Routing and TE
Adaptive load balancing and collective-aware traffic placement.
Predictive routes, contact schedules and gateway-aware allocation.
Can temporal reservations preserve collective progress under matched cuts and forecast error?
Transport
Rate control, ECN and receiver admission for synchronized traffic.
Variable-delay and intermittent-capacity control.
Which forecast signals improve control stability through transitions and queue bursts?
Multicast and collectives
Topology-aware trees, rings and hierarchical reductions.
Dynamic forwarding and sparse optical degree.
How should a collective preserve versioned progress across scheduled topology changes?
Expert and model placement
Locality, load balance and memory-constrained partitioning.
Compute placement using contact, energy and routing state.
When does migration cost exceed the benefit of tracking a changing communication island?
State residency
KV sharing, prefill/decode disaggregation and admission.
Mobility continuity and gateway scheduling.
Can a request keep its state local while its user attachment and egress path change?
Failure recovery
Checkpointing, spare ranks and elastic restart.
Remote recovery and scheduled access to durable endpoints.
Which recovery placement minimizes lost compute plus transfer time within energy limits?
Fabric design
Clos, expander and reconfigurable optical networks.
Terminal degree, geometry, PAT and formation control.
Which physically feasible topology maximizes useful AI throughput per terminal watt?
Space edge-compute work supplies essential precursors. Serval connects predictable orbital operation to computation. The census adds observation/compute/routing and constellation scheduling families. Their contribution is an explicit relationship among mobility, placement and resource budgets. An AI-network proposal should reuse that relationship while adding measured collective or inference dependencies, concrete network service, and a comparison against mature AI-fabric techniques. This builds an incremental research claim that a networking reviewer can test.
OrbitalBrain establishes a direct training precedent. Its ground-cloud planner selects local image-model adaptation, shortest-path-tree weight averaging and raw-image transfer across Planet/Spire traces. The evaluated models adapt the final five layers of DenseNet-161 and ResNet-50, with five-minute decisions and modeled 100 Mbps ISLs. Its gain is convergence under heterogeneous imagery and contact/resource constraints. A closely coupled LLM fabric question adds repeated DP/TP/PP/EP communication, application critical paths, packet competition and physically calibrated optical-terminal constraints. A future proposal should explicitly compare against OrbitalBrain-style utility scheduling.
The remaining gap is an executable service contract at the interface between application dependencies and finite, resource-priced contacts. The table names the strongest adjacent mechanisms before stating the residual hypothesis. A time-expanded graph, a hot-swappable schedule, an endpoint epoch or a bandwidth-aware codec supplies a starting point. A new paper’s contribution rests on the additional protocol and its measured effect under shared information.
Epoch-flow scheduling, adaptive schedule choice, service-driven reconfiguration and receiver credits are established mechanisms.
A dependency/progress contract admits a collective phase into a finite optical service interval and completes or safely transfers its committed chunks as telemetry and control contexts age.
Give the closest runtime the same forecast and candidates. Continue when deadline/progress handling improves application step tails after all transition costs.
Contact-aware KV residency
Connex mobility contract. KVServe and CacheGen codecs. DualPath relay I/O. GeoOrchestra also establishes buffered commit ACK and byte-range transfer recovery.
Epoch handover, stable endpoints, adaptive compression and spare-path KV pooling are established mechanisms.
A byte-accounted state-commit admission contract joins finite ingress/egress contacts, cache residency, compression service time and delayed directory agreement.
Compare forecast-equipped Connex plus a current codec controller at matched memory and quality. Continue when completed requests meet continuity and admission-fairness targets.
Power-aware communication islands
MixNet conditional-load prediction and MoE fabric reconfiguration. Janus training weights/tokens. UBEP inference dispatch. HyNA gradient aggregation.
Weights/tokens selection, fine-grained dispatch, gradient aggregation, GPU-intensity priority and degree-limited topology search are established mechanisms.
A contact-feasible expert/terminal reservation couples expert-version freshness, inference dispatch or training gradient return, and thermal/energy debt across islands.
Hold useful work, model quality, memory and total joules fixed. Continue when the joint policy expands the latency/energy frontier beyond sequential forecast-equipped policies.
The source coverage supports a dated mechanism map through 2 October 2026. It supports conditional hypotheses about finite contacts and physical resource coupling. Establishing a field-wide originality claim requires a fresh paper/repository search at submission time and an explicit comparison against the contemporaneous implemented baseline. The experiment therefore includes baseline adapters in the artifact and reports how much of each gain comes from existing mechanisms, shared forecasting and the additional contract.
The five optical/WAN additions further narrow the residual. Harvest and Opus already price switching and synchronize circuit activation. MixNet already changes a MoE fabric during training. PReCCL already commits immutable allocations and retries partial topology faults. GeoOrchestra already uses launch commits, durable gateway buffers and byte-range recovery. Reuse these mechanisms in the strongest adapters. Test imposed contact endpoints, bounded forecast error, shared control reachability and memory/terminal/energy limits while work is active. Generic phase scheduling, commit messages and retry logic are established mechanisms. A future paper earns its claim through the additional expiry/resource coupling and measured correctness or application benefit.
Three falsifiable designs and an executable lab plan
The final section turns the research map into candidate SIGCOMM projects. The ranking reflects mechanism novelty, experimental control and access to a credible substrate. The ranking records a planning judgment under the stated research and evaluation resources.
Rank and design
Falsifiable hypothesis
Implementation and strong baselines
Continuation / stop rule
1 · Temporal collective service
Under measured setup and forecast error, expiry-aware progress commit lowers p95 training step time by ≥15% at fixed usable capacity.
Implement a release/byte/progress contract with finite-contact reservations and deadline-safe schedule versions. Baselines: Theseus with the same contact attributes and schedule candidates. TE-CCL with the same epoch graph and solve budget. OptCCL as a modeled synthesis comparator. TDTCP with identical path notifications. Charge agreement, installation, PAT guards and retries. Add Harvest with measured PAT/setup cost, Opus phase-boundary locks/provisioning, PReCCL CCT/recovery and GeoOrchestra commit/byte-range recovery at equal control reachability.
Continue after a ≥15% improvement in two coherent B parameter bundles with ≤5% control cost. Stop or narrow the claim when the gain disappears under matched information or feasible setup.
2 · Contact-aware KV residency
State-resident inference with scheduled ingress/egress lowers p99 handover token gap by ≥20% while preserving request correctness and admission fairness.
Implement byte-accounted KV admission and state-commit deadlines. Baselines: forecast-equipped Connex combined with KVServe, and independently with CacheGen. DualPath relay loading on the same shared ISL graph. Match quality, memory, accepted load and migration opportunities. Charge codec time, directory control, relay bytes and transfer recovery.
Continue across two independent A/C trace families with matched memory and byte budgets. Stop or focus on admission when transfer savings fail to improve user-visible token continuity.
3 · Power-aware communication islands
A joint expert/terminal/power schedule raises useful tokens per joule by ≥10% over strong sequential schedules at equal latency targets.
Implement contact-feasible expert/terminal reservations under common energy/thermal limits. Training baseline: Janus with identical ratio inputs, forecast and freshness/gradient requirements. Inference baseline: UBEP-inspired topology-aware packet dispatch with priced readiness/ACK semantics. Evaluate HyNA-style gradient AllReduce as a separate phase. Compare joint and sequential policies with TopoOpt/Crux controls. Add MixNet as the training fabric baseline with the same prediction samples, degree, activation cost and optical/electrical resources.
Continue after gains survive forecast, expert-skew and thermal-model sweeps. Stop or revise when the effect is explained by extra power, memory or terminal degree.
Project 1 has the clearest fabric-level contribution, conditional on access to credible terminal setup and capacity measurements. Project 2 offers the most accessible first experiment because a commercial terminal and a terrestrial inference cluster expose observable service transitions. Project 3 carries the broadest model risk because thermal and power allocation can overwhelm the networking mechanism. A useful initial milestone is an eight-rank collective and one stateful inference service driven by the same trace interface. This reveals which interface the substrate actually needs.
Validate replay against packet captures. Real execution establishes lab-scale behavior. Calibrated event models explore larger parameter envelopes.
The lab separates schedule generation, a calibrated network replay layer, and real accelerator execution. Instrumentation links predicted contacts to packet and application outcomes.
Use 8–32 terrestrial GPUs across enough hosts to create controllable network boundaries, initially with 2–4 GPUs per host and TP inside each host. Record the actual GPU, memory, NIC rate, driver, communication library and framework versions. Run a 1B–7B dense model or a memory-fitting equivalent, collective microbenchmarks, and one MoE trace-driven workload. The 1B–7B range is a disclosed lab resource choice. Orbital hardware feasibility follows its own component ledger. Collect synchronized CUDA/runtime timestamps, NIC counters, queue/drop samples, collective bytes, power telemetry, training loss, request correctness, time to first token and inter-token gaps.
Construct two separately named trace bundles. Bundle A/C combines public orbit-derived visibility with commercial terminal service measurements and disclosed latent-parameter sweeps. Bundle B derives local distances from a formation model and sweeps terminal degree 2/4/8, setup 0.1/1/10/100 ms, and timing forecast error 0/1/5/20% of a contact interval. These sweep points are stress-test assumptions. Pair them with payload rates achievable on the lab NIC, and use event simulation for the 100 Gbps–10 Tbps envelope after validating the simulator on measured lab points. Report hardware execution and extrapolated simulation as separate evidence layers.
Calibrate each replay rate and delay against packet captures before running applications. Use a fixed warm-up, paired workload/trace seeds, at least ten independent trace segments per primary point, and a reported sampling unit. Ten segments is an initial experimental budget. Increase it when the observed confidence interval exceeds the pre-registered effect threshold. Include steady geometry, scheduled transition, demand burst, forecast error and device-reset cases. Preserve total terminal capacity, memory, accelerator power and background traffic across baseline pairs. Report p50/p95/p99 outcomes and the full completion distribution, with controller runtime and control traffic charged to the result.
The next research decision follows the evidence. A collective project advances when a temporal service contract improves actual critical-path execution across credible B bundles. An inference project advances when state residency improves user-visible continuity across measured A/C transitions. A power-aware project advances when its gains survive energy, thermal and placement controls. These criteria create a concrete route from satellite background knowledge to a testable systems contribution.
An OrbitalBrain-style baseline should retain its utility-based compute/aggregation/data-transfer decisions and receive the same orbit forecasts, link opportunities, power and storage budgets. Adapt its model-averaging operations to the tested LLM training configuration explicitly. Compare convergence-to-a-common-quality-target and step completion separately: OrbitalBrain’s reported speedup uses each baseline’s own final accuracy threshold, while a fabric experiment needs matched useful work and quality.
Project 1 tests a deadline/progress contract beyond existing temporal synthesis and runtime adaptation. TE-CCL already optimizes epoch-indexed flow, and Theseus already swaps schedules with common-context agreement. The proposed residual mechanism exports phase release time, required bytes and a committed-chunk frontier. A controller reserves finite contact service and publishes an expiring schedule version. The runtime accepts a version only when its control context and available service support dependency-safe completion, with explicit progress transfer at an impending contact boundary. This combines application correctness with contact admission and stale-control handling.
The closest measured Project 1 baseline is Theseus running the same schedule candidates and contact/health attributes. A second comparator executes TE-CCL with the same contact matrix, chunk size, look-ahead horizon and solver budget. An MCCS service uses its source-defined drain/reconnect sequence with the same forecast. Record source-faithful runs and orbital adapters separately. Charge the agreement collective, version messages, generation/install time, drain pauses, PAT guard intervals, reduction compute and retry bytes. Use actual dense/MoE training loss and p95 step time alongside collective completion. Continue at a pre-registered ≥15% p95 step reduction across two physically coherent formation bundles and ≤5% charged control cost. Redirect toward a transport/control-bound claim when the strongest adapter matches the improvement or the credible stable-formation workload spends too little time near contact boundaries.
Project 2 tests contact-feasible state commit beyond generic mobility and adaptive compression. Connex already defines logical endpoint epochs and ordered handover. CacheGen and KVServe already adapt KV representation to link/service conditions. The new admission decision couples exact pending state bytes, compression service time, state-version ownership and an ingress/egress contact deadline. It chooses resident decode, pre-stage, compressed transfer or text recomputation, then commits a handover only after the receiver owns the required state frontier. Directory updates and receiver credits carry explicit expiry, while byte accounting covers every relay and retransmission.
The closest measured Project 2 comparator combines forecast-equipped Connex with KVServe, and independently with CacheGen. Implement each codec at the measured version’s precision/quality settings and profile it on the same lab accelerator. Add DualPath relay selection using the same physical paths and charge model traffic and KV traffic to one ISL budget. Match migration opportunities, admitted load, memory, cache residency and forecast error. Report request continuity, TTFT, TPOT, p99 handover token gap, admission by user/load class, completed requests meeting SLOs, commit failures and byte amplification together. Continue at ≥20% lower p99 handover token gap across two independent trace families with equal correctness, quality and admission-fairness targets. Continue as an admission-only study when state-commit scheduling improves accepted-load/SLO behavior while the strongest codec/mobility combination matches continuity. Retire the broad continuity claim when improvements arise from lower admitted load or extra resident memory.
Project 3 tests a coupled expert/terminal reservation with explicit workload phases. Janus already chooses expert-weight transfer versus token dispatch for training, UBEP already optimizes inference expert dispatch, and HyNA already accelerates gradient AllReduce. The residual mechanism defines each communication island by its forecasted terminal/energy/thermal envelope and reserves contact service for expert-version freshness and the required compute phase. Inference pays dispatch, combine and any weight replication. Training additionally pays optimizer/update freshness and backward gradient return. The controller trades placement persistence against refresh bytes while retaining the same routing function and quality target.
For training, the closest measured policy baseline is a contact-feasible Janus selector with the same ratio inputs, expert cache, forecast and gradient-return requirements. For inference, compare a topology-aware UBEP-inspired message dispatch implementation. Label its packet readiness/ACK adapter and report its cost separately from the source’s atomic-memory implementation. Evaluate HyNA-style aggregation in an independent gradient experiment with identical precision, aggregation state, recovery and power budgets. Add Crux priority and TopoOpt topology/placement comparators with common future capacities. Compare the joint reservation against energy-first/network-second and network-first/energy-second schedules under equal total joules and physical resources. Continue at ≥10% more SLO-qualified useful tokens per joule after terminal, codec, replication and cooling-duty costs across skew/forecast/thermal sweeps. Narrow the claim to its observed phase when one phase drives the gain. Retire the joint-reservation claim when a sequential policy matches the latency/energy frontier or expert staleness changes useful work.
These continuation thresholds are proposed experimental decisions. They accompany equal-resource paired runs, confidence intervals over independent trace segments and a correctness gate covering collective tensors, token sequence ownership and expert versions. A compact artifact should include the trace generator, source-faithful baseline configurations, every orbital adapter, control/forecast byte accounting, parameter provenance and a small-instance optimization bound. The resulting paper can then claim the measured contribution of its contact contract under a declared orbital regime.
PReCCL sharpens Project 1’s epoch/progress comparison. Its existing invariant completes CCT e and validates common epoch metadata before applying the immutable allocation for CCT e+1. Its fault path retries a partially failed collective using surviving virtual topologies and an auxiliary socket channel. An orbital extension must therefore test externally bounded contact expiry and delayed control with the same forecasts, candidate VTs and paid recovery bytes. A deadline-admission or partial-progress contract earns its contribution when it improves actual training tails beyond this forecast-equipped epoch policy under matched tensor correctness. Supply its adapter and the proposed system with the same recovery-control service trace, failure evidence, forecast age and retry budget. Measure configured timeout, retry duration and retried bytes, and verify output tensors after each resumed collective.
The gap analysis above establishes the five optical/WAN mechanisms reused by the three experiments. Each experiment tests its stated contact and resource coupling.
Appendix · Primary-paper analysis
Dated census and paper identities
The census distinguishes SIGCOMM main-track satellite systems, two aerial adjacencies, broader satellite-network venues, and direct orbital-AI proposals. The first content column states the application scene. Mechanism and evidence columns indicate what each paper actually contributes. The detailed records below give model, baseline and result provenance.
Coverage by venue and evidence tier
The six requested networking venues appear below with their reviewed-paper counts. SIGCOMM receives the program-audited 2022–2026 appendix. The other venues supply selected representative mechanisms. Foundational 2019–2020 works establish graph and simulation models alongside the recent systems. Supplementary tiers retain separate counts so readers can distinguish publication status from technical evidence.
Venue / tier
Reviewed papers
Mechanism coverage
SIGCOMM
35
Program-audited satellite systems, two aerial adjacencies, and current terrestrial AI and optical baselines.
NSDI
5
Constellation emulation, space edge compute, direct-to-cell control and terrestrial AI baselines.
MobiCom
3
Onboard compute hardware and constellation-scale scheduling.
CoNEXT
2
Topology design and satellite-operator performance measurement.
IMC
3
Operational service measurement and calibrated constellation simulation.
INFOCOM
3
Sunlight-aware compute scheduling, TCP adaptation and secure offloading/resource allocation.
NINeS
1
Distributed in-space image-model training and cloud-coordinated resource planning.
ICNP
1
Constellation performance modeling. The BIER-DC program signal is recorded separately.
CoNEXT Companion
1
A short-paper measurement perspective.
LEO-NET workshop
2
Space-datacenter connectivity and physical feasibility.
arXiv
4
Direct orbital-AI topology, placement, partitioning and feasibility proposals.
A controller allocates traffic across paths in a 4,236-satellite network.
SIGCOMM · 2025 Main conference
Use a heterogeneous graph of satellites, paths and traffic. Three graph-attention modules predict allocations, with capacity trimming and topology/traffic/path pruning.
FCC-derived orbital simulations. 3M population-weighted users and 1,000 gateways. Poisson arrivals 125–500 flows/s. Scaled 200Mbps ISLs and 50Mbps access. Azure A100. Train/test 4:1 across 10,000 snapshots.
A provider synthesizes a sparse constellation for specific geographic demand.
SIGCOMM · 2025 Main conference
Combine diverse Earth-repeat orbits. Approximate supply-demand matching. Preserve geographic intents using orbital MPC. Enforce geographic SRv6 segment anycast.
64,800 candidate tracks, 4,050 cells, three real-demand scenarios. 6,793-satellite Jan2025 reference. Packet-level 1,741-container StarryNet-derived hardware-in-loop. Each modeled satellite offers 3×200Gbps ISL and 96Gbps radio access.
LEO Internet users access content cached on moving satellites.
SIGCOMM · 2025 Main conference
Assign consistent-hash buckets across nearby satellites. Relay fetches from neighboring replicas so content flows against orbital motion. Generate correlated requests using SpaceGEN.
Akamai production object traces seed five-day synthetic traces. CosmicBeats 15s orbital time step. Multiprocess TCP cache replayer. Varied 10–100GB caches and L=4/9 buckets.
Earth-observation satellites transmit compact imagery for cloud reconstruction.
SIGCOMM · 2025 Main conference
Lightweight BLSH image hashing and adaptive sampling run onboard. Cloud MoE wavelet-diffusion super resolution selects experts and checks reconstruction metadata.
Five custom/public datasets: Planet-CAL/HK, FarmVibes, DEN-3/DEN-12. Evaluate compression, mean/worst SSIM/PSNR, onboard processing/storage and downstream wildfire/cropland/plastic tasks.
Transport designers characterize a commercial LEO access bottleneck packet by packet.
SIGCOMM · 2026 Main conference
NetScalpel schedules synchronized UDP burst/rate/cooldown and TCP experiments around 15s cycles. Reconstruct queues from paired timestamps and compare CCAs.
Munich residential terminal plus US east/west validation. AWS Frankfurt near PoP. NTP-calibrated microsecond packet records and 5ms TCP_INFO. Randomized experiments across reconfiguration intervals.
SAR satellites exchange control data through the imaging waveform and reflected echoes.
SIGCOMM · 2026 Main conference
Encode downlink data by chirp-start frequency offsets. Programmable ground metasurface uses differential phase modulation for uplink. Opposite-slope pilots compensate mobility.
Actual commercial satellite supplies uplink IQ echoes and downlink channel traces. Proposed downlink waveform is tested with FPGA channel replay in anechoic chamber. UAV interleaved imaging A/B isolates waveform effects.
Battery-powered ground IoT nodes send sparse sensor reports and bursty images through intermittent LEO contacts.
SIGCOMM · 2026 Main conference
Coded NACK pipelines transmission and repeats compact missing-packet IDs. DtS-FC forecasts contact/link quality, defers costly slots and schedules sleep.
Six-satellite X-SNO measurements. Coded NACK tested on three nodes and production-equivalent ground satellite radios plus channel emulator. DtS-FC deployed on eight nodes for one month in Yunnan.
Moving balloon base stations backhaul LTE service through steerable mesh links.
SIGCOMM · 2022 Main conference
Temporospatial SDN predicts radio feasibility and compiles topology/routing intents. Local tracking, redundant links and hybrid satcom/in-band control support reactive recovery.
Three years of production operation across three continents. Meshes routinely 20+ balloons over 3000+km. Comparison of planned withdrawals with unexpected failures.
Nearly 200 Planet Dove imaging satellites answer prioritized Earth-observation queries.
NSDI · 2024 Main conference
Bifurcate queries into slowly changing ground-precomputed predicates and dynamic onboard predicates. Schedule compute and downlink by query priority.
Planet metadata for ten million images over July 1–20, 2021. Jetson AGX Orin profiling at 15 W and 30 W. Orbit/contact simulation with traditional and distributed ground stations, keeping aggregate downlink constant.
Containerized satellite and terrestrial network software runs against time-evolving constellation links.
NSDI · 2023 Main conference
Combine public orbital information, physical-to-virtual mapping, Linux containers, traffic-control link updates and multi-host manager/worker orchestration.
Eight Dell PowerEdge R740 servers. Starlink, Kuiper and Telesat configurations. Ping/iperf validation against live European Starlink traces and CoreMark checks for virtual compute capacity.
Dense LEO constellations provide low-latency high-capacity inter-satellite paths.
CoNEXT · 2019 Main conference
Enumerate repeating local connectivity motifs, then customize motifs across latitude zones to preserve useful links through orbital motion.
Population-weighted traffic among 1,000 cities, plus GDP-weighted traffic among 100 cities. Inclined 40×40 constellation and planned Starlink/Kuiper. Sweeps of laser range and acquisition time.
Area-to-area satellite connectivity and hybrid cloud/satellite interactive communication.
ICNP · 2020 Main conference
Build orbital area-to-area performance models and constellation scaling. Choose low-latency satellite or cloud relays using measured historical path information.
Constellation simulation plus laptops running WebRTC. Traffic-control reproduces model-predicted satellite delay while cloud routes use measured terrestrial delays.
BUPT-1 carries commodity edge computers in approximately 490 km sun-synchronous orbit.
MobiCom · 2024 Main conference
Instrument live devices and a matched terrestrial counterpart. Compare controlled CPU/accelerator loads, temperature, battery and performance traces.
Six months, over 1,000 experiment hours and 10 million telemetry lines. A 17.44 kg spacecraft with two Huawei Atlas 200 DK boards, two Raspberry Pi boards and two 115 Wh batteries.
Multiple mobile operators lease LEO satellites to serve regular phones and IoT devices.
NSDI · 2024 Main conference
Signed pay-as-you-go service tokens let satellites locally authorize service. Geographic cells and end-to-end mobile sessions stabilize service policy.
Commodity cellular/SIM prototype and constellation-driven signaling simulations. Evaluate multi-operator access, paging load and service resumption.
Consumer Starlink terminals expose signals for inferring serving-satellite assignment.
CoNEXT Companion · 2023 Companion / short paper
Difference consecutive obstruction maps across 15-second slots. Align sky tracks with public orbital predictions. Train a satellite-characteristic predictor.
Real-terminal measurements at geographically distributed sites. 80% training split with five-fold cross validation, 20% holdout and top-k accuracy.
LEO, MEO and GEO satellite operators serve public Internet subscribers.
CoNEXT · 2023 Main conference
Combine ASN/operator classification with latency-distribution filtering, M-Lab and RIPE Atlas data, then collect browser/video experiments from recruited subscribers.
Public longitudinal datasets across 18 satellite operators plus Prolific participant recruitment. The survey identifies 57 satellite subscribers among 14,371 screened participants. Application experiments use their validated subset.
A regular Starlink subscription in Louvain-la-Neuve, Belgium carries Internet and web traffic.
IMC · 2022 Main conference
Run periodic RIPE-anchor pings and Ookla tests, controlled QUIC transfers and BrowserTime experiments. Publish a trace-based ERRANT emulation model.
Five months of latency probes to 11 RIPE anchors, four months of speed tests and top-120 Belgian websites. 100 MB HTTP/3 transfers and light real-time QUIC message streams.
National satellite access supplements international connectivity after submarine-cable failures.
IMC · 2025 Main conference
Build a capacity graph with beam and interference constraints. Allocate terminals and RF resources, then solve global or policy-restricted capacity flows.
Six real cable-failure case studies using RIPE Atlas and Calypso route/cable mappings. Modeled Starlink regulatory configurations and terminal-count sweeps up to 50,000.
End-to-end TCP traffic traverses commercial LEO satellite access and terrestrial Internet paths.
SIGCOMM · 2025 Main conference
Detect ACK-response-interval outliers and PoP ICMP signals. Reset obsolete samples at reconfiguration, combine Kalman/max bandwidth estimates and RTT-band estimates, and transition between dynamic cruise and reconfiguration adaptation.
Linux kernel implementation. Three live Starlink terminals in Madrid, New Jersey and Cebu. Four Oracle servers. Over fifty two-minute tests per CCA. LeoReplayer records 4,800 two-minute traces with saturated UDP plus ICMP probes and replays identical conditions for controlled comparisons.
Earth-observation satellites exchange compact reference embeddings through ground contacts and retain informative image tiles.
SIGCOMM · 2026 Main conference
MobileNetV2 tile embeddings support adaptive cosine-distance change detection. TLE-derived lookup tables remove predicted overlap. A ground planner greedily refines high-change tiles under per-contact embedding budgets.
Ground Jetson Xavier NX/AGX Orin profiling plus simulation of 81 Planet satellites and a scaled 200-satellite Satellogic constellation. Daily DynamicEarthNet images emulate successive orbital revisits. Seven areas cover generic imagery, wildfire and building damage. Model downlink is 160 Mbps and uplink 32 Kbps.
Regular phones and IoT devices access direct-to-cell LEO satellite services under navigation interference and heterogeneous geographic policies.
SIGCOMM · 2025 Main conference
Use serving-satellite delay/Doppler signals for incremental localization, relax geometric accuracy to satisfy radio constraints, derive monotonic trusted time from authenticated signed broadcasts, and authorize services according to the policy region consistent with the position bounds.
Amarisoft Callbox 3GPP-R17/18 IoT/NR-NTN prototype with channels calibrated to real RSRP/SNR and public ephemeris. COTS iPhone 15, Iridium GO and Iridium 9555 satellite tests. USRP B210 gps-sdr-sim and fake NTN radios exercise controlled interference/spoofing.
Low-power, omnidirectional LoRa picosatellite constellations connect global terrestrial IoT devices through intermittent ground contacts.
MobiCom · 2024 Main conference
Choose device transmission probability α divided by the sum of device counts across visible footprints. Beacon-based additive-increase/multiplicative-decrease updates α using channel activity and decoded-packet trends. A centralized conflict-graph scheduler chooses high-RSSI downlinks with receiver diversity.
Three FOSSA picosatellites and two Spanish ground stations ground collision, power and RF-link calibration. CosmicBeats simulates 173 SWARM-derived satellites, 100,000 uniformly distributed devices and 1,048 TinyGS sites for eight hours at one-second epochs, with 100-byte packets generated 5/25/50/100 times daily.
Multi-node GPU clusters run topology- and message-size-specific AllGather, AllToAll and AllReduce for distributed model training.
NSDI · 2023 Main conference
Designer communication sketches constrain logical topology, switch-hyperedge connection policies, algorithm symmetry and input size. TACCL profiles α–β link costs, solves relaxed-routing MILP, greedily orders chunks, then solves contiguity/exact-scheduling MILP and executes generated TACCL-EF in an NCCL-compatible GPU interpreter.
Actual NVIDIA V100 hardware: two DGX-2 nodes or up to four Azure NDv2 nodes in the main 32-GPU evaluation. Standalone collective bandwidth sweeps, sketch/runtime ablations and PyTorch training of Transformer-XL, BERT and an internal MoE workload. Table 2 measures synthesis time. Larger synthesis-only tests reach 80 and 128 GPUs.
A geographically distributed polar constellation executes autoregressive MoE token generation with small onboard computers.
arXiv · 2026 Preprint
Ring-aligned subnets map layers to orbit segments. Central gateways and activation-aware expert assignment associate popular experts with low expected path latency.
A 1056-satellite constellation uses 33 planes ×32 satellites, 550 km, 87° inclination, 200 snapshots, 0.95 link survival, and ≥100 Gbps ISLs. LLaMA-MoE-3.5B activation traces span eight reasoning datasets. Effective modeled CPU throughput is 7.28 GFLOPS.
A satellite chain jointly processes remote-sensing images with partitioned vision transformers.
arXiv · 2026 Preprint
Model splitting and compute–communication overlap combine with learned Gumbel-mask sparsification, quantization and entropy coding.
Hardware profiling uses four Jetson AGX Orin devices and an RTX 4070 Ti server. Simulation uses a 12-satellite orbit with a five-node compute setup, 0.5 Gbps ISLs, ViT-B/L/H/G, EuroSAT and RESISC45.
Earth-observation tasks choose ground processing, local satellite compute, or sunlit peer satellites.
INFOCOM · 2024 Main conference
A mission controller assigns orbital subsets by sunlight budget. Onboard managers choose deadline-feasible ground, local sunlit, or peer execution and arrange local work by deadline and sunlight.
StarryNet containers combine a Dell workstation with a Jetson AGX Orin hardware-in-the-loop node. Starlink and OneWeb orbital configurations, SatNOGS ground stations, four seasons, ship detection, and wildfire segmentation. Compute uses 30/50/60 W. GSL/ISL use 100 Mbps/1 Gbps and 16/10 W. Solar and battery use 120 W and 60 Wh.
Constellation-wide remote sensing coordinates camera attitude, active spacecraft, and prioritized image delivery.
MobiCom · 2025 Main conference
TLE time compensation and attitude calibration feed a coverage distributor and satellite selector on the ground. An onboard two-class queue prioritizes imagery from regions below the coverage-map 25th percentile.
CelesTrak TLEs drive 17 SKYSAT, 50 LEMUR, and 126 FLOCK satellite models. Ground optimization uses an i7/RTX 3080 workstation. Onboard scheduling uses Jetson TX2. The study covers a North American region, stripmap and spotlight modes, and 6/12/24-hour horizons.
Sender-side TCP adaptation improves bulk transfers and video streaming over consumer Starlink access.
INFOCOM · 2025 Main conference
A BBR-derived state machine enters Queue Maintenance at predicted interruption times, temporarily sets CWND to zero, and forces RTT probing during recovery. NTP timing or ACK inter-packet-delay histograms estimate the 15-second phase.
Live Gen-2 Starlink terminal in San Diego connects by 1 Gbps Ethernet to a Linux client. Six AWS servers cover North California, Oregon, Ohio, London, Singapore, and Canada. Linux 6.8.10, iperf3, competing flows, and modified dash.js deliver TCP and Big Buck Bunny DASH measurements.
Remote IoT tasks reach satellite MEC through UAV relays and a HAPS coordinator that authenticates requests.
INFOCOM · 2026 Main conference
Secret-key signal tags support physical-layer authentication at HAPS. Admitted tasks enter joint satellite selection and compute-share optimization solved through alternating offload and resource-allocation subproblems.
Numerical experiments use 50 legitimate and 25 malicious devices across 10×10 km², 25 UAVs, and 3 visible LEO servers with 10 Gcycles/s each. Tasks contain 10 Kb and 200 cycles/bit. IoT access uses 200 kHz at 2.1 GHz, HAPS–LEO uses 100 MHz at 28 GHz.
Earth-observation satellites incrementally train local image models, exchange weights and selected raw imagery, and contribute updates to a ground global model.
NINeS · 2026 NINeS inaugural conference · OASIcs
A cloud planner profiles loss, staleness, predicted compute, and label distributions. It chooses local compute, shortest-path-tree model averaging rooted at the satellite with most ISLs, or utility-ranked raw-data transfer. Ground contacts deliver schedules and model updates.
CosmicBeats orbital traces drive FLUTE/OpenMPI learning simulation: Planet 207 and Spire 117 satellites, 12 ground stations, 24 hours, five-minute windows, 100 Mbps bounded ISLs, and 360 GB storage. Final-five-layer DenseNet-161/fMoW and ResNet-50/So2Sat adaptation uses a Jetson Orin Nano 4 GB compute model. Power assumptions include 7 W solar generation, 7.5 W GPU/ISL demand, and 50 W downlink TX.
Terrestrial DNN training jobs receive dedicated direct-connect optical network partitions co-designed with model parallelization and collective routing.
NSDI · 2023 Main conference
Offline alternating optimization couples FlexFlow MCMC parallelization search with TopologyFinder. Degree is split between AllReduce and model-parallel subgraphs. Coprime TotientPerms rings carry collectives, repeated Blossom matching favors heavy model-parallel edges, and host NIC forwarding supplies multi-hop RoCEv2. Modified NCCL load-balances ring permutations.
FlexNet searches strategies. Htsim-based FlexNetPacket evaluates packet behavior. Simulations include 128-server dedicated and 432-server shared clusters, four A100s per simulated server, degree 4/8, and six DNNs. The prototype uses 12 one-A100 servers, a Telescent patch panel, RoCEv2/PFC, and degree 4×25Gbps interfaces per server, totaling 100Gbps.
Centrally managed GPU training clusters synthesize collective schedules for a known topology and finite communication demand.
SIGCOMM · 2024 Main conference
Discrete epochs track each source chunk in buffers and transmissions. AllGather uses MILP. AllToAll uses a continuous LP because its demand admits a flow interpretation. An A* inspired sequence of bounded-horizon optimizations carries buffer and in-flight state across rounds. Reverse DFS prunes surplus transmissions. MSCCL executes exported schedules.
Most results compute completion from synthesized schedules and profiled link parameters on DGX1, DGX2, NDv2 and two proprietary topologies. Real execution uses two AMD chassis with 32 GPUs. Gurobi 9.5.2 runs on an 80-core/160-thread Xeon Platinum 8380 VM with 512 GB RAM. Comparisons harmonize TACCL switch transit cost.
Cloud providers manage collectives across tenant GPU jobs while preserving an application-facing NCCL-like interface.
SIGCOMM · 2024 Main conference
A shim forwards allocations and collective requests to per-host services through shared-memory queues. CUDA IPC handles share GPU buffers/events. Proxy engines control communicators. Transport engines manage RDMA flows. A control-ring AllGather exchanges last-launched sequence numbers, drains through their maximum, then rebuilds connections.
Four servers hold eight RTX 3090 GPUs and ConnectX-5 100 Gbps NICs. A self-wired SN2100 emulates two leaves/two spines at 2:1 oversubscription. NCCL-derived kernels and trace replay cover VGG-19 data parallelism and GPT-2.7B tensor parallelism. Flow simulation scales to 768 GPUs, 200 Gbps links, 50 ResNet-50 jobs, and five repetitions.
Multi-job training clusters share inter-host paths and PCIe resources. The operator targets aggregate useful GPU computation.
SIGCOMM · 2024 Main conference
Profile GPU intensity, select least-congested paths in descending intensity order, correct priorities for iteration and overlap effects, and compress priorities through a weighted DAG K-cut dynamic program. A daemon probes paths/profiles jobs. The transport layer steers RoCEv2 by UDP source ports and sets priorities, with PCIe semaphores for intra-host contention.
A 96-A100 testbed uses 12 hosts and a two-layer Clos. Real ResNet/BERT/GPT training explores network and PCIe contention. An α–β simulator replays two weeks of 2000+ GPU production traces on two-layer Clos and double-sided topologies with eight priority levels. Individual compute durations come from actual GPUs.
Represent each origin–destination pair as a commodity, with usage variables accounting for shared copies. Decouple spatial routing from temporal scheduling through average lifetime capacity. LP solutions gain feasibility cuts via selective vertex duplication. Mirrored Dantzig–Wolfe exploits full-input symmetry. Tree decomposition plus weighted fair queueing emits uniform chunks.
Simulation models A100 eight-GPU hosts and DOE four-GPU hosts with rail-based interconnects, AllGather/AllToAll, and 64-GPU concurrent collectives. Synthesis runs on 32-core Xeon Gold 6234 with 314 GB RAM. Every competitor uses its largest chunk count completing within three hours.
AllReduce on bidirectional rings and regular multidimensional direct-connect tori, including TPU-like topology families.
SIGCOMM · 2026 Main conference
Each rank communicates simultaneously with peers at ±3^k distance and jointly reduces two incoming messages. A latency variant forwards full vectors in one phase. A bandwidth variant runs ReduceScatter then reverse AllGather with shrinking/growing blocks. Generalization handles arbitrary sizes and parallel dimensions.
Packet-level SST simulations vary rings, square/rectangular 2D tori and 3D tori. Message sizes range 32 B–128 MiB. Default links are 800 Gbps with 100 ns latency, 100 ns per-hop processing, 8192 B packets and 1.5 μs startup per step. Appendices vary bandwidth up to 3.2 Tbps, latency and packet size.
Long-lived TCP flows traverse recurrent electrical/optical time-division paths with sharply different bandwidth and RTT.
SIGCOMM · 2022 Main conference
Maintain per-TDN congestion/RTT/in-flight state and a connection-wide sequence space. ToRs announce path changes by ICMP. Tagged data/ACK state assigns acknowledgments to the correct TDN. Transition-aware recovery separates reordering and loss. Mixed-path RTT samples are filtered. Implemented in Linux 5.8.
Real kernel endpoints run 16 containers on each of two servers. A third server runs Click/DPDK Etalon. The emulated EPS/OCS paths are 10/100 Gbps with 100/40 μs RTT, 180 μs days and 20 μs reconfiguration. Physical ConnectX-3 40 Gbps hardware uses 20× time dilation. 16 synchronized flows run 40 s, primarily at a 6:1 EPS:OCS schedule ratio.
An actual optically switched rack implements periodic connectivity and multi-hop Opera forwarding through commodity Linux endpoints.
SIGCOMM · 2024 Main conference
A passive rotating diffractive disk cycles restricted matchings. A 128-port switch partitions into four staggered 32-port sub-rotors. FPGA Corundum NICs use PTP to align queues, routing and guard masks to the rotor. Defect windows are profiled and transmission pauses before the MAC.
A manufactured 3U 128-port switch with 7 μs reconfiguration and 100% port yield connects 16 cluster servers plus one control server. Each cluster server uses eight 10 Gbps optical links and an FPGA NIC. End-to-end iperf3, ICMP ping, userspace UDP and all-512-path BER measurements test masking, loaded latency and synchronization.
Opera-like varying-expander fabrics retain multi-hop routes during microsecond optical reconfiguration and carry general datacenter traffic.
SIGCOMM · 2025 Main conference
Enforce reverse credit–data symmetry using embedded entry time slices and RTT-length slots. Congested credit queues probabilistically favor fewer remaining hops. Topology-aware rate updates and tentative credits fill spare capacity. Hop-count jitter helps short flows, and Aeolus provides fast start.
htsim models 108 ToRs, six 108-port OCSes and 648 hosts, 100 Gbps links, 500 ns inter-ToR propagation and 15/55 μs slices. Web-search/Hadoop/RPC workloads run at 30% host load with 35% stress. A DPDK/P4 testbed uses three Tofino2 switches, four dual-port ConnectX-6 servers, eight emulated ToRs, 40 Gbps and 100 μs slices.
Long-running GPU applications select among custom collective schedules as expert loads, NIC health and synthesis quality evolve.
SIGCOMM · 2026 Main conference
An asynchronous selection context holds endogenous/exogenous attributes, schedules and policies. Every K requests, a custom AllReduce agrees on common context elements and minimum visible versions. Each rank then deterministically selects the highest-scoring usable schedule. A four-layer resource tree and lazy delta migration reuse scratch buffers, schedule resources, buffer handles and low-level operations.
Four nodes contain 32 A100 SXM4 80 GB GPUs, six NVSwitches per node and four ConnectX-5 dual-100 Gbps NICs per node on two-tier Clos. CUDA 12.4, PyTorch 2.2 and Megatron-LM 0.16 run Qwen3-30B-A3B EP8/EP32 and Llama3-8B DP. HeFFTe exercises 16-GPU AllToAll. Agreement uses K=100. Communicator tests sweep 2–32 GPUs and 10–1000 schedules.
Repeated long contexts are reused across terrestrial LLM serving requests through compressed KV bitstreams fetched from storage or another worker.
SIGCOMM · 2024 Main conference
Change-based encoding exploits adjacent-token locality. Layer-sensitive quantization and channel-layer probability models feed arithmetic coding. A streamer adapts each context chunk between compression levels and text recomputation, while GPU decoding overlaps transmission.
A four-A40 server evaluates Mistral-7B and long-context Llama-34B/70B variants on 662 contexts from LongChat, TriviaQA, WikiText, and NarrativeQA. The main comparison uses 3Gbps. Sensitivity spans 0.4–400Gbps, context length and concurrency. Random per-chunk bandwidth traces cover 0.1–10Gbps, averaged across 20 traces.
Terrestrial PD-disaggregated serving and prefix-cache offloading select KV compression by workload quality and service latency.
SIGCOMM · 2026 Main conference
A composable Transform→Quantizer→Codec pool includes mixed-precision head-wise quantization. Constraint-aware Gaussian-process Bayesian optimization constructs a three-dimensional quality/ratio/throughput Pareto frontier. The controller combines an analytic benefit boundary with a small epsilon-greedy bandit and EWMA latency residuals.
vLLM0.10.1 and lm-eval-harness evaluate Qwen2.5-7B/32B-Instruct and Llama-3.1-8B-Instruct. Profiling uses four A100-40GB GPUs. Serving uses RTX4090/5090, RTXPro6000 and H100 tiers at 10/50/100Gbps. Four profiling datasets and two held-out QA datasets assess generalization. Linux/NIC rate control sweeps bandwidth.
Multi-turn agentic inference reloads high-hit-rate KV state from SSD-backed distributed storage into separate prefill and decode workers.
SIGCOMM · 2026 Main conference
Dual-path loading combines storage→prefill with storage→decode→prefill over the compute RDMA fabric. CNIC-centric traffic management isolates model-critical collectives. Global routing balances storage queues, and a compute-quota scheduler balances attention execution across engines using chunked prefill.
Hopper servers carry eight GPUs, eight 400Gbps compute NICs and one 400Gbps storage NIC. 3FS supplies SSD-backed KV storage. DS660B, an internal DS27B variant and Qwen2.5-32B replay three 500-trajectory agent datasets with 32K/48K/64K context bounds. The scale experiment reaches 48P96D, or 144 servers and 1152 GPUs.
Elastic terrestrial serving changes worker membership while token streams, activations and KV transfers remain in flight.
SIGCOMM · 2026 Main conference
A stable logical-endpoint mobility contract combines epoch/lease routing, prepare→cutover→commit handover, sequence-based deduplication, receiver credits and traffic-class isolation. ZeroMQ supplies control coordination. Pooled UCX/RDMA connections and capability-aware transport selection carry tensor data.
Five servers each contain four A40-48GB GPUs and 100Gbps ConnectX-6 NICs behind one full-bisection switch. Splitwise-derived request lengths drive PD and PP workloads. Joins/leaves, 30–120s preemption intervals, bursty loads and directory tests to 2000 mock endpoints evaluate churn. The source labels its serving model Llama3-13B.
Distributed sparse-MoE training can choose an expert-centric token exchange or a data-centric expert-weight fetch for each MoE block.
SIGCOMM · 2023 Main conference
Janus selects communication paradigm through a traffic-volume threshold. Credit-bounded expert buffers, hierarchical per-machine caching and gradient merging, fine-grained asynchronous fetch, PCIe/NVLink-aware pull ordering and layer-ahead prefetch overlap communication with compute.
Four machines contain 32 A100-SXM80GB GPUs, 200Gbps NICs and NVLink/NVSwitch within each machine. Experiments train twelve-block MoE-BERT, MoE-GPT and MoE-Transformer-XL with 32 experts per MoE block. Batch/sequence sensitivity and a pyramidal-residual MoE variant cover 16/32GPU configurations.
MoE inference dispatch on hierarchical superpod fabrics exposes globally addressable memory and low-latency remote access.
SIGCOMM · 2026 Main conference
Kernel decomposition splits communication dependencies across accelerator vector cores. Hierarchical token scheduling balances hop-distance classes. Data-as-Flag combines payload readiness with atomic writes through Token-Flag Fusion, Data Checksum or Sentinel Polling.
A production CM384 allocation contains 16 Ascend servers and 256 NPU dies. Experiments sweep 16–256 ranks, batch size, expert count and top-k. End-to-end serving covers Qwen3-30B, GLM-4.7, DeepSeek-R1 and DeepSeek-V3.2, spanning 30B–685B parameters. Operator latency and inference TPOT are separate metrics.
Terrestrial training gradient AllReduce uses in-switch accumulation with a fast integer pipeline and embedded exception cores.
SIGCOMM · 2026 Main conference
HyNA couples an RMT line-rate INT32 aggregation path with on-chip RISC-V exception handling for collisions and FP32 overflow recovery. A precision-aware protocol dynamically quantizes gradient blocks, tracks aggregation slots and handles recovery through an on-chip exception loop.
An AlveoU280 FPGA at 250MHz implements 100Gbps aggregation. Two physical servers with ConnectX-5 NICs replay closed-loop gradient traces as 256 logical workers, preserving BSP acknowledgment barriers. Traces include Llama3-70B and DeepSeek-V2-236B. Separate Llama3-8B/Qwen7B training on a C4 slice checks convergence over 5000 iterations.
Aerial user equipment accesses commercial terrestrial sub-6GHz5G cells during controlled low-altitude UAV flights.
SIGCOMM · 2026 Main conference
A DJI Matrice400 carries four matched smartphones and an XCAL mini-PC. IPerf3 cloud backends measure application performance alongside PHY/MAC/RRC indicators. Controlled routes vary altitude, speed, environment, time and band while holding other parameters fixed.
Shenzhen urban/rural campaigns span four operators and approximately 300GB of time-aligned traces. Main flights use altitudes below 400m and speeds up to 15m/s, single-carrier 5GSA on n41/n78/n79. An appendix measures a separate 5G-A carrier-aggregation hotspot at 120–500m. Four 500Mbps cloud backends and paired-device checks control measurement artifacts.
A short-range indoor FSO link supplies high-bandwidth data to a moving VR headset with translation and rotation.
SIGCOMM · 2022 Main conference
The tracking system supplies headset pose to a learned pointing function that outputs four steering voltages for TX/RX galvo mirrors. Two-stage geometric calibration learns each mirror assembly and their relative coordinate mapping. Commodity SFP optics implement 10G and 25G links.
Bench prototypes span 1.5–2m, using a linear rail, rotation stage and hand-held mixed movement.10G and 25G iPerf tests measure throughput and received optical power. Trace replay uses 500 one-minute head-motion traces from 50 viewers, 10ms pose reports and measured 1–2ms steering latency.
Photonic scale-up domains with typically 8–64 GPUs, predetermined step-wise collective traffic, bounded per-GPU optical port degree, and GPU multi-hop forwarding. A synchronized controller can choose each topology and the reconfiguration instants.
SIGCOMM · 2026 Main conference
Partition collective steps into contiguous intervals. Each interval receives one optimized topology from a degree-constrained maximum-concurrent-flow MISOCP. A dynamic program chooses interval boundaries and then the reconfiguration count. Recursive Doubling connectivity and interval-topology structure yield an analytical subproblem with polylogarithmic schedule synthesis and cached schedules.
ASTRA-sim packet-level extensions, flow/numerical optimization, and an eight-GPU emulation testbed cover 8–64-GPU scale-up domains. Analytical Recursive Doubling runtime scales to 1024 modeled nodes. Simulated ports use 800 Gb/s. The eight BlueField-3 NICs use 100-Gb/s optics and GPUDirect RDMA. NCCL operations execute step by step. Measured runtimes are summed with a supplied fixed switch penalty. Reconfiguration latency spans 10 ns–10 ms.
Rail-optimized scale-out ML clusters with predictable hybrid-parallelism phases, strong scale-up connectivity, commodity one-to-one OCS circuits, per-rail orchestrators and an application-level coordination network.
SIGCOMM · 2026 Main conference
A PyTorch shim profiles the first five steps, intercepts collectives, classifies management versus data traffic and identifies phase boundaries. A per-job controller synchronizes ranks and issues topology IDs to per-rail OCS orchestrators. Locks and completion callbacks drain affected traffic before circuit changes. Provisioning starts the next configuration after the previous phase. Per-stage sub-mappings permit asynchronous pipeline progress.
Physical hardware: four dual-L40 servers, a 64-port Polatis 6000 OCS, dual ConnectX-6 Dx NICs per server and two 100-Gb/s rails, running six-layer Llama-3. Perlmutter emulation executes TorchTitan training up to 64 A100 GPUs with logically enforced circuit connectivity and injected switching delays. ASTRA-sim with Chakra traces evaluates dense/MoE iteration times up to 2048 modeled H200/B200 GPUs, 0–1000-ms switching and 100–1600-Gb/s scale-out links.
Distributed MoE training on a terrestrial GPU cluster augments a global electrical packet fabric with runtime-reconfigurable regional optical circuits. TP remains inside the local scale-up domain. Regional EP traffic uses OCS, while DP and PP use the electrical fabric.
SIGCOMM · 2025 Main conference
Regional topology controllers collect expert demand. A greedy bottleneck-pair algorithm allocates degree-bounded circuits and permutes NIC mappings for NUMA locality. The custom RDMA collective runtime delegates inter-server EP traffic through gateway GPUs, overlaps inter-host and intra-host transfers, and retains hierarchical DP all-reduce on EPS. Four collective matrices within a layer share identical or transposed structure. Available compute phases hide later reconfigurations.
Production profiling uses 128 H800 GPUs and 128 ConnectX-7 400Gbps NICs. The prototype has four servers, 32 A100 GPUs, 16 ConnectX-6 100Gbps NICs, a32×32 Polatis OCS and SN3700 Ethernet switch. Each server assigns 3 NICs to OCS and 1 to EPS. RoCEv2, NCCL and ibverbs carry real Megatron-LM training of truncated Mixtral8×7B, LLaMA-MoE and Qwen-MoE models. FlexFlow plus htsim evaluates full Mixtral8×7B/8×22B, Qwen-MoE and DeepSeek-R1 configurations, normally 1024 GPUs, 100–800Gbps links, 1µs propagation and 25ms OCS setup. Scale sweeps reach 32768 GPUs.
Dense LLM training across heterogeneous terrestrial GPU clusters shares a constrained WAN. The planner combines resource selection, intra-DC parallelism, inter-DC pipeline partitioning, memory buffering and bandwidth allocation.
SIGCOMM · 2026 Main conference
An Analyzer prunes resource subsets through optimistic latency and cost bounds. The Orchestrator greedily shifts contiguous layers away from straggler stages or expands activation buffers to hide WAN delay, then adjusts bandwidth toward the rate needed by the compute window. The Runtime combines virtual-hard-pipe time slots with work-conserving interleaving, candidate-plan failover, synchronized Check-and-Commit launch and RDMA gateway buffering through final receiver commit ACK.
A six-node physical testbed has 48 GPUs, 24 H20-141GB and 24 V100-32GB. Each server has four ConnectX-7 100Gbps NICs. The cross-cluster WAN spans 2000km with 10Gbps capacity and 20ms RTT. Experiments cover dense OPT1.3B–175B and Qwen1.5 1.8B–72B families. Simulations extend to 256–1024 mixed V100/H20/A100/H100 GPUs across 4–16 clusters. Two-cluster traces validate simulator error within 5%. Reported metrics include throughput, iteration/memory prediction error and planner latency.
Repeated training collectives share heterogeneous virtual topologies in multi-tenant GPU clusters, where one slow topology delays the entire collective.
SIGCOMM · 2026 Main conference
Four modules collect FIFO stall counts, choose valid cross-VT policies, compute allocation and enforce it at collective boundaries. Ring/Tree use independent contiguous tensor blocks. AlltoAll uses an intra-node, single-relay GPU policy that prices the extra hop. Epoch-tagged piggyback metadata carries VT ordering and checksum. All ranks validate and deterministically derive the next allocation after the current collective completes, retaining existing NCCL transport connections. Partial-VT failure triggers auxiliary socket signaling, masking, collective retry and lightweight recovery probes.
The real testbed has four servers with 32 Hopper GPUs, 80 GB HBM per GPU, eight 400 Gbps ConnectX-7 NICs per server, NVLink/NVSwitch and a two-tier leaf–spine fabric. NCCL v2.29 and Megatron-LM run concurrent GPT, Qwen-MoE and BERT training. Multiverse simulates 512/1024 GPUs with Poisson job arrivals and random four-host placements. Matched testbed bus-bandwidth points agree within 6%. A separate 300-job Crux-placement replay runs on 1024 H200 GPUs. The production trial compares 146 completed jobs over two weeks with a preceding two-week NCCL period on 1024 H200 GPUs across 256 servers. Appendix K labels this evidence observational.
SIGCOMM program audit: inclusion and yearly counts
The audit classifies title and abstract entries in each official main-track program. Inclusion covers satellite-targeted networking, satellite systems and satellite-enabled communication. Loon is recorded as a stratospheric adjacency in 2022. The low-altitude 5G study is recorded as an aerial adjacency in 2026. The broader-venue corpus is a curated mechanism map. The main-track census uses an explicit program-level rule and then checks the included primary texts.
The inclusive SIGCOMM review uses a central satellite-substrate census and an explicit adjacency ledger. Title/abstract screening identifies candidate papers. Full primary text determines the substrate and reusable mechanism. The 22-work comparator table contains twenty-one AI/fabric works plus Cyclops, so Cyclops retains one paper identity across both views. Loon and the UAV measurement work extend the aerial background. The central count remains eleven papers across 2022–2026. The ledger makes each additional scope decision reviewable.
Scope and identity
Primary-text substrate
Adjudication and reusable evidence
Count and source
Central satellite systems
SpaceCore. LeoCC. DeepSpace. SaTE. TinyLEO. SN2. StarCDN. CommSAR. Planet-IoT. Dissecting Starlink. CoOrbit each directly studies an orbital/satellite substrate or its network service.
Include in the satellite main-track census. Preserve paper-specific satellite, trace, emulation and component scopes when interpreting results.
A stratospheric balloon mesh uses aerospace links, trajectory prediction and software-defined network control.
Include as aerial-network adjacency. Its predictive control and production-network methodology support the satellite tutorial. Balloon motion and atmospheric operations define its measured substrate.
Flying smartphones access commercial terrestrial sub-6 GHz cells. The main controlled campaigns operate below 400 m and up to 15 m/s.
Include as aerial-measurement adjacency. Aligned PHY/MAC/RRC/application tracing and controlled mobility attribution transfer to measurement design. Orbital propagation and beam geometry receive separate models.
An indoor moving-headset FSO terminal performs pose-based optical pointing over 1.5–2 m hardware links.
Include as optical-terminal adjacency and cross-reference the comparator table. Pose calibration, tracking delay and tolerance decomposition motivate orbital PAT experiments with their own range/environment parameters.
1 terminal-adjacency identity, also present in the 22-work comparator table. Cyclops full primary text.
Include as explicit novelty comparators. Their established mechanisms define strong transferred baselines. Matched orbital adapters isolate finite-contact, stale-control and physical-resource effects.
21 AI/fabric identities. Together with Cyclops, 22 full-primary-text comparator records. Source links and version/evidence scopes appear in the terrestrial comparison table.
The inclusion rule covers main-track papers with satellite networking as the target substrate, plus two explicitly scoped aerial-network comparisons. The year-by-year program audit in the companion evidence record establishes coverage. Detailed records preserve source locations, quantitative conditions and the actual evaluation method.
2022
A Case for Stateless Mobile Core Network Functions in Space
A phone on the ground whose mobile core functions run on satellites overhead.
Problem formulation
The satellite moves fast, so the per-user state inside the core keeps migrating from one satellite to the next, and the signaling needed to move it grows with every handover.
Algorithm and system design
SpaceCore separates what the function does from what it remembers. Service areas anchor to a fixed geographic grid rather than to a spacecraft. The device itself holds its authenticated state as a cryptographic token, so whichever satellite is overhead can retrieve it locally.
Mathematical and graph model
A taxonomy that splits function from state, geographic grid addressing, orbital dynamics, protocol state machine analysis and cryptographic state tokens.
This source-derived operational predicate restates Algorithm 1’s local-delivery branch. D=(α_d,γ_d) is the destination’s geospatial address, S=(α_s,γ_s) is the current satellite location in the paper’s affine spherical grid, and Δ_S is its coverage radius expressed in the same angular coordinate units. A destination inside both coverage intervals triggers paging and direct delivery. Other packets enter the neighbor-selection branches. The geospatial destination stays fixed as satellites move, so the forwarding decision uses location rather than per-user orbital migration state. The square interval test is the algorithm’s grid abstraction of radio coverage.
§4.1, Algorithm 1, lines 1–2: stateless geospatial relaying. Operational predicate transcribed from the algorithm.
A Raspberry Pi 4 stands in for the satellite, UERANSIM emulates devices and Open5GS runs the home core. Signaling datasets come from Tiantong and Inmarsat in service and from terrestrial 5G, and a replay extends the result to constellation scale.
Baselines
5G non-terrestrial access, SkyCore, Baoyun and DPCM, with several protocol-function splits for further comparison.
Results and evidence conditions
Under Starlink-like replay, satellite signaling falls by a factor of 122.2 against 5G non-terrestrial access, 17.5 against SkyCore, 40.3 against DPCM and 49.3 against Baoyun.
Operating assumptions and evidence scope
The deployed evidence covers terrestrial protocol hardware and traces, while constellation behaviour comes from orbital replay. Keeping state at the endpoint asks for device support and trustworthy token processing.
A controller that spreads traffic across paths in a network of 4,236 satellites.
Problem formulation
A solver takes long enough that its answer describes a network that has already moved on.
Algorithm and system design
Satellites, paths and flows form one heterogeneous graph. Three graph-attention modules predict the allocation directly, a trimming step pulls overloaded links back inside capacity, and pruning over topology, traffic and paths keeps the graph small enough to stay fast.
Mathematical and graph model
Path-based multi-commodity throughput maximization, supervised training on labels from Gurobi, and topology sampling by a determinantal point process.
Appendix A Equation (2.a–f) maximizes admitted network throughput. x_fp allocates flow f to feasible path p. Φ_pe is one when p uses link e. C_e is its capacity. D_f is demand. F_n^up and F_n^dn denote the source/destination flow subsets used by the paper’s satellite uplink and downlink constraints. All x, C and d use consistent rate units, so U is aggregate rate. Link, access and demand limits are separate constraints. SaTE learns allocations from solver-generated labels, then trims overload to enforce feasibility (§3.3). Measured throughput includes that correction. This formulation is a static snapshot TE target, with runtime topology and demand updating its inputs.
Appendix A, Equation (2.a–f), PDF proceedings p911. §3.3 explains constraint trimming. F_n subsets restate the paper’s f↑n / f↓n notation.
Orbits come from FCC filings. Three million population-weighted users and a thousand gateways generate Poisson arrivals at 125 to 500 flows per second, over inter-satellite links scaled to 200 Mbps and access at 50 Mbps. Training uses an Azure A100 with a four to one split across 10,000 snapshots.
Baselines
Gurobi, POP, ECMP with water filling, backpressure satellite routing, Teal and HARP.
Results and evidence conditions
Inference returns an allocation in 17 milliseconds on average, which is 2,738 times faster than the solver it learns from. Satisfied demand improves 23.5 percent with cross-shell lasers and 46.6 percent with ground relays. Incremental path calculation takes a further 56 milliseconds on average.
Operating assumptions and evidence scope
The gain depends on charging computation delay to every method, and offline Gurobi remains the reference optimum. Scaled capacities carry relative trends. The objective maximizes aggregate throughput, which leaves per-flow fairness as an extension.
An operator choosing which satellites to fly for a demand map that is concentrated in a few places.
Problem formulation
A uniform shell spreads supply evenly over a world whose demand sits in patches, so satellites fly where nobody needs them and the control plane tracks every one of them.
Algorithm and system design
TinyLEO mixes Earth-repeat orbits of different shapes, matches that supply to demand with an approximation algorithm, holds the geographic intent in place with model predictive control, and forwards by geographic SRv6 anycast so the control plane names places instead of satellites.
Mathematical and graph model
Constellation synthesis as an integer program, a greedy matching approximation, model predictive control and geographic reachability verification.
Equations (2)–(4) minimize constellation size subject to spatial demand coverage at every considered time. x_j is the satellite count assigned to candidate Earth-repeat ground track j. A_t(i,j) is the fractional coverage of geographic cell i by that candidate at time t. Y_t is demand in the paper’s normalized satellite-capacity units. A_t x and y_t therefore share supply/demand units, while ||x||₁ is a count. T_max spans the least common multiple of the orbital repetition periods. The integer domain includes zero, matching the sparse allocation initialized in Algorithm 1. TinyLEO unfolds all times into one sparse matching problem and approximates this ILP using matching pursuit. This aggregate formulation couples its coverage constraints across the repetition horizon.
§4.1, Equations (2)–(4) and Algorithm 1. N in the source is written as nonnegative integers here to expose the initialized-zero domain.
The search covers 64,800 candidate tracks and 4,050 cells against three real demand scenarios, with the January 2025 reference constellation of 6,793 satellites as the comparison. Packet-level runs use a 1,741-container hardware-in-the-loop setup derived from StarryNet, where each modeled satellite carries three 200 Gbps inter-satellite links and 96 Gbps of radio access.
Baselines
Starlink, MegaReduce, and a Gurobi v12.0 synthesis stopped at two months of solving. Routing and control comparisons appear in sections 6.2 and 6.3.
Results and evidence conditions
Strict demand matching needs 1,763, 3,344 and 1,066 satellites for customer, backbone and Latin-American demand, against 6,793 in the reference. Allowing 99 percent availability brings those to 1,391, 3,184 and 865. Planning takes 6.5 to 7.7 hours, and control cost improves by one to three orders of magnitude.
Operating assumptions and evidence scope
The headline factor of 7.9 corresponds to regional demand at 99 percent availability. Capacity and synthesis assumptions decide feasibility. Global access traffic differs in shape from all-to-all cluster traffic.
Original Figure 6 · TinyLEO links offline demand matching and orbit planning to a model-predictive controller and geographic forwarding. Its small constellation targets geographically uneven demand, making coverage an explicit design variable.Paper source · Open the full-resolution figure
StarCDN: Moving Content Delivery Networks to Space
Main conferenceA/C · Orbital content delivery
SIGCOMM · 2025 · William X. Zheng; Aryan Taneja; Maleeha Masood; Anirudh Sabnis; Ramesh K. Sitaraman; Deepak Vasisht
Built for
Users of a LEO Internet service reading content that is cached on the satellites themselves.
Problem formulation
A satellite moves, so the users it serves change continuously, and a cache filled for one population arrives over another.
Algorithm and system design
Consistent hashing spreads content buckets across nearby satellites. A fetch relays to the neighbouring replica that holds the bucket, so content effectively travels against orbital motion. A generator called SpaceGEN produces correlated request streams for the experiments.
Mathematical and graph model
Consistent hashing over a replica graph, trace-driven cache replay under LRU, and a tradeoff between bucket count and added latency measured against observed locality.
This source-derived tiling identity formalizes §3.2’s repeating √L×√L content-bucket assignment for the grid examples L=4 and L=9. i and j index orbital-grid neighbors, c is a zero-indexed satellite color/bucket label, and h maps an object o to a bucket using the source’s consistent-hash partition. All indices are integer labels. Every q×q tile contains each bucket once. A terminal’s first-contact satellite routes to the selected bucket owner. On a cache miss, §3.3’s relayed fetch contacts a same-bucket inter-plane neighbor, countering orbital motion. The expression transcribes the grid construction and assumes integer q. It is a coloring mechanism, and the paper evaluates the cache redundancy versus fetch-latency tradeoff as L changes.
Akamai production object traces seed five days of synthetic traffic. Orbits advance in fifteen-second steps under CosmicBeats, a multiprocess TCP replayer drives the caches, and the sweep covers caches from 10 to 100 GB with four and nine buckets.
Baselines
A naive LRU cache, an ideal static satellite cache, a hashing-only version of StarCDN, and measured latency from a terrestrial CDN and from an idle Starlink link.
Results and evidence conditions
Ground-to-space bandwidth falls to 20 to 25 percent of uncached access. Modeled median latency reaches 22 milliseconds against 55 milliseconds observed on an idle Starlink link. With 9.7 percent of satellites unavailable, bandwidth savings hold at 74 percent.
Operating assumptions and evidence scope
The latency analysis estimates propagation, so queueing and onboard processing call for further measurement. More buckets add inter-satellite latency, and failures lower the hit rate.
Original Figure 5 · StarCDN hashes content placement against counter-orbital motion and relays retrieval along orbital paths. The illustrated data path should be read with the simulator’s cache and delay assumptions.Paper source · Open the full-resolution figure
DeepSpace: Super Resolution Powered Efficient and Reliable Satellite Image Data Acquistion
Main conferenceE/C · Observation and ground delivery
SIGCOMM · 2025 · Chuanhao Sun; Yu Zhang; Bill Tao; Deepak Vasisht; Mahesh K. Marina
Built for
Earth-observation satellites sending imagery to the ground through short and infrequent downlinks.
Problem formulation
Images are large, the downlink is brief, and the satellite has little compute, little storage and an uplink of roughly ten kilobits per second.
Algorithm and system design
The satellite runs lightweight hashing and adaptive sampling. The ground runs a mixture-of-experts wavelet diffusion model that restores resolution and picks the right expert. Similarity checks on the reconstruction metadata decide when the original tile needs sending after all.
Mathematical and graph model
Image distance geometry, compression ratio optimization, fidelity constraints expressed through structural similarity, diffusion models, and similarity checks run after reconstruction.
Equations (7) and (8) define the post-reconstruction quality checks used by the outlier retransmission path. I_in is the received low-resolution image. S downsamples the reconstructed high-resolution image I_recon. I_real is the stored original image. SSIM is structural similarity, HD is Hamming distance between binary locality-sensitive hashes, and wℓ is the image-size normalization stated by the paper. LRS and HSIM are dimensionless similarity scores. Reconstruction metadata carries the original hash and image dimensions to the cloud. A score below its configured threshold triggers retrieval of the retained original. These are concrete retransmission tests, while the thresholds and empirical downstream fidelity establish their operating scope.
Five datasets cover custom and public imagery, namely Planet-CAL, Planet-HK, FarmVibes, DEN-3 and DEN-12. Measurement covers the compression ratio, mean and worst structural similarity and peak signal to noise ratio, onboard processing and storage, and the downstream tasks of wildfire, cropland and plastic detection.
Baselines
Lanczos interpolation, the compressive sensing methods ADMM, gOMP and CoSaMP, the learned codecs DSCN, DCSN and VQ-VAE-2, the satellite systems Kodan and Earth+, and the super-resolution models WaveDiff and SR3.
Results and evidence conditions
Mean compression ratio runs from 146.4 to 320 depending on the dataset. On Planet-HK at a ratio of 256 the reconstruction reaches 0.91 structural similarity and 37.3 dB, against 0.80 and 33.5 dB for WaveDiff. The uplink carries about ten kilobits per second.
Operating assumptions and evidence scope
The ground performs most of the neural computation. Fidelity is measured on images and on the tasks that follow them, so a distributed language-model collective would call for its own workload.
Original Figure 2 · DeepSpace sends low-resolution imagery and metadata to the ground, reconstructs high-resolution output using a mixture-of-experts super-resolution system, and uses an uplink feedback path for reliability.Paper source · Open the full-resolution figure
LeoCC: Making Internet Congestion Control Robust to LEO Satellite Dynamics
A TCP connection runs from a laptop, through a commercial LEO terminal, and on across the Internet.
Problem formulation
The satellite link reconfigures every fifteen seconds. Capacity and base round-trip time both jump at that instant. Standard congestion control reads the jump as congestion and backs off.
Algorithm and system design
LeoCC watches the spacing between acknowledgements and the ICMP replies from the operator's point of presence, and treats an outlier as the moment of reconfiguration. Samples from before that moment get discarded. Two bandwidth estimates then run in parallel, a moving maximum and a Kalman filter, while the controller moves between a cruising state and an adaptation state around each event.
Mathematical and graph model
Intervals cut at each reconfiguration, a state machine over the sending rate, Kalman and moving-extremum filters, and a delay band that tells a real bottleneck apart from jitter.
Equation (2) maintains two bandwidth estimates over the same reconfiguration-truncated sample window. dRate_t is the sender’s observed delivery rate in a consistent bandwidth unit. T, W_BW and t_last_Rcf use seconds or the implementation’s matching time unit. The aggressive estimate takes a maximum. The moderate estimate applies the specified Kalman filter. The latest detected reconfiguration clips the historical window, preventing samples from the previous network condition from influencing the new interval’s estimates. Kal denotes the specified filtering operation over the samples. The rate controller uses these parallel estimates in Dynamic Cruise and separately enters Reconfiguration Adaptation on an event.
§4.2.1, Equation (2): parallel reconfiguration-aware bottleneck-bandwidth estimators. Notation shortened from the paper’s bBW subscripts.
The controller runs as a Linux kernel implementation against three live Starlink terminals in Madrid, New Jersey and Cebu, with four Oracle servers on the far side and more than fifty two-minute runs per algorithm. A companion tool, LeoReplayer, records 4,800 two-minute traces and replays them so every algorithm meets identical conditions.
Baselines
Reno, CUBIC, Vegas, BBRv1, BBRv3, VIVACE, Proteus, Copa, Verus, Sage and SaTCP. SaTCP receives LeoCC's own reconfiguration detector as its handover signal, which separates the value of the detector from the value of the rest of the design.
Results and evidence conditions
Throughput rises 85 to 494 percent against CUBIC, Copa and BBRv3. Delay falls 44 to 56 percent against BBRv1 and VIVACE. Average utilization sits at 95.2 percent for LeoCC and 95.8 percent for BBRv1, so the gain comes from holding that utilization at a lower delay.
Operating assumptions and evidence scope
LeoReplayer rests on the queue separation and access-link behaviour measured on Starlink. An optical cluster fabric would need its own calibration for reconfiguration, queueing and failure. Fairness against BBRv1 reaches a Jain index of 0.98 to 0.99 in the tested configuration.
Original Figure 6 · LeoCC detects reconfiguration at the endpoint, estimates the path under that event history, and adapts probing and rate control. Its measurement signal comes from subscriber access rather than formation-local optical telemetry.Paper source · Open the full-resolution figure
Direct-to-Cell Satellite Network without Satellite Navigation
Main conferenceA · Communication constellation
SIGCOMM · 2025 · Wei Liu; Yuanjie Li; Jingyi Lan; Hewu Li; Yimei Chen; Lixin Liu; Jiabo Yang; Xi Long; Li Ouyang; Minghao Tang; Jianping Wu; Qian Wu; Jun Liu; Zeqi Lai
Built for
An ordinary phone or IoT device reaching a direct-to-cell satellite service while satellite navigation is jammed or spoofed.
Problem formulation
Radio synchronization, satellite authentication and policy authorization all read position and time from a navigation service, so losing that service costs all three at once.
Algorithm and system design
SN² derives an incremental position region from the delay and Doppler of the serving satellite, and relaxes the geometric accuracy until it is just enough to satisfy timing advance and frequency error. Monotonic trusted time comes from authenticated signed broadcasts. A service is authorized once every point in the validated region shares one policy.
Mathematical and graph model
Localization from time difference of arrival and Doppler, feasible regions for timing advance and frequency error, monotonic timestamp ordering, geometric intersection of policy and beam, and protocol state machines.
This source-derived operational invariant formalizes §4.3’s policy-homogeneity branch. U is the terminal’s validated location region, obtained from beam coverage and available navigation/calibration information. Policy_f(x) is the roaming policy for service f at location x. If every candidate location has the same policy p, the satellite can select that policy using the region, then apply the service’s accuracy and trust checks. The equation concerns policy identification. Table 1 separately assigns service-specific spatial precision, including emergency-service requirements. U is a geographic set, p is a policy label, and the predicate carries logical units. The formulation explains how coarse network-oriented navigation can safely authorize common services while refined positioning serves the ambiguous branch.
§4.3, Flexible Non-Blocking Authorization, Figure 15 and Table 1. Source-derived invariant for the homogeneous-policy case, with a separate service-precision check.
An Amarisoft callbox running 3GPP Release 17 and 18 non-terrestrial profiles carries the prototype, with channels calibrated to real signal strength and public ephemeris. Live tests use a COTS iPhone 15, an Iridium GO and an Iridium 9555. A USRP B210 running gps-sdr-sim and a fake non-terrestrial radio supply controlled interference and spoofing.
Baselines
3GPP non-terrestrial access, Globalstar satellite access on the iPhone, an Iridium GO with navigation available, and Iridium 9555 localization from delay and Doppler.
Results and evidence conditions
Service activation runs 7.2 to 23.5 times faster where navigation is available, and 4.4 times faster than Iridium localization once navigation is disrupted. First radio access runs 7.4 to 12.3 times faster with navigation and 1.9 times faster under disruption. Authentication costs up to 0.025 percent of radio resource at a twenty millisecond broadcast period.
Operating assumptions and evidence scope
The headline multiplier describes faster service activation, and an uptime percentage would need its own availability metric. Spoofing results come from channel-calibrated protocol hardware, while the real-device tests ground the behaviour of operators already in service.
Original Figure 1 · The source diagram locates timing, position and policy checks across direct-to-cell access. SN² reuses communication satellites for its navigation assistance. The evaluation separates radio access, authentication and authorization.Paper source · Open the full-resolution figure
2026
Dissecting the StarLink: Characterizing Queuing and Flow Dynamics in the Starlink Network
Main conferenceA · Communication constellation
SIGCOMM · 2026 · Hendrik Cech; Nitinder Mohan; Jörg Ott
Built for
A transport designer who wants to know what the commercial LEO bottleneck does packet by packet.
Problem formulation
Throughput and round-trip averages hide how the operator allocates bandwidth, what queue policy runs, and when the link resets.
Algorithm and system design
A tool called NetScalpel schedules UDP bursts, rate steps and cooldowns together with TCP runs, all aligned to the fifteen-second cycle. Paired timestamps on each side then reconstruct the queue, and the same schedule drives several congestion controllers for comparison.
Mathematical and graph model
Event-based queue reconstruction under a head-drop assumption, a capacity ramp that follows demand, paired Wilcoxon tests and equivalence testing.
This measurement identity transcribes Algorithm 1. Synchronized send/receive timestamps use seconds. D_min is minimum observed one-way delay. D̂_p^q estimates a received packet’s queue sojourn in seconds. Enqueue events at t_tx add one packet, dequeue events at t_rx−d_min remove one, and estimated head-drop events remove one at the interpolated drop time. The running sum Q̂ is packets. The source restricts baseline-based reconstruction primarily to short measurements within one reconfiguration interval, documents a 3–5 ms downlink queue-arrival offset, and discusses clock synchronization, cross traffic and loss attribution. Therefore this is an estimator conditioned on the stated baseline and head-drop model. It exposes queue dynamics through calibrated endpoint observations.
§3.3, Algorithm 1, lines 2–19. Following limitations paragraph specifies the reconstruction assumptions and timing offsets.
A residential terminal in Munich carries the main campaign, with east and west US terminals for validation and an AWS Frankfurt host near the point of presence. Packet records carry microsecond timestamps calibrated by NTP, TCP state is sampled every five milliseconds, and experiments are randomized across reconfiguration intervals.
Baselines
Head-drop against tail-drop queue models, conceptual checks against RED and CoDel, and the controllers BBRv1, BBRv3, CUBIC and SatPipe together with the slow-start variants HyStart, HyStart++, SEARCH and SUSS.
Results and evidence conditions
The downlink queue holds roughly 1,500 packets and the uplink roughly 4,000. Demand lifts the 100 and 30 Mbps baselines by 3.4 and 2 times within 400 milliseconds. Bandwidth resets every fifteen seconds. Flows stay isolated in delay while sharing downlink loss.
Operating assumptions and evidence scope
The findings describe the Starlink implementation and the terminals measured. Inter-satellite paths and operator-internal state call for further observability, and demand-driven replay should preserve the way traffic depends on itself.
Original Figure 1 · NetScalpel coordinates client and server packet measurements around controlled experiments. Queue and flow conclusions are inferred from observed access-link packets and retain the measured locations and terminal conditions.Paper source · Open the full-resolution figure
CommSAR: Enabling Bidirectional Communication in SAR Imaging Satellites via Shared Waveform
A radar imaging satellite that needs a control channel without carrying a radio for it.
Problem formulation
Dedicated communication hardware costs mass, spectrum and power on every satellite in a constellation.
Algorithm and system design
CommSAR hides the downlink inside the imaging waveform by offsetting where each chirp starts. The uplink comes from a programmable ground metasurface that modulates the reflected echo in differential phase. Pilots with opposite slopes cancel the motion between satellite and ground.
Mathematical and graph model
Linear frequency modulated signal equations, matched filtering and radar cross section, Doppler estimation, differential binary phase shift keying, and bit error rate against signal to noise ratio.
Equation (9) bounds the uncoded downlink symbol rate using waveform orthogonality. B is SAR chirp bandwidth in Hz, T_p is pulse duration in seconds, and f_PRF is pulse repetition frequency in pulses/s. The time–bandwidth product BT_p counts resolvable orthogonal symbol choices. Log₂(BT_p) is the ideal bits per pulse, making R_down bit/s. The associated FFT frequency resolution is Δf=1/T_p Hz. For the paper’s B=600 MHz, T_p=15 μs and f_PRF=8 kHz, the ideal expression gives approximately 105.1 kbps. Practical modulation chooses an integer alphabet and includes synchronization, coding and impairment costs. The bound describes that SAR waveform substrate, distinct from an optical AI fabric.
§3.1, Equation (9), Downlink Data Rate Analysis. Equation (5) defines the cyclic-shift symbol waveform.
A commercial satellite in service supplies the uplink echoes and the downlink channel traces. The proposed downlink waveform is replayed through an FPGA in an anechoic chamber. A drone flying interleaved imaging passes isolates what the shared waveform does to the picture.
Baselines
Standard radar imaging with a linear frequency modulated waveform, conventional Doppler compensation, and SARLink as a reference for uplink rate.
Results and evidence conditions
The waveform reaches 105 Kbps on the downlink and 112 Kbps on the uplink. Imaging quality is reported through resolution and the peak and integrated sidelobe ratios.
Operating assumptions and evidence scope
Each component sits at its own level of flight or testbed evidence. Rates in the hundreds of kilobits suit control traffic, and an orbital AI fabric would call for a separate high-bandwidth optical design.
SIGCOMM · 2026 · Ziyue Zhang; Xianjin Xia; Ruonan Li; Jinhong Liu; Yuanqing Zheng; Linghe Kong; Mo Li
Built for
Battery-powered sensors on the ground that send sparse readings up through whatever satellite happens to pass over.
Problem formulation
Retransmissions, unlucky contact slots and long stretches of listening all drain the battery and stretch delivery time.
Algorithm and system design
A coded negative acknowledgement keeps transmission flowing while compact identifiers repeat which packets are still missing. A forecaster called DtS-FC predicts contact windows and link quality, skips the expensive slots and schedules the radio to sleep through them.
Mathematical and graph model
Contact window prediction, optimization of the deadline and repetition count that reliability needs, and a lookahead flow-control optimization over energy and latency.
Appendix G.2 Equation (2) chooses radio-on windows w_i inside F predicted contacts c_i. R is bit/s. |w_i| is seconds. Π̂_i is Beacon-reception probability, so T̂_i is expected delivered bits. ΔT̂_i is normalized throughput loss relative to the full contact. Ê_i is modeled joules, making Ê_i/T̂_i joules/bit. p̂_i predicts long-tail delivery probability. The weighted constraint limits the fraction of expected delivered bits experiencing long-tail latency to τ. The objective combines throughput and energy through the paper’s sensitivity weight σ. Numerical scaling of σ must be retained because it mixes normalized loss with energy per bit. The ratio uses schedules with positive delivered volume. Candidate windows are finite transmission-slot selections. Measured Beacon traces calibrate the prediction model.
Appendix G.2.1–G.2.2, Equation (2), DtS Flow Control. Throughput, energy and long-tail definitions immediately precede the objective.
Six X-SNO satellites supply the measurements. The coded acknowledgement runs on three nodes against production-equivalent ground radios and a channel emulator. The forecaster runs on eight nodes deployed for one month in Yunnan.
Baselines
The satellite IoT protocol currently in operation, with the coded acknowledgement and the forecaster evaluated separately.
Results and evidence conditions
In ground tests the coded acknowledgement raises throughput 2.1 times and cuts transmissions by 75.1 to 83.3 percent. In the live deployment the forecaster takes the share of packets arriving later than twenty minutes from 23 percent down to 11 percent, and cuts energy per bit by 38 percent.
Operating assumptions and evidence scope
The production deployment validates the ground side of the forecaster, and satellite-side integration of the acknowledgement rests on ground-test evidence. Capacity for 200 to 300 concurrent nodes extrapolates from eight-node tests and simulation.
Original Figure 17 · The design combines coded loss feedback, orbit-aware flow control and sleep scheduling. Coded NACK hardware experiments and the live eight-node DtS-FC deployment supply separate quantitative evidence.Paper source · Open the full-resolution figure
Achieving Efficient Storage and Communication via Collaboration
Main conferenceE/C · Observation and ground delivery
Earth-observation satellites that photograph the same ground again and again, and have to choose what to keep and what to send down.
Problem formulation
Consecutive passes return nearly the same image, and neighbouring satellites photograph overlapping ground. Storage and downlink both pay for that repetition. The uplink that would coordinate the fleet runs at 32 Kbps.
Algorithm and system design
A MobileNetV2 embedding summarizes each image tile. A tile stays when its cosine distance from the reference clears a threshold set at the mean plus one standard deviation. Lookup tables built from orbital elements drop the overlap that geometry already predicts, and a ground planner spends each contact's small budget on the tiles that changed most.
Mathematical and graph model
Cosine similarity with an adaptive threshold, geometric prediction of revisit and overlap, greedy tile splitting through a priority queue, and storage measured as bytes integrated over time.
Equation (1) compares current and reference tile embeddings. §3.2 then sets the per-image threshold to mean plus standard deviation of tile distances. z_i^t and z_i^{t−1} are embeddings of the same geographic tile at two observation times, with positive vector norms. D_i is a dimensionless cosine distance. μ_d and σ_d are computed across that image’s tile distances. Tiles above T remain for downlink. The other branch marks redundancy and discards the tile. This is a semantic-change filter calibrated on the paper’s imagery, with compact references propagated through scheduled ground contacts. Embedding distance and empirical change detection establish retention quality. The equation itself defines the decision rule.
§3.2, Equation (1), and the immediately following adaptive-thresholding paragraph.
Jetson Xavier NX and AGX Orin boards supply the processing profile on the ground. Simulation covers 81 Planet satellites and a scaled 200-satellite Satellogic constellation. Daily DynamicEarthNet images stand in for successive revisits across seven areas that include generic scenes, wildfire and building damage. The modeled downlink runs at 160 Mbps and the uplink at 32 Kbps.
Baselines
Storing and downlinking every full image, ablations that keep only the lookup tables or only the planner, and comparisons against Earth+, DeepSpace and the CCSDS 123.0-B-2 compression standard.
Results and evidence conditions
For the Australian area of interest, storage measured in byte-hours falls by a factor of 108.6 and communication volume by 41.6 against full downlink. Base processing stays under two seconds per image on the AGX Orin, and both boards draw under ten watts. A wildfire scene in the Pilbara improves storage by a further factor of 10.9.
Operating assumptions and evidence scope
Collaboration follows contact schedules mediated by the ground. Daily images stand in for same-day revisits, so temporal granularity, embedding-based recall of change, and the buffers around orbital elements set the fidelity. The hardware evidence profiles terrestrial edge boards.
Original Figure 1 · CoOrbit uses compact reference embeddings for temporal changes, TLE-derived overlap planning across satellites, and uplink-budget-aware reference updates. The three panels connect storage and transmission cost to observation redundancy.Paper source · Open the full-resolution figure
Adjacent substrates: stratospheric mesh and aerial 5G
SDN in the Stratosphere: Loon’s Aerospace Mesh Network
Main conferenceX · Stratospheric adjacency
SIGCOMM · 2022 · Frank Uyeda; Marc Alvidrez; Erik Kline; Bryce Petrini; Brian Barritt; David Mandle; Aswin Chandy Alexander
Built for
Balloons in the stratosphere carrying LTE service, linked to each other by steerable radios.
Problem formulation
Wind moves every balloon, and the atmosphere decides which links close, so the usable topology changes while the control channel itself varies in reliability.
Algorithm and system design
Loon predicts which radio links will be feasible, then compiles topology and routing intents from that forecast. Local tracking, redundant links and a control plane that runs over both satellite and in-band paths handle what the forecast misses.
Mathematical and graph model
Physical link-budget models, a constrained solver over topology and routing, predictive control, and operational distributions of failure and recovery.
Evaluation methodology
Three years of production operation across three continents, with meshes that routinely spanned more than twenty balloons over 3,000 kilometres. Planned link withdrawals serve as the controlled comparison against unexpected failures.
Baselines
Planned withdrawals against failed links, together with variants in architecture and transceiver count.
Results and evidence conditions
Among routes restored within five minutes, anticipated failures recover 37.8 percent faster on average. Three quarters of control-plane recoveries finish within twenty seconds, and 92.4 percent of them reuse links that already exist.
Operating assumptions and evidence scope
Stratospheric balloons form a neighbouring non-terrestrial regime, with wind-driven trajectories and radio links that depend on the atmosphere. Orbital satellites call for parameters of their own.
Original Figure 5 · Loon’s temporospatial controller predicts directional link feasibility, compiles connectivity intents and actuates the moving mesh. Weather-driven balloon motion gives this adjacent substrate its own prediction uncertainty.Paper source · Open the full-resolution figure
SIGCOMM · 2026 · Xinzhe Liu; Jianer Zhou; Xiaoyong Ni; Ke Luo; Zhenyu Li; Xiaofeng Tao; Weichao Li
Built for
A drone flying below 400 metres while its onboard phones use ordinary terrestrial 5G cells.
Problem formulation
Flying in three dimensions changes both the propagation and the set of cells in view. Configured MIMO, nominal handover success and aggregate throughput can all look healthy while the application suffers.
Algorithm and system design
A DJI Matrice 400 carries four matched smartphones and an XCAL mini-PC. iPerf3 backends in the cloud record application performance beside the physical, MAC and radio-control indicators. Routes vary altitude, speed, environment, time and band one factor at a time.
Mathematical and graph model
An explanation that runs from flight parameters through path loss, multipath and cell visibility into spatial layers, modulation order, allocated resource blocks and handover events, supported by controlled interventions and conditional comparisons.
Evaluation methodology
Urban and rural campaigns around Shenzhen cover four operators and roughly 300 GB of time-aligned traces. Main flights stay below 400 metres and 15 metres per second on single-carrier 5G standalone over bands n41, n78 and n79. An appendix measures a carrier-aggregation hotspot between 120 and 500 metres.
Baselines
Matched ground runs, fixed routes that control altitude and speed, comparisons across operator, band and environment, redundant Galaxy S25 checks, and carrier aggregation against single carrier.
Results and evidence conditions
Aerial runs show lower throughput in both directions and higher round-trip time than ground runs. The spatial layer count actually achieved explains capacity better than the configured MIMO scale. Some handovers complete their signaling and then stall on the uplink. Rising altitude strengthens line of sight dominance.
Operating assumptions and evidence scope
The scope is airborne clients of terrestrial base stations. A satellite study can carry over the aligned cross-layer tracing and the controlled attribution, while orbital distance, kilometre-per-second motion, space beam scheduling and vacuum optical terminals each need their own models.
Original Figure 1 · Original Figure 1 connects the UAV measurement payload, terrestrial base stations and cloud probes. It visualizes the scope and reusable cross-layer measurement method for mobility studies.Paper source · Open the full-resolution figure
Broader venues and direct orbital-AI research
These primary works extend the main-track census across measurement, emulation, space edge computing and direct orbital-AI designs. Their venue tiers and evaluation substrates remain explicit. Each analysis identifies which mechanism transfers to the temporal AI-fabric question.
Satellite-network systems and evaluation
Known Knowns and Unknowns: Near-realtime Earth Observation Via Query Bifurcation in Serval
Main conferenceE/C · Observation and ground delivery
NSDI · 2024 · Bill Tao; Om Chabra; Ishani Janveja; Indranil Gupta; Deepak Vasisht
Built for
Nearly 200 Planet Dove imaging satellites answer prioritized Earth-observation queries.
Problem formulation
Downlink queues place urgent imagery behind large background collections. Onboard compute and energy budgets constrain image filtering.
Algorithm and system design
Bifurcate queries into slowly changing ground-precomputed predicates and dynamic onboard predicates. Schedule compute and downlink by query priority.
Mathematical and graph model
Boolean query composition, spatial intersections, contact schedules, compute queues and solar/battery energy accounting.
Evaluation methodology
Planet metadata for ten million images over July 1–20, 2021. Jetson AGX Orin profiling at 15 W and 30 W. Orbit/contact simulation with traditional and distributed ground stations, keeping aggregate downlink constant.
Baselines
In-order delivery, in-order delivery with distributed ground stations. Component ablations of compute, weather prediction and historical forest labels. OEC-inspired filtering comparison.
Results and evidence conditions
At 15 W, traditional-station median latency drops from 78.2 h to 1.1 h. Distributed-station median drops from 71.71 h to 0.03 h. The 47-minute P90 headline uses the distributed-station condition.
Operating assumptions and evidence scope
Results describe prioritized imagery and metadata predicates. Cluster-scale LLM collectives require accelerator and fabric measurements. Distributed ground stations contribute separately to latency gains.
Containerized satellite and terrestrial network software runs against time-evolving constellation links.
Problem formulation
Thousands of mobile nodes require synchronized geometry, network-state updates and realistic software execution on terrestrial hosts.
Algorithm and system design
Combine public orbital information, physical-to-virtual mapping, Linux containers, traffic-control link updates and multi-host manager/worker orchestration.
Mathematical and graph model
Orbit propagation, geometric link feasibility, time-dependent graph mapping, resource capping and distributed event synchronization.
Evaluation methodology
Eight Dell PowerEdge R740 servers. Starlink, Kuiper and Telesat configurations. Ping/iperf validation against live European Starlink traces and CoreMark checks for virtual compute capacity.
Baselines
Hypatia, StarPerf, live Starlink measurements and physical-device CoreMark reference.
Results and evidence conditions
A 4,408-satellite configuration initializes in 21.2 minutes using seven workers. 1-second updates consume 39.6% host CPU in the reported setup.
Operating assumptions and evidence scope
Fidelity follows the configured orbit, topology, link model and available traces. Commercial scheduler inference and future optical-terminal behavior call for explicit calibration.
IMC · 2020 · Simon Kassing; Debopam Bhattacherjee; André Baptista Águas; Jens Eirik Saethre; Ankit Singla
Built for
Proposed Starlink, Kuiper and Telesat constellations carry packet-level Internet traffic.
Problem formulation
Orbital motion changes path delay, routing and link load while TCP reacts to the evolving packet sequence and queues.
Algorithm and system design
Precompute orbital and forwarding snapshots, feed them into ns-3 packet simulation, and visualize trajectories through Cesium.
Mathematical and graph model
Time-varying +Grid graph, shortest paths, continuous geometric propagation delay, discrete-event queues and transport state.
Evaluation methodology
FCC/ITU planned constellation parameters. Validation against NetworkX Floyd–Warshall paths and ns-3 ping. TCP CUBIC and UDP workloads. Runtime scaling across traffic rates.
Baselines
Analytical shortest-path distance, ns-3 ping consistency checks, alternative ground-station and routing configurations, TCP/UDP flow scenarios.
Results and evidence conditions
On one 2.26 GHz Xeon L5520 core, a 10 Gbps flow over 10 simulated seconds takes approximately 33 minutes for UDP and 100 minutes for TCP. Packet experiments expose motion-induced RTT changes and reordering.
Operating assumptions and evidence scope
The model represents specified planned topology and forwarding policies. Runtime cost grows with packet count. RF scheduling, live commercial TE and terminal dynamics require dedicated models.
Original Figure 2 · Hypatia’s plotted slowdown relates simulator wall-clock cost to virtual traffic demand. Geometry generation and packet execution have distinct costs, so scale claims should specify the traffic and timing configuration.Paper source · Open the full-resolution figure
Dense LEO constellations provide low-latency high-capacity inter-satellite paths.
Problem formulation
Bounded optical-terminal degree, link range and moving geometry create a combinatorial topology-design problem.
Algorithm and system design
Enumerate repeating local connectivity motifs, then customize motifs across latitude zones to preserve useful links through orbital motion.
Mathematical and graph model
Mixed integer linear programming. Degree and visibility constraints. Weighted objective Mα=α·stretch+hop count. Symmetry reduction and exhaustive motif search.
Evaluation methodology
Population-weighted traffic among 1,000 cities, plus GDP-weighted traffic among 100 cities. Inclined 40×40 constellation and planned Starlink/Kuiper. Sweeps of laser range and acquisition time.
Baselines
+Grid neighbor connectivity. ILP on small city sets. Uniform motif and latitude-dependent multi-motif variants.
Results and evidence conditions
Multi-motif designs improve the weighted hop/stretch objective by up to 54% for Starlink and 45% for Kuiper relative to +Grid. These percentages describe the paper’s network-efficiency objective.
Operating assumptions and evidence scope
Hop count serves as a capacity proxy. Throughput and collective completion require explicit capacities, queues and workload placement. Motif symmetry assumes regular constellation structure.
Original Figure 6 · The topology motif adds selected cross-orbit links to a repeating structure. The illustrated endpoints show how local link choices alter global path alternatives under satellite terminal constraints.Paper source · Open the full-resolution figure
StarPerf: Characterizing Network Performance for Emerging Mega-Constellations
Main conferenceA · Communication constellation
ICNP · 2020 · Zeqi Lai; Hewu Li; Jihao Li
Built for
Area-to-area satellite connectivity and hybrid cloud/satellite interactive communication.
Build orbital area-to-area performance models and constellation scaling. Choose low-latency satellite or cloud relays using measured historical path information.
Original Figure 2 · StarPerf separates constellation topology, network policy, extracted traffic and performance computation. This modularity makes physical and forwarding assumptions visible inputs to each reported result.Paper source · Open the full-resolution figure
Deciphering the Enigma of Satellite Computing with COTS Devices: Measurement and Analysis
Main conferenceD/E · Onboard hardware evidence
MobiCom · 2024 · Ruolin Xing; Mengwei Xu; Ao Zhou; Qing Li; Yiran Zhang; Feng Qian; Shangguang Wang
Built for
BUPT-1 carries commodity edge computers in approximately 490 km sun-synchronous orbit.
Problem formulation
Thermal coupling, sunlight-dependent energy and device execution interact under satellite operating conditions.
Algorithm and system design
Instrument live devices and a matched terrestrial counterpart. Compare controlled CPU/accelerator loads, temperature, battery and performance traces.
Mathematical and graph model
Energy accounting, orbit-aligned sunlight profiles, thermal-response analysis and matched workload microbenchmarks.
Evaluation methodology
Six months, over 1,000 experiment hours and 10 million telemetry lines. A 17.44 kg spacecraft with two Huawei Atlas 200 DK boards, two Raspberry Pi boards and two 115 Wh batteries.
Baselines
Ground counterpart with matching compute devices, thermal construction and workloads. Load/thread/frequency and battery-depth sweeps.
Results and evidence conditions
Thermal throttling yields up to 10% performance reduction in the measured devices. Sustained 9 W operation over 10 hours creates temperatures above 30°C and instability in the reported configuration.
Operating assumptions and evidence scope
The six-month experiment grounds edge-device energy and thermal models. GPU-rich orbital clusters require device-specific radiation, radiator and sustained-power evidence.
Original Figure 1 · The BUPT-1 platform carries Atlas 200 DK accelerators and Raspberry Pi controllers, with separate data and TT&C ground paths. The platform supplies orbital COTS evidence for the tested payload and applications.Paper source · Open the full-resolution figure
Multiple mobile operators lease LEO satellites to serve regular phones and IoT devices.
Problem formulation
Hop-by-hop cellular sessions couple satellite operators, mobile operators and devices as orbital movement repeatedly changes their relationship.
Algorithm and system design
Signed pay-as-you-go service tokens let satellites locally authorize service. Geographic cells and end-to-end mobile sessions stabilize service policy.
Mathematical and graph model
Protocol state machines, cryptographic trust tokens, function-split deadlines, geographic service mappings and orbital trace replay.
Evaluation methodology
Commodity cellular/SIM prototype and constellation-driven signaling simulations. Evaluate multi-operator access, paging load and service resumption.
Baselines
3GPP transparent satellite pipe, onboard distributed-unit and onboard full-RAN function splits. SpaceCore comparison. Module ablations.
Results and evidence conditions
Reported service-resumption latency improves 4.71–14.25× and signaling costs improve 850–7,640× in the evaluated multi-tenant mobility conditions.
Operating assumptions and evidence scope
Results concern access authorization and mobile-session control. Orbital datacenter collectives need separate high-bandwidth transport and accelerator experiments.
Making Sense of Constellations: Methodologies for Understanding Starlink’s Scheduling Algorithms
Companion / short paperA · Communication constellation
CoNEXT Companion · 2023 · Hammas Bin Tanveer; Mike Puchol; Rachee Singh; Antonio Bianchi; Rishab Nithyanand
Built for
Consumer Starlink terminals expose signals for inferring serving-satellite assignment.
Problem formulation
Public terminal observations must separate physical satellite visibility from the operator’s assignment decisions.
Algorithm and system design
Difference consecutive obstruction maps across 15-second slots. Align sky tracks with public orbital predictions. Train a satellite-characteristic predictor.
Mathematical and graph model
Map differencing, dynamic time warping, orbital geometry, random-forest classification and feature-importance analysis.
Evaluation methodology
Real-terminal measurements at geographically distributed sites. 80% training split with five-fold cross validation, 20% holdout and top-k accuracy.
Baselines
A predictor that ranks clusters by the number of visible available satellites.
Results and evidence conditions
Top-5 allocated-satellite characteristic accuracy reaches 65%, versus 22% for the availability-count baseline.
Operating assumptions and evidence scope
The model predicts characteristic clusters in measured northern-latitude sites. Satellite identities, other latitude ranges and firmware revisions require fresh validation. Venue status is CoNEXT Companion.
Original Figure 3 · Starlink obstruction-map samples expose scheduling signatures at the terminal. The companion study uses these observations to infer service patterns. Operator-internal decisions require their own telemetry.Paper source · Open the full-resolution figure
Dissecting the Performance of Satellite Network Operators
LEO, MEO and GEO satellite operators serve public Internet subscribers.
Problem formulation
Operator-level measurements need robust access identification, broad vantage coverage and application-level evidence.
Algorithm and system design
Combine ASN/operator classification with latency-distribution filtering, M-Lab and RIPE Atlas data, then collect browser/video experiments from recruited subscribers.
Mathematical and graph model
Kernel density estimation, longitudinal empirical distributions, operator/access classification and measurement-sample validation.
Evaluation methodology
Public longitudinal datasets across 18 satellite operators plus Prolific participant recruitment. The survey identifies 57 satellite subscribers among 14,371 screened participants. Application experiments use their validated subset.
Baselines
Cross-operator LEO/MEO/GEO comparisons, terrestrial references and access-specific webpage/video comparisons.
Results and evidence conditions
Measured Starlink access adds approximately 30–40 ms relative to favorable terrestrial connectivity. Remote PoP choice produces roughly doubled latency in the Philippines example.
Operating assumptions and evidence scope
Public speed tests and recruited users define the sample. ASN filtering, single-flow TCP behavior and geolocation quality shape interpretation.
Original Figure 1 · The SNO study maps autonomous-system records to satellite operators before analysing M-Lab measurements. Its flowchart exposes operator-identification and prefix-filtering choices that affect the measurement population.Paper source · Open the full-resolution figure
Five months of latency probes to 11 RIPE anchors, four months of speed tests and top-120 Belgian websites. 100 MB HTTP/3 transfers and light real-time QUIC message streams.
The nearby-anchor minimum RTTs shown in the paper fall near 20–29 ms. Loaded-transfer experiments reveal queue-related latency and losses beyond those minimum values.
Operating assumptions and evidence scope
One Belgian terminal and the early-2022 deployment define this measurement regime. Subsequent constellation and terminal revisions benefit from fresh calibration.
Original Figure 1 · The first-look study plots Starlink RTT distributions across measured sites. Site, gateway path and concurrent load form part of the observed latency, which motivates later controlled trace and queue experiments.Paper source · Open the full-resolution figure
Assessing LEO Satellite Networks for National Emergency Failover
Main conferenceA · Communication constellation
IMC · 2025 · Vaibhav Bhosale; Ying Zhang; Sameer Kapoor; Robin Kim; Miguel Schlicht; Muskaan Gupta; Ekaterina Tumanova; Zachary S. Bischof; Fabián E. Bustamante; Alberto Dainotti; Ahmed Saeed
Built for
National satellite access supplements international connectivity after submarine-cable failures.
Problem formulation
Population placement, RF beams, spectrum reuse, gateways and policy jointly cap country-scale backup capacity.
Algorithm and system design
Build a capacity graph with beam and interference constraints. Allocate terminals and RF resources, then solve global or policy-restricted capacity flows.
Six real cable-failure case studies using RIPE Atlas and Calypso route/cable mappings. Modeled Starlink regulatory configurations and terminal-count sweeps up to 50,000.
Baselines
Population-proportional terminal placement, greedy capacity balancing, global versus domestic-restricted TE and alternative RF configurations.
Results and evidence conditions
Table 1 bounds range from 41 Gbps for Tonga to 4,653 Gbps for South Africa. Comparison to lost cable capacity ranges from 0.9% for Great Britain to 434% for Haiti.
Operating assumptions and evidence scope
Capacity values are optimistic graph bounds conditioned on terminal placement and RF configuration. The represented interference model covers intra-satellite reuse. Weather, terrain and inter-satellite interference motivate refinement.
Original Figure 3 · CosmoSim models gateways, satellites and cell-channel demand nodes to evaluate emergency failover capacity. Demand aggregation and radio-resource allocation determine the meaning of a simulated national-scale result.Paper source · Open the full-resolution figure
CosMAC: Constellation-Aware Medium Access and Scheduling for IoT Satellites
Low-power, omnidirectional LoRa picosatellite constellations connect global terrestrial IoT devices through intermittent ground contacts.
Problem formulation
Devices inside overlapping satellite footprints cause multi-receiver uplink contention, while broadcast downlink transmissions interfere across distributed ground stations.
Algorithm and system design
Choose device transmission probability α divided by the sum of device counts across visible footprints. Beacon-based additive-increase/multiplicative-decrease updates α using channel activity and decoded-packet trends. A centralized conflict-graph scheduler chooses high-RSSI downlinks with receiver diversity.
Mathematical and graph model
Poisson data generation and binomial transmission/collision probabilities. Weighted maximum independent set on satellite-ground link vertices with interference, receiver exclusivity and diversity-distance edges. Randomized approximation plus greedy reliability repair for K≥2 receivers.
P15
$$p_d=\frac{\alpha}{\sum_{i=1}^{K}|N_{Sat_i}|}$$
Equation (1) sets an IoT device’s randomized transmission probability using the estimated device populations in its K overlapping satellite footprints. The denominator deliberately sums footprint populations, so an overlap device contributes contention across several footprints. It represents overlap-weighted load. α is the dynamically tuned flow-control parameter broadcast through Beacon feedback. Population counts and α yield a dimensionless probability, with operational tuning keeping p_d within its probability domain. §4.3 uses aggregate under-/over-utilization feedback to adjust α. The model controls contention on sparse RF contacts, while its measured throughput/fairness evaluates the overlap approximation and the feedback loop.
Three FOSSA picosatellites and two Spanish ground stations ground collision, power and RF-link calibration. CosmicBeats simulates 173 SWARM-derived satellites, 100,000 uniformly distributed devices and 1,048 TinyGS sites for eight hours at one-second epochs, with 100-byte packets generated 5/25/50/100 times daily.
Baselines
UTPF, an Aloha transmission-probability function based on a single footprint. Fixed-probability FP-Aloha with p=25/100000. L2D2 maximal-matching downlink scheduler. Combined UTPF+L2D2 and FP-Aloha+L2D2 end-to-end baselines.
Results and evidence conditions
The paper reports up to 6.5× aggregate end-to-end throughput. At 50 packets/device/day, Figure 10 reports 1,388 bps for CosMAC, 211 bps for UTPF+L2D2 and 922 bps for FP-Aloha+L2D2. Median downlink receiver diversity is 12 ground stations in simulation.
Operating assumptions and evidence scope
Live experiments validate component behavior and simulator models. Throughput gains come from large-scale simulation. CAD collision sensing uses a ground receiver with two transmitting satellites because launched firmware is fixed. Device-location estimates and distributed ground-station backhaul define additional assumptions.
Original Figure 2 · CosMAC combines device-local overlap-aware random access, satellite-beacon aggregate flow feedback, and a cloud-computed conflict-graph downlink schedule. This original overview separates uplink collisions from one-to-many downlink interference.Paper source · Open the full-resolution figure
In-Orbit Processing or Not? Sunlight-Aware Task Scheduling for Energy-Efficient Space Edge Computing Networks
Main conferenceE · Observation/contact fleet
INFOCOM · 2024 · Weisen Liu; Zeqi Lai; Qian Wu; Hewu Li; Qi Zhang; Zonglun Li; Yuanjie Li; Jun Liu
Built for
Earth-observation tasks choose ground processing, local satellite compute, or sunlit peer satellites.
Problem formulation
Eclipse execution increases battery depth of discharge. Task deadlines limit opportunities to defer computation until sunlight.
Algorithm and system design
A mission controller assigns orbital subsets by sunlight budget. Onboard managers choose deadline-feasible ground, local sunlit, or peer execution and arrange local work by deadline and sunlight.
Mathematical and graph model
A slotted visibility graph and binary task variables minimize average battery energy subject to deadlines. Generalized-assignment hardness motivates a decomposition into knapsack orbit assignment, orbit-based offloading, and processing arrangement.
Evaluation methodology
StarryNet containers combine a Dell workstation with a Jetson AGX Orin hardware-in-the-loop node. Starlink and OneWeb orbital configurations, SatNOGS ground stations, four seasons, ship detection, and wildfire segmentation. Compute uses 30/50/60 W. GSL/ISL use 100 Mbps/1 Gbps and 16/10 W. Solar and battery use 120 W and 60 Wh.
Baselines
OEC, MHSPO, and L2D2 compare orbital processing, peer offloading, and direct ground delivery.
Results and evidence conditions
Figure 7 reports up to 54.8% lower maximum depth of discharge. Figure 8 estimates battery lifespan up to 2.9× versus OEC and 5.3× versus MHSPO under the Starlink configuration.
Operating assumptions and evidence scope
Battery lifespan follows a depth-of-discharge model calibrated from prior studies. The prototype measures terrestrial compute and emulates orbital connectivity. Radiator, radiation faults, and tightly coupled collectives require additional models.
Original Figure 5 · PHOENIX combines a ground mission controller with onboard task managers. Sunlight prediction guides orbital subset assignment and deadline-feasible ground, local, or peer processing.Paper source · Open the full-resolution figure
SpaceSched: A Constellation-Wide Scheduling System for Resolving Ground Track Congestion in Remote Sensing
Main conferenceE · Observation/contact fleet
MobiCom · 2025 · Zehua Sun; Tao Ni; Pengfei Hu; Tao Gu; Weitao Xu
Built for
Constellation-wide remote sensing coordinates camera attitude, active spacecraft, and prioritized image delivery.
Problem formulation
Overlapping observation footprints concentrate coverage and create redundant imagery, satellite use, and downlink backlog.
Algorithm and system design
TLE time compensation and attitude calibration feed a coverage distributor and satellite selector on the ground. An onboard two-class queue prioritizes imagery from regions below the coverage-map 25th percentile.
Mathematical and graph model
Geographic coverage grids, attitude profiles, hard-soft penalty objectives, genetic population search, and binary subset selection balance coverage gain, active count, and attitude variation.
Evaluation methodology
CelesTrak TLEs drive 17 SKYSAT, 50 LEMUR, and 126 FLOCK satellite models. Ground optimization uses an i7/RTX 3080 workstation. Onboard scheduling uses Jetson TX2. The study covers a North American region, stripmap and spotlight modes, and 6/12/24-hour horizons.
Baselines
The plain constellation uses zero off-nadir angle, the entire satellite set, and a sequential downlink queue. Component sensitivity includes population generations, attitude ranges, step sizes, and coverage tolerance.
Results and evidence conditions
Figure 10 gives coverage 52.38/84.24/98.93% versus 29.24/55.17/65.63%, active counts 11/31/53 versus 17/50/126, and data-load reductions 15.83–23.43×. The SKYSAT horizon sweep in Figure 11 reaches 1.84× coverage and 36.46× lower data load.
Operating assumptions and evidence scope
Ground-track congestion measures observation-footprint overlap. The load metric is the imagery fraction needed to attain 95% expected coverage. Packet latency and transport goodput require separate measurements. The evaluated baseline is a plain constellation.
Original Figure 6 · SpaceSched couples TLE-based constellation coordination, ground coverage optimization, satellite subset selection, and onboard prioritized image queues. The target is overlapping observation coverage and imagery delivery.Paper source · Open the full-resolution figure
SATPIPE: Deterministic TCP Adaptation for Highly Dynamic LEO Satellite Networks
Main conferenceA · Communication constellation
INFOCOM · 2025 · Ding Zhao; Xinyu Zhang; Myungjin Lee
Built for
Sender-side TCP adaptation improves bulk transfers and video streaming over consumer Starlink access.
Problem formulation
Periodic service interruptions create excess in-flight queues and inaccurate BBR bandwidth estimates, delaying recovery after link service resumes.
Algorithm and system design
A BBR-derived state machine enters Queue Maintenance at predicted interruption times, temporarily sets CWND to zero, and forces RTT probing during recovery. NTP timing or ACK inter-packet-delay histograms estimate the 15-second phase.
Mathematical and graph model
Deterministic phase estimation modulo 15 seconds, transport state machines, bandwidth-delay product, and application QoE functions connect interruption timing to queues and bitrate.
Evaluation methodology
Live Gen-2 Starlink terminal in San Diego connects by 1 Gbps Ethernet to a Linux client. Six AWS servers cover North California, Oregon, Ohio, London, Singapore, and Canada. Linux 6.8.10, iperf3, competing flows, and modified dash.js deliver TCP and Big Buck Bunny DASH measurements.
Baselines
Reno, CUBIC, BBR, and SaTCP. Fairness, RTT, retransmission, throughput percentiles, bitrate, and rebuffering are evaluated.
Results and evidence conditions
Average throughput improves 9.4–38.2% over BBR across tested paths. 10th-percentile throughput improves up to 127.8%. The paper reports 24.7% lower retransmission ratio, 10.8% higher video bitrate, and 33.5% shorter rebuffering.
Operating assumptions and evidence scope
The 15-second timing describes measured Starlink access behavior. Other constellations and orbital cluster ISLs require timing calibration. Sender-visible traces identify interruption effects. Spacecraft reassociation attribution benefits from operator telemetry.
Original Figure 11 · The state-machine comparison shows SatPipe adding Queue Maintenance to BBR. Interruption timing triggers sender restraint and RTT probing to restore accurate pacing after service resumes.Paper source · Open the full-resolution figure
Secure Task Offloading and Resource Allocation Design for Multi-Layer Non-Terrestrial Networks
Main conferenceD · Orbital compute mesh
INFOCOM · 2026 · Alejandro Flores; Isabella W. G. da Silva; Vu Nguyen Ha; Konstantinos Ntontin; Hien Quoc Ngo; Michail Matthaiou; Symeon Chatzinotas
Built for
Remote IoT tasks reach satellite MEC through UAV relays and a HAPS coordinator that authenticates requests.
Problem formulation
Malicious offload requests consume limited orbital compute. Cryptographic authentication overhead competes with stringent task deadlines.
Algorithm and system design
Secret-key signal tags support physical-layer authentication at HAPS. Admitted tasks enter joint satellite selection and compute-share optimization solved through alternating offload and resource-allocation subproblems.
Mathematical and graph model
Gaussian detection statistics determine false-alarm and detection probabilities. A min-max normalized-delay mixed-integer formulation relaxes selection into penalized linear programs and solves convex CPU allocations by block coordinate descent.
Evaluation methodology
Numerical experiments use 50 legitimate and 25 malicious devices across 10×10 km², 25 UAVs, and 3 visible LEO servers with 10 Gcycles/s each. Tasks contain 10 Kb and 200 cycles/bit. IoT access uses 200 kHz at 2.1 GHz, HAPS–LEO uses 100 MHz at 28 GHz.
Baselines
BP-PK bilinear pairing, ID-BC blockchain, and MSR-BC blockchain use authentication computation times from cited prior work.
Results and evidence conditions
Figure 2 shows earlier deadline feasibility than the compared cryptographic schemes. Figure 3 reports legitimate admission above 95% with 25 UAVs under stringent false-alarm constraints and malicious admission around 1% at a 0.05 false-alarm target.
Operating assumptions and evidence scope
The evaluation studies numerical channel, authentication, and compute-allocation models for small remote tasks. Coherent reception, channel knowledge, and solver placement form explicit assumptions. Orbital AI collectives require workload-scale and transport validation.
Original Figure 1 · The four-layer path carries IoT requests through UAV relays and a HAPS authentication coordinator to three LEO compute servers. The studied traffic consists of small remote offloading tasks.Paper source · Open the full-resolution figure
Direct orbital-AI proposals
Towards a future space-based, highly scalable AI infrastructure system design
PreprintB · Tight AI formation
arXiv · 2025 · Blaise Agüera y Arcas; Travis Beals; Maria Biggs; Jessica V. Bloom; Thomas Fischbacher; Konstantin Gromov; Urs Köster; Rishiraj Pravahan; James Manyika
Built for
A tight formation of TPU-carrying satellites in a sun-synchronous orbit, working as one machine-learning cluster.
Problem formulation
Commercial optical inter-satellite links deliver 1 to 100 Gbps. The fabric this design wants runs near 10 Tbps in aggregate.
Algorithm and system design
Short optical hops combine wavelength multiplexing with spatial multiplexing. A free-fall formation keeps the same neighbours close together. Radiation-tested Trillium TPUs supply the compute.
Mathematical and graph model
Gaussian beam link budgets, Hill-Clohessy-Wiltshire orbital dynamics with a J2 correction, proton radiation tests, and launch-price learning curves.
Evaluation methodology
An 81-satellite formation at 650 kilometres within a 1 kilometre radius, a short-path optical bench, and 67 MeV proton irradiation of the TPU and its host components.
Baselines
Published Starlink and Mynaric optical specifications, photon-per-bit modulation bounds, and terrestrial references for the cost of launched power.
Results and evidence conditions
The optical bench reaches 800 Gbps in one direction and 1.6 Tbps both ways. A 24-channel design at 400G per channel gives an estimate of 9.6 Tbps.
Operating assumptions and evidence scope
The 10 Tbps fabric is a design estimate. TPU count per satellite, production radiator dimensions, trained cluster performance and a fielded multi-satellite fabric remain open parameters.
Original Figure 1 · Suncatcher plots bandwidth against range for a 5 W, 10 cm telescope optical link. Modulation, DWDM and spatial multiplexing assumptions underpin the modeled rates. The measured bench result is 800 Gbps in one direction.Paper source · Open the full-resolution figure
SpaceMoE: Realizing Distributed Mixture-of-Experts Inference over Space Networks
PreprintD · Orbital compute mesh
arXiv · 2026 · Zhanwei Wang; Huiling Yang; Min Sheng; Khaled B. Letaief; Kaibin Huang
Built for
A polar constellation generating tokens from a mixture-of-experts model, with small computers aboard each satellite.
Problem formulation
Which expert a token needs varies, and the satellites carrying those experts keep moving, so the latency from gateway to expert depends on both at once.
Algorithm and system design
Layers map onto ring-aligned orbit segments. Central gateways handle entry, and expert placement follows activation probability, so the experts chosen most often sit where the expected path is short.
Mathematical and graph model
Temporal graphs, Dijkstra routes, Bernoulli link feasibility, sampling proportional to probability, a bottleneck approximation and ordering theorems for placement.
Evaluation methodology
A 1,056-satellite constellation of 33 planes by 32 satellites at 550 kilometres and 87 degrees, with 200 snapshots, 0.95 link survival and inter-satellite links at 100 Gbps or more. Activation traces come from LLaMA-MoE-3.5B across eight reasoning datasets, and the modeled onboard throughput is 7.28 GFLOPS.
Baselines
Random placement, random intra-segment placement, and random intra-segment placement with central gateways.
Results and evidence conditions
Generation runs at 1.02 to 1.07 seconds per token, against 3.34 to 3.37 for the strongest random baseline and 5.28 to 5.30 for random placement.
Operating assumptions and evidence scope
The experiment evaluates sampled topology snapshots under a latency model dominated by propagation. Packet queues, loading experts on demand, arrival-rate service objectives and compact formations each call for separate experiments.
Original Figure 3 · SpaceMoE gateways retain attention, gating and KV state while remote satellites execute experts. The design couples expert activation frequency to route latency within the paper’s CPU-based constellation model.Paper source · Open the full-resolution figure
Communication-Efficient Collaborative LLM Inference over LEO Satellite Networks
A satellite chain jointly processes remote-sensing images with partitioned vision transformers.
Problem formulation
Limited onboard memory and activation traffic constrain model splitting and end-to-end delivery delay.
Algorithm and system design
Model splitting and compute–communication overlap combine with learned Gumbel-mask sparsification, quantization and entropy coding.
Mathematical and graph model
A mixed-integer nonlinear delay minimization is represented as a DAG search. An outer A* layer assignment uses inner compression optimization and a maximum-stage pipeline term.
Evaluation methodology
Hardware profiling uses four Jetson AGX Orin devices and an RTX 4070 Ti server. Simulation uses a 12-satellite orbit with a five-node compute setup, 0.5 Gbps ISLs, ViT-B/L/H/G, EuroSAT and RESISC45.
Baselines
Ground-only, single-satellite, uniform splitting, compute-proportional heuristic splitting and Top-k compression.
Results and evidence conditions
The abstract reports up to 42% delay reduction and approximately 71% communication reduction. Accuracy tables use 80% sparsity and 8-bit quantization. 194 of 200 split configurations stay within one percentage point of baseline, with six configurations losing 1.0–1.5 points.
Operating assumptions and evidence scope
The measured workload is image classification. Autoregressive decode latency, KV migration, transport competition and orbital topology changes require additional validation.
Original Figure 1 · The original pipeline distributes transformer blocks across satellites and a ground endpoint. The measured application is remote-sensing image classification with ViT, making activation size and classification accuracy its direct evidence.Paper source · Open the full-resolution figure
The Cost and Network Limits of Space-Based AI Compute
PreprintD/B/T · Feasibility comparison
arXiv · 2026 · Kees van Berkel
Built for
A comparison between a terrestrial facility of 8,000 racks and an orbital fabric of 8,000 satellites at matched power, both training a model with a trillion parameters.
Problem formulation
A sparse torus has narrow cuts. Gradient synchronization has to cross those cuts, so accelerator compute can sit idle behind them.
Algorithm and system design
An analytical comparison joins network bisection bandwidth to the bisection intensity of the workload through a roofline model.
Mathematical and graph model
Cut capacity, arithmetic intensity, compute rooflines, and estimates of collective latency and bandwidth.
Evaluation methodology
A one-gigawatt design point evaluated as a Clos network, a two-dimensional torus and a three-dimensional torus, with orbital links at 100 Gbps and a sensitivity case at 10 Tbps.
Baselines
A terrestrial Clos with 800 Gbps links at two-to-one oversubscription, against orbital torus configurations.
Results and evidence conditions
Bisection bandwidth reaches 28,800 TB/s for the Clos network, 2.25 TB/s for the orbital two-dimensional torus and 10 TB/s for the three-dimensional torus at 100 Gbps per link.
Operating assumptions and evidence scope
The model assumes one global data-parallel traffic mapping and theoretical torus links. Actual cut traffic, feasible wrap-around optical links, terminal count, alternative topologies and measured training steps all decide how far it transfers.
Original Figure 8 · The roofline compares terrestrial Clos and orbital torus cut bandwidth under the paper’s 8000-node assumptions. Link-rate sensitivity is visible in the dotted curves. An implemented collective supplies its own cross-cut byte demand.Paper source · Open the full-resolution figure
Enabling Space Datacenter Connectivity via Satellite Constellations
Starlink G7 median inter-shell link duration stays below ten minutes. More than 90% of OneWeb links persist beyond twenty minutes. G2 provides the strongest path stability in the tested geometry.
Operating assumptions and evidence scope
All Walker nodes are relay-capable, yielding a connectivity upper bound. Ground-station competition, offered traffic, packet queues and LLM service metrics require an emulator extension.
Original Figure 3 · The source illustrates compute clusters connected through gateways along an orbital track. Its evaluated 81-node SSO gateway shell and Walker relay constellations describe global access, while compact intra-cluster communication has its own graph.Paper source · Open the full-resolution figure
Dark Clouds Rising in Low-Earth Orbit: On Environmental Limits to Massive Orbital AI
Co-located workshopB/D · Physical feasibility
LEO-NET workshop · 2026 · Robin Ohs; Gregory F. Stock; Andreas Schmidt; Juan A. Fraire; Jörg Ott; Holger Hermanns
Built for
A one-H100 orbital compute node couples electrical power, radiator mass, solar area and mission lifetime.
Problem formulation
Lifecycle analysis must account for power infrastructure, waste-heat rejection and payload redundancy.
Algorithm and system design
ESpaS-ODC adds ISS-calibrated radiator sizing, solar degradation, eclipse margins and shared-infrastructure cold spares.
Mathematical and graph model
A component mass/carbon ledger uses eclipse geometry, linear thermal scaling and carbon amortization over GPU service hours.
Evaluation methodology
A 510 km analytical reference node uses a 700 W H100 plus 300 W peripherals, ideal high-beta sunlight, mission durations 1–9years and redundancy 1–5.
Baselines
Global-average terrestrial DC and Finland-grid green DC. Starship and Falcon9 launch assumptions.
Results and evidence conditions
The reported reference case has 44.3 kg modeled component mass, including 30.5 kg radiator (68.8%). One full cold spare increases 3-year carbon per GPU hour by 40% under Starship and 34% under Falcon9.
Operating assumptions and evidence scope
The component ledger covers an ideal 100% duty cycle and a50W transceiver placeholder. Bus, harness, shielding and thermal transport require additional mass accounting. Reliability benefits require measured failure rates.
Original Figure 1 · The heatmap reports carbon per modeled GPU service hour across mission duration, redundancy and launch assumptions. Useful completed service hours, component mass coverage and capacity-aware network power govern interpretation.Paper source · Open the full-resolution figure
OrbitalBrain: A Distributed Framework for Training ML Models in Space
NINeS · 2026 · Om Chabra; Chenning Li; Kevin Hsieh; Santiago Segarra; Behnaz Arzani; Peder Olsen; Ranveer Chandra
Built for
Earth-observation satellites that train an image model as they fly, share weights with each other, and send updates down to a global model on the ground.
Problem formulation
Downlink, energy and storage are all tight. Labels differ sharply from one region to the next, and a local model drifts out of date between contacts, which together slow convergence.
Algorithm and system design
A planner in the cloud profiles loss, staleness, predicted compute and label distribution. From that it chooses between computing locally, averaging models along a shortest-path tree rooted at the best-connected satellite, and shipping raw imagery ranked by usefulness. Ground contacts deliver the schedule and collect the updates.
Mathematical and graph model
A binary resource allocation that maximizes accuracy gain under window, energy and storage limits, with a greedy planner that ranks by loss and staleness, a decaying aggregation threshold, and label divergence measured by Jensen and Shannon.
Equation (1) is the performance profiler’s local-compute utility. n_comp_s predicts the number of samples processed in the upcoming scheduling window. Η_s counts windows since the satellite’s latest model aggregation. D_s is the previous window’s training sample set. Loss(d) is the dimensionless local training loss. The decay exponent a is positive, with a=1 in the reported experiments. The score scales expected work by a square-root loss/staleness factor, so it is a heuristic utility with sample-scaled square-root-loss units. It ranks prospective computation in the framework’s compute/aggregation/data-transfer choices. Training convergence is measured by the experiment. The utility is the source’s operational proxy. Appendix A separately states the general allocation problem and physical constraints in Equations (6)–(9).
§3.1, Equation (1), performance profiler, PDF p9. Appendix A Equations (6)–(9) give the broader formulation.
CosmicBeats orbital traces drive a FLUTE and OpenMPI simulation over 207 Planet and 117 Spire satellites, twelve ground stations, twenty-four hours, five-minute decision windows, inter-satellite links capped at 100 Mbps and 360 GB of storage. The models adapt the final five layers of DenseNet-161 on fMoW and ResNet-50 on So2Sat, with a Jetson Orin Nano as the compute model.
Baselines
Centralized training through a bent pipe, synchronous and asynchronous federated learning, FedBuff and FedSpace, plus ablations that remove aggregation or raw-data transfer. Ideal references assume balanced labels and unrestricted ground connectivity.
Results and evidence conditions
Each baseline's own twenty-four-hour final accuracy arrives 1.52 to 12.42 times sooner. On fMoW the accuracy reads 52.8 and 59.2 percent against 47.3 and 50.2 for the bent pipe, and on So2Sat 47.9 and 47.1 against 46.0 and 43.0.
Operating assumptions and evidence scope
The evidence covers trace-driven adaptation of vision models on a five-minute decision cycle. Orbital forecasts are taken as accurate and compression is modeled at zero energy. Training-step GPU calibration, packet queues, optical pointing, radiator budgets and repeated language-model collectives each call for their own validation.
Multi-node GPU clusters run topology- and message-size-specific AllGather, AllToAll and AllReduce for distributed model training.
Problem formulation
Heterogeneous NVLink, PCIe and InfiniBand paths, shared-link contention and chunk dependencies create a large routing-and-scheduling search space for collective algorithms.
Algorithm and system design
Designer communication sketches constrain logical topology, switch-hyperedge connection policies, algorithm symmetry and input size. TACCL profiles α–β link costs, solves relaxed-routing MILP, greedily orders chunks, then solves contiguity/exact-scheduling MILP and executes generated TACCL-EF in an NCCL-compatible GPU interpreter.
Mathematical and graph model
Continuous-time MILP with binary chunk-send/link-use variables and real-valued arrival/send times. Collective pre/postconditions and data dependencies. Α+βs transmission cost. Relaxed capacity lower bounds followed by heuristic ordering and capacity-valid scheduling. AllGather permits chunk replication.
Appendix B.1 Equations (1), (2), (4), (5) and (6) define a routing-stage makespan objective with availability, causality and aggregate link-time bounds. c is a data chunk. U,v,r are GPU ranks. Post is the collective postcondition. Y_cuv indicates whether the chunk uses a link. start, send, lat and T use consistent time units. lat=α+β is the source’s single-chunk transfer cost for the profiled link. The equality connects a used transfer to chunk arrival. The lower bound sums transfer costs on each link. This routing stage relaxes detailed overlap/order bandwidth constraints, yielding paths and lower-bound timing. TACCL’s later ordering and exact scheduling stage enforces the concrete schedule. The displayed subset preserves that stage boundary.
Appendix B.1, Equations (1), (2), (4), (5), (6), proceedings p610. Y is a shortened alias for is_sent and T for time.
Actual NVIDIA V100 hardware: two DGX-2 nodes or up to four Azure NDv2 nodes in the main 32-GPU evaluation. Standalone collective bandwidth sweeps, sketch/runtime ablations and PyTorch training of Transformer-XL, BERT and an internal MoE workload. Table 2 measures synthesis time. Larger synthesis-only tests reach 80 and 128 GPUs.
Baselines
NCCL v2.8.4-1 on identical hardware. Ablations vary logical inter-node connectivity, chunk size/partitioning, switch-hyperedge policy and runtime instances. SCCL, Blink and Plink provide related-synthesis context.
Results and evidence conditions
The 6.7× headline is standalone AllGather on two DGX-2 nodes at small message sizes. Across evaluated batch sizes, Transformer-XL training gains are 11%–1.94× on two NDv2 nodes and 2%–1.44× on four. BERT gains are 12%–2.36× and 7%–1.74×. Internal MoE throughput rises 17%. DGX-2 AllReduce at ≥512 MB is up to 9% slower than NCCL.
Operating assumptions and evidence scope
Evaluation uses fixed profiled terrestrial topologies and designer-restricted sketches. A 30-minute contiguity timeout occurs in one AllToAll case. 128-GPU synthesis takes about 11 hours. Orbital transfer needs time-indexed capacity, link acquisition, faults and transition costs, plus an executable collective dependency model.
Original Figure 1 · TACCL takes a communication sketch, measured topology and collective semantics through relaxed routing, heuristic ordering and exact scheduling, then lowers the schedule into a GPU runtime. The figure illustrates a concrete collective-aware synthesis baseline for transfer studies.Paper source · Open the full-resolution figure
TopoOpt: Co-optimizing Network Topology and Parallelization Strategy for Distributed Training Jobs
Terrestrial DNN training jobs receive dedicated direct-connect optical network partitions co-designed with model parallelization and collective routing.
Problem formulation
A traffic-independent fabric spends bandwidth and hardware on connectivity that mismatches a training job’s AllReduce and model-parallel dependencies.
Algorithm and system design
Offline alternating optimization couples FlexFlow MCMC parallelization search with TopologyFinder. Degree is split between AllReduce and model-parallel subgraphs. Coprime TotientPerms rings carry collectives, repeated Blossom matching favors heavy model-parallel edges, and host NIC forwarding supplies multi-hop RoCEv2. Modified NCCL load-balances ring permutations.
Mathematical and graph model
A DNN task graph drives degree-constrained topology and routing search. TotientPerms uses gcd(p,n)=1. Geometric permutation selection targets a small diameter. CoinChangeMod routes the ring-derived graph and k-shortest paths route model-parallel traffic. MCMC is a sampling search method. Simulator and forwarding bandwidth-tax models estimate iteration time.
Algorithm 1 lines 2–3 distributes server degree d between the AllReduce sub-topology and model-parallel (MP) sub-topology using an upward-rounded transfer-volume fraction, reserving at least one AllReduce degree. T_A and T_MP use the same volume units, so the ratio is dimensionless and d_A/d_MP are integer port counts. The construction assumes positive total traffic and d≥1. The MP branch uses successive maximum-weight matchings. Line 17 halves a selected edge’s demand weight to create diminishing returns and diversify subsequent matchings. This is the paper’s topology heuristic inside an alternating topology/parallelization search. Link degree and transfer-weight updates are operational controls. End-to-end iteration time evaluates the resulting joint choice.
§4.2, Algorithm 1 lines 2–3 and 13–17, proceedings p744. Algorithmic pseudocode supplies the degree-allocation identity.
FlexNet searches strategies. Htsim-based FlexNetPacket evaluates packet behavior. Simulations include 128-server dedicated and 432-server shared clusters, four A100s per simulated server, degree 4/8, and six DNNs. The prototype uses 12 one-A100 servers, a Telescent patch panel, RoCEv2/PFC, and degree 4×25Gbps interfaces per server, totaling 100Gbps.
Baselines
Simulation compares similar-cost Fat-tree, 2:1 oversubscribed Fat-tree, Ideal Switch, OCS-reconfig, equal-degree/bandwidth SiP-ML, and Expander. Prototype compares Switch100Gbps and Switch25Gbps. OCS-reconfig assumes 10ms setup and 50ms demand refresh. Sensitivity sweeps 1µs–10ms.
Results and evidence conditions
The simulation headline is up to 3.4× shorter training iteration time versus similar-cost Fat-tree. Prototype throughput tracks Switch100Gbps across tested models. VGG reaches 90% target accuracy 2× faster than Switch25Gbps. A large simulated all-to-all stress case makes TopoOpt1.1× slower than Fat-tree, identifying forwarding-cost sensitivity.
Operating assumptions and evidence scope
Main TopoOpt configures a topology before a job and retains it during training, with reconfiguration for permanent failures. Terrestrial arbitrary optical connectivity and passive-switch costs define its scope. Orbital transfer requires physical candidate edges, pointing/range constraints, setup outage, terminal degree/power, and forecast error. Cost-equivalent comparisons and equal-capacity comparisons answer separate questions.
Original Figure 5 · TopoOpt’s terrestrial interconnect exposes d optical interfaces per server to optical switching planes. A job receives a selected direct-connect graph. Host forwarding carries traffic across multiple edges. Orbital adaptation constrains the graph to feasible optical contacts and charges setup and power budgets.Paper source · Open the full-resolution figure
Rethinking Machine Learning Collective Communication as a Multi-Commodity Flow Problem
Main conferenceT · Terrestrial reference
SIGCOMM · 2024 · Xuting Liu, Behnaz Arzani, Siva Kesava Reddy Kakarla, Liangyu Zhao, Vincent Liu, Miguel Castro, Srikanth Kandula, Luke Marshall
Built for
Centrally managed GPU training clusters synthesize collective schedules for a known topology and finite communication demand.
Problem formulation
Joint routing and scheduling must preserve chunk identity, replication, propagation delay, store-and-forward, and per-link capacity while delivering every requested chunk quickly.
Algorithm and system design
Discrete epochs track each source chunk in buffers and transmissions. AllGather uses MILP. AllToAll uses a continuous LP because its demand admits a flow interpretation. An A* inspired sequence of bounded-horizon optimizations carries buffer and in-flight state across rounds. Reverse DFS prunes surplus transmissions. MSCCL executes exported schedules.
Mathematical and graph model
The α–β graph model has binary chunk-presence variables, delayed causality, multicast-style copy inequalities, destination satisfaction, and capacity bounds. The weighted receipt objective rewards earlier delivery. §5 already permits a capacity matrix per epoch and aggregation of multi-tenant demands.
F is a chunk transmission indicator. T is link capacity in chunks/s. Τ is epoch duration. R records received demand. Binary identities preserve replicated chunk provenance.
§3.1, PDF pp5–6: Capacity constraints and The objective; source equations appear as named displays
Evaluation methodology
Most results compute completion from synthesized schedules and profiled link parameters on DGX1, DGX2, NDv2 and two proprietary topologies. Real execution uses two AMD chassis with 32 GPUs. Gurobi 9.5.2 runs on an 80-core/160-thread Xeon Platinum 8380 VM with 512 GB RAM. Comparisons harmonize TACCL switch transit cost.
Baselines
TACCL, MSCCL/SCCL synthesis, and RCCL on the AMD testbed. Ablations cover copies, epoch granularity, buffers, optimal/30%-gap early-stop MILP, and A* horizons. TACCL routing and scheduling each receive 2 or 4 hours according to topology scale.
Results and evidence conditions
The abstract reports AMD algorithm bandwidth up to 2.14× TACCL and 3.18× RCCL. §6.2 places AllGather near 3× RCCL at 1 MB and 1.5–2× for larger transfers. Table 4 reports 256-GPU AllToAll synthesis in 1500 s with 4× coarser epochs, and 256-GPU A* AllGather in 2.8 h with 2× epochs.
Operating assumptions and evidence scope
Performance depends on supplied α/β, epoch and chunk size. AllGather early-stop and A* have heuristic quality tradeoffs. Large models can require roughly 350 GB memory. The paper evaluates AllGather and AllToAll, while its AllReduce construction combines component collectives and leaves reduction compute cost for further modeling.
Original Figure 2 · Figure 2 explains the three modeling requirements: chunk copies, timing with queueing, and store-and-forward.Paper source · Open the full-resolution figure
MCCS: A Service-based Approach to Collective Communication for Multi-Tenant Cloud
Cloud providers manage collectives across tenant GPU jobs while preserving an application-facing NCCL-like interface.
Problem formulation
Tenant-local collective choices can collide on shared physical paths. Runtime strategy changes require common operation boundaries and correct GPU memory/stream ordering across processes.
Algorithm and system design
A shim forwards allocations and collective requests to per-host services through shared-memory queues. CUDA IPC handles share GPU buffers/events. Proxy engines control communicators. Transport engines manage RDMA flows. A control-ring AllGather exchanges last-launched sequence numbers, drains through their maximum, then rebuilds connections.
Mathematical and graph model
Provider policies use greedy locality-aware rings and Hedera-style best-fit flow assignment, round-robin across jobs for fairness, reserved routes for priority, and time windows aligned to high-priority idle periods. This is a service architecture with concrete heuristics and a synchronization invariant.
q_r is rank r last-launched collective sequence number at reconfiguration. All ranks complete the same prefix before changing strategy.
§4.2, PDF pp5–6, Figure 4: sequence-number barrier design invariant; notation transcribed for this survey
Evaluation methodology
Four servers hold eight RTX 3090 GPUs and ConnectX-5 100 Gbps NICs. A self-wired SN2100 emulates two leaves/two spines at 2:1 oversubscription. NCCL-derived kernels and trace replay cover VGG-19 data parallelism and GPT-2.7B tensor parallelism. Flow simulation scales to 768 GPUs, 200 Gbps links, 50 ResNet-50 jobs, and five repetitions.
Baselines
NCCL v2.17.1. NCCL(OR) with manually optimal rings. MCCS(-FA)/(-FFA) flow-assignment ablations. ECMP, FFA, PFA and PFA+TS for trace replay. Random rings, optimal rings and optimal rings+FFA for simulation.
Results and evidence conditions
For 8–512 MB collectives, average algorithm bandwidth speedup is 1.6× on four GPUs and 2.4× on eight GPUs versus NCCL. Trace replay prioritizes VGG by 34% versus ECMP. Simulation reports 3.27×/3.43× average AllReduce speedup for random/compact placement. Small 512 KB AllGather incurs 63% lower bandwidth than NCCL(OR) on four GPUs, from 50–80 μs service latency.
Operating assumptions and evidence scope
Prototype kernels cover ring AllReduce/AllGather. The hardware experiment uses eight consumer GPUs. Training results replay profiled traces, and large-scale results use per-flow-fairness simulation. Reconfiguration closes and creates connections, while monitoring and provider policy remain external inputs.
Original Figure 1 · Figure 1 shows the shift from tenant-owned libraries to a provider-owned collective service and the resulting control points.Paper source · Open the full-resolution figure
Crux: GPU-Efficient Communication Scheduling for Deep Learning Training
Multi-job training clusters share inter-host paths and PCIe resources. The operator targets aggregate useful GPU computation.
Problem formulation
Inter-job communication contention stalls GPUs. Aggregate utilization depends on which computation a unit of communication unlocks, iteration periodicity, computation overlap and the small number of physical priority levels.
Algorithm and system design
Profile GPU intensity, select least-congested paths in descending intensity order, correct priorities for iteration and overlap effects, and compress priorities through a weighted DAG K-cut dynamic program. A daemon probes paths/profiles jobs. The transport layer steers RoCEv2 by UDP source ports and sets priorities, with PCIe semaphores for intra-host contention.
Mathematical and graph model
A weighted multi-commodity-flow-derived objective maximizes useful computation. For a single fixed-capacity bottleneck, intensity equals per-iteration FLOPs divided by bottleneck communication time. The long-horizon theorem relates total computation to the integral of scheduled intensity. Priority compression minimizes weighted utilization loss under K hardware queues.
W is per-iteration computation. M is per-link traffic. B is link bandwidth. K corrects intensity for iteration and overlap effects.
§3.2 Equation (2), PDF p4; §4.2 Equation (3), PDF p6
Evaluation methodology
A 96-A100 testbed uses 12 hosts and a two-layer Clos. Real ResNet/BERT/GPT training explores network and PCIe contention. An α–β simulator replays two weeks of 2000+ GPU production traces on two-layer Clos and double-sided topologies with eight priority levels. Individual compute durations come from actual GPUs.
Baselines
Real training compares default communication and each job running alone. Trace simulations compare Sincronia, TACCL* and CASSINI. TACCL* is an author-implemented inter-job adaptation selecting least-congested links and prioritizing longer paths. Microbenchmarks also include Varys and optimum components, with Crux-PA, Crux-PS-PA and full Crux ablations.
Results and evidence conditions
Hardware experiments report utilization improvements of 8.3–14.8% across scenarios. Prioritized BERT JCT decreases by up to 33% while ResNet JCT can increase 1–3%. Simulation reports +13–23% on Clos and reported +4–7% on double-sided topology. Figure 23 shows Clos utilization 0.39/0.49/0.48 for Sincronia/TACCL*/CASSINI and 0.62 for full Crux.
Operating assumptions and evidence scope
The single-bottleneck theorem assumes constant capacity. Network-wide scheduling uses practical heuristics. Prioritization exchanges aggregate efficiency for some jobs’ slower completion. Profiling/rescheduling can take up to a minute per arrival/completion. Correction factors depend on the selected reference job.
Exact step-based MILPs couple routes, chunk timing and bandwidth, making synthesis expensive. A scalable optimizer needs precise replication/resource accounting and an explicit realization of continuous flows into executable chunks.
Algorithm and system design
Represent each origin–destination pair as a commodity, with usage variables accounting for shared copies. Decouple spatial routing from temporal scheduling through average lifetime capacity. LP solutions gain feasibility cuts via selective vertex duplication. Mirrored Dantzig–Wolfe exploits full-input symmetry. Tree decomposition plus weighted fair queueing emits uniform chunks.
Mathematical and graph model
Primary objective is collective makespan, with secondary weighted transmitted volume. LP(9) constrains lifetime usage. Theorem 2 relates it to the step LP within arbitrary ε. Ideal topologies satisfy the additional algorithm-feasibility conditions. Other graphs are strengthened iteratively. Uniform finite-size chunk realization has a quantified makespan inflation bound.
R is target collective makespan. B(L) is an aggregate resource bandwidth bound. W tracks actual transmitted usage shared by replicated origin data. F denotes pairwise commodity flow.
§3 Equation (4), PDF p4; §4.1 Equation (8), PDF p5; Theorem 2
Evaluation methodology
Simulation models A100 eight-GPU hosts and DOE four-GPU hosts with rail-based interconnects, AllGather/AllToAll, and 64-GPU concurrent collectives. Synthesis runs on 32-core Xeon Gold 6234 with 314 GB RAM. Every competitor uses its largest chunk count completing within three hours.
Baselines
TE-CCL, SyCCL and TACCL public implementations. TACCL AllToAll is excluded following implementation issues, and SyCCL single-host runs encounter supported-topology limits. Multiple-collective ablations compare separately sequential (Obvious), individually synthesized/concurrently scaled (Overlaid), and joint (All-in-one), each using OptCCL.
Results and evidence conditions
AllGather algorithm bandwidth is 1–5× TE-CCL, 1–1.6× SyCCL and 1.2–18× TACCL. Large-topology synthesis is 3–32× faster than SyCCL and 5–60× than TACCL. AllToAll gains are 1–1.3× with 2–500× lower synthesis time. Table 2 makespans relative to joint optimization are 6.25/1/1 with NVLink and 4.87/1.31/1 across Obvious/Overlaid/All-in-one. Finite chunks finish within 1% of routing optimum in evaluated cases.
Operating assumptions and evidence scope
Evidence consists of simulated schedule quality and measured synthesis runtime. Proofs and evaluation emphasize large, bandwidth-dominant messages on a given topology. Propagation-dominant small messages, application integration, real GPU measurements, and weighted flow-time objectives are further directions stated in §9.
Trivance: Latency-Optimal AllReduce by Shortcutting Multiport Networks
Main conferenceT · Terrestrial reference
SIGCOMM · 2026 · Anton Juerss, Vamsi Addanki, Stefan Schmid
Built for
AllReduce on bidirectional rings and regular multidimensional direct-connect tori, including TPU-like topology families.
Problem formulation
Collective startup steps, routed distance and link congestion interact: using both ports can reduce the step count while full vectors increase transmitted bytes.
Algorithm and system design
Each rank communicates simultaneously with peers at ±3^k distance and jointly reduces two incoming messages. A latency variant forwards full vectors in one phase. A bandwidth variant runs ReduceScatter then reverse AllGather with shrinking/growing blocks. Generalization handles arbitrary sizes and parallel dimensions.
Mathematical and graph model
A congestion-aware Hockney cost sums startup steps and per-step bytes times congestion. For powers of three, latency mode uses log3 n steps and m log3 n bytes per port. Bandwidth mode uses 2 log3 n steps and total 2m(1−1/n) bytes per node. Bounds apply to multiport regular graphs under deterministic shortest paths.
α is startup cost. Β is inverse link bandwidth. M_k is per-step message size. C_k is shared-link congestion. R is rank and n is ring size.
§2.1 PDF p3, congestion-aware cost display; §4.1 PDF p6, peer-distance display
Evaluation methodology
Packet-level SST simulations vary rings, square/rectangular 2D tori and 3D tori. Message sizes range 32 B–128 MiB. Default links are 800 Gbps with 100 ns latency, 100 ns per-hop processing, 8192 B packets and 1.5 μs startup per step. Appendices vary bandwidth up to 3.2 Tbps, latency and packet size.
Baselines
Bucket, Recursive Doubling, Swing and Bruck with latency/bandwidth variants. Bruck gains shortest-path routing, joint reduction and reordered AllGather. Recursive Doubling exploits all 2D ports. Power-of-three comparisons use Bucket/Swing/Bruck.
Results and evidence conditions
Trivance improves latency-bound completion by 5–30%. The advantage extends through 512 KiB in rings, 8 MiB in multidimensional tori, and 32 MiB in high-bandwidth examples. Some 3D cases improve up to 20% through 128 MiB. §6.2 identifies crossover to Swing around 8 MiB in rectangular tori.
Operating assumptions and evidence scope
The study measures simulated collective completion on stable regular topologies. Arithmetic reduction, host/GPU execution and end-to-end training require hardware validation. The two variants explicitly trade startup latency against byte volume. Size departures from powers of three increase routing/data overhead.
Original Figure 1 · Figure 1 contrasts Recursive Doubling, Bruck and Trivance communication distance and congestion over steps.Paper source · Open the full-resolution figure
Time-division TCP for Reconfigurable Data Center Networks
Main conferenceT · Terrestrial reference
SIGCOMM · 2022 · Shawn Shuoshuo Chen, Weiyang Wang, Christopher Canel, Srinivasan Seshan, Alex C. Snoeren, Peter Steenkiste
Built for
Long-lived TCP flows traverse recurrent electrical/optical time-division paths with sharply different bandwidth and RTT.
Problem formulation
One congestion state mixes measurements across path regimes, while independent sequence spaces create receive-window stalls. Transitions also mix data and ACK paths and induce reordering.
Algorithm and system design
Maintain per-TDN congestion/RTT/in-flight state and a connection-wide sequence space. ToRs announce path changes by ICMP. Tagged data/ACK state assigns acknowledgments to the correct TDN. Transition-aware recovery separates reordering and loss. Mixed-path RTT samples are filtered. Implemented in Linux 5.8.
Mathematical and graph model
A piecewise transport model has one active TDN at each instant and reusable per-path CUBIC states. Correct accounting uses current-TDN, all-TDN, any-TDN or packet-specific states for each TCP operation. Retransmission can use whichever path becomes available.
S is congestion state. I identifies the data path and j the ACK path. Matching-path samples update their own TDN estimates.
§3.1–3.4 PDF pp4–6; §4.4 PDF p8: per-TDN state invariant and mixed-path RTT identity
Evaluation methodology
Real kernel endpoints run 16 containers on each of two servers. A third server runs Click/DPDK Etalon. The emulated EPS/OCS paths are 10/100 Gbps with 100/40 μs RTT, 180 μs days and 20 μs reconfiguration. Physical ConnectX-3 40 Gbps hardware uses 20× time dilation. 16 synchronized flows run 40 s, primarily at a 6:1 EPS:OCS schedule ratio.
Baselines
CUBIC, DCTCP, MPTCP with two subflows, reTCP and reTCP with dynamic VOQ resizing. Analytical ideal-throughput and packet-only reference curves. Ablations vary latency/bandwidth and notification optimizations.
Results and evidence conditions
The representative hybrid setting improves long-flow throughput 24% over CUBIC/DCTCP and 41% over MPTCP, with the lowest VOQ occupancy among compared transports. Notification optimizations contribute 12.7% throughput. At the 90th percentile of transition retransmissions, TDTCP retransmits 7 packets versus CUBIC 15.
Operating assumptions and evidence scope
Evaluation centers on long flows and two recurring path regimes, with network emulation and dilated timing. Endpoints require prompt TDN announcements and relatively stable conditions within a TDN. Larger regime sets, extreme availability ratios and short-RPC completion are additional evaluation scopes.
SIGCOMM · 2024 · William M. Mellette, Alex Forencich, Rukshani Athapathu, Alex C. Snoeren, George Papen, George Porter
Built for
An actual optically switched rack implements periodic connectivity and multi-hop Opera forwarding through commodity Linux endpoints.
Problem formulation
Fast optical topology changes require link reacquisition, accurate time synchronization, topology-aware NIC routing and masking of manufacturing-related signal dropouts across a full end-to-end stack.
Algorithm and system design
A passive rotating diffractive disk cycles restricted matchings. A 128-port switch partitions into four staggered 32-port sub-rotors. FPGA Corundum NICs use PTP to align queues, routing and guard masks to the rotor. Defect windows are profiled and transmission pauses before the MAC.
Mathematical and graph model
Periodic matchings form Opera expander topologies, with precomputed shortest viable routes and port removal ahead of reconfiguration to drain in-flight traffic. RotorNet bulk store-and-forward and Opera cut-through forwarding provide distinct architectural modes. This deployment focuses on cut-through/direct forwarding and measured link behavior.
p is an optical port. Active matching determines its peer. Guard masks remove switch and defect intervals. Routes reserve enough time to finish before circuit change.
§3.2–3.4 PDF p4; §4.5 PDF p8: timing/guard-mask design invariant, notation transcribed for this survey
Evaluation methodology
A manufactured 3U 128-port switch with 7 μs reconfiguration and 100% port yield connects 16 cluster servers plus one control server. Each cluster server uses eight 10 Gbps optical links and an FPGA NIC. End-to-end iperf3, ICMP ping, userspace UDP and all-512-path BER measurements test masking, loaded latency and synchronization.
Baselines
Masking enabled/disabled and theoretical available link rate for TCP. ConnectX-5 back-to-back and through an electrical packet switch for ICMP/UDP latency. Unloaded and interfering TCP traffic cases.
Results and evidence conditions
Masking raises a defective-slot iperf3 transfer from 0.893 to 0.995 of the available slot rate and removes its measured retransmissions. One-hop TCP reaches about 98% of ideal 2.5 Gbps, while multi-hop Opera reaches 9.3 Gbps on a 10 Gbps link. Rotor phase accuracy is ±5 μs. Loaded overlap raises approximately the last 15% of latency samples by 15 μs.
Operating assumptions and evidence scope
The prototype operates at 10 Gbps per optical lane, while its 128-port device is deployed through a 16-node partition. Large-scale load balancing, NIC external memory, RotorLB bulk forwarding and application/transport integration are continuing work. This is a terrestrial optical component validation.
Opera-like varying-expander fabrics retain multi-hop routes during microsecond optical reconfiguration and carry general datacenter traffic.
Problem formulation
Credit allocation faces multiple changing bottlenecks. Credits and data must use the same path despite reconfiguration, while credits dropped later waste earlier link opportunities. Path-length bias also affects flow fairness.
Algorithm and system design
Enforce reverse credit–data symmetry using embedded entry time slices and RTT-length slots. Congested credit queues probabilistically favor fewer remaining hops. Topology-aware rate updates and tentative credits fill spare capacity. Hop-count jitter helps short flows, and Aeolus provides fast start.
Mathematical and graph model
The design is a stateless stochastic admission heuristic with per-flow receiver feedback. Admission probability is 2^(1−h) above the congestion threshold, where h is remaining hops. Credit/data scheduling obeys contact-slot timing. Long-term fairness relies on repeated near-uniform short-path opportunities.
h is remaining hop count. Admission is probabilistic above the queue congestion threshold. The slot inequality expresses the protocol timing design requirement.
§4.2 Equation (1), PDF p6; §4.1 PDF pp5–6 credit–data path symmetry
Evaluation methodology
htsim models 108 ToRs, six 108-port OCSes and 648 hosts, 100 Gbps links, 500 ns inter-ToR propagation and 15/55 μs slices. Web-search/Hadoop/RPC workloads run at 30% host load with 35% stress. A DPDK/P4 testbed uses three Tofino2 switches, four dual-port ConnectX-6 servers, eight emulated ToRs, 40 Gbps and 100 μs slices.
Baselines
NDP, ExpressPass enhanced with Aeolus, TDTCP tuned for Opera, Bolt with TDTCP reordering handling, and a Shale-inspired HbH baseline with ideal loss recovery. A similar-cost 3:1 oversubscribed Clos runs Bolt. Full settings are in Appendix A.
Results and evidence conditions
Across stated simulations, throughput reaches up to 2× NDP and 1.5× ExpressPass. Tail FCT reductions reach 10×/15×/3.5× against ExpressPass/TDTCP/Bolt. Credit waste falls to 4.4% versus ExpressPass 14.2%. At 35% load, Opera+Flare sustains over 34% throughput and reduces long-flow FCT up to 2.48× versus Clos+Bolt. Hardware tests validate fairness/queues rather than reproducing all headline ratios.
Operating assumptions and evidence scope
The protocol assumes time-synchronized circuit schedules and sufficient path lifetime for a round trip. The small hardware graph exhibits stronger path-length/fairness imbalance than the simulated topology. Priority scheduling and background-traffic policies require additional mechanisms. LLM collective end-to-end training is a further workload scope.
Original Figure 7 · Figure 7 separates regular and tentative credit queue thresholds and the hop-dependent admission probabilities.Paper source · Open the full-resolution figure
Theseus: Runtime-Adaptive GPU Collective Communication with Hot-Swappable Schedules
Long-running GPU applications select among custom collective schedules as expert loads, NIC health and synthesis quality evolve.
Problem formulation
Runtime schedule choices need deterministic agreement across ranks, resource-efficient support for hundreds of candidates and small switching costs while preserving collective execution semantics.
Algorithm and system design
An asynchronous selection context holds endogenous/exogenous attributes, schedules and policies. Every K requests, a custom AllReduce agrees on common context elements and minimum visible versions. Each rank then deterministically selects the highest-scoring usable schedule. A four-layer resource tree and lazy delta migration reuse scratch buffers, schedule resources, buffer handles and low-level operations.
Mathematical and graph model
The agreement protocol uses set intersection and minimum-version reduction. An FSM enforces consistent downward resource-tree traversal. Policies include MoE load divergence, fail-slow health maps, improving synthesizer output and uniform-exploration bandit selection. Theseus supplies a runtime mechanism. User policies define optimization goals.
A/S are visible attribute/schedule sets. V is a version. U is the usability predicate. Common context plus deterministic tie-breaks produces consistent schedules.
§4.1 PDF p5 schedule-selection model; §5 Algorithm 1 PDF p7, lines 9–13; notation transcribed for this survey
Evaluation methodology
Four nodes contain 32 A100 SXM4 80 GB GPUs, six NVSwitches per node and four ConnectX-5 dual-100 Gbps NICs per node on two-tier Clos. CUDA 12.4, PyTorch 2.2 and Megatron-LM 0.16 run Qwen3-30B-A3B EP8/EP32 and Llama3-8B DP. HeFFTe exercises 16-GPU AllToAll. Agreement uses K=100. Communicator tests sweep 2–32 GPUs and 10–1000 schedules.
Baselines
NCCL v2.19 with its default tuner and MSCCL++ v0.8. Model experiments use Megatron-LM with NCCL, and fail-slow adaptation enabled/disabled. heFFTe compares default, waiting for final TE-CCL synthesis, and continuous adoption of intermediate schedules. Resource-tree/delta-migration ablations isolate overhead.
Results and evidence conditions
Static communicator bandwidth improves up to 1.61× NCCL. Qwen MoE AllToAll reaches 1.73× at high skewness while actual training improves about 1.07×. A fully throttled NIC yields Llama iteration time 2.03 s versus healthy 1.75 s, while the unadapted 10%-NIC case reaches 3.76 s. Delta migration averages 8±5.1 ms versus 206±107 ms normal setup. Average request TTE is 0.13 ms and over 95% are below 10 μs. Abstract maxima are 2.46× dynamic communication and 1.84× job time.
Operating assumptions and evidence scope
Control agreement assumes a connected bootstrap network, consistent request ordering, intra-node peer access and GPUDirect RDMA. Membership repair uses manual/preemptive actions. Schedule quality and stability depend on user policy. Arbitrary policies can oscillate, with hysteresis/dwell guardrails available. Rare setup and agreement requests produce longer TTE tails.
CacheGen: KV Cache Compression and Streaming for Fast Large Language Model Serving
Main conferenceT · Terrestrial reference
SIGCOMM · 2024 · Yuhan Liu; Hanchen Li; Yihua Cheng; Siddhant Ray; Yuyang Huang; Qizheng Zhang; Kuntai Du; Jiayi Yao; Shan Lu; Ganesh Ananthanarayanan; Michael Maire; Henry Hoffmann; Ari Holtzman; Junchen Jiang
Complete primary full text reviewed · Source version: Conference primary paper
Built for
Repeated long contexts are reused across terrestrial LLM serving requests through compressed KV bitstreams fetched from storage or another worker.
Problem formulation
Sending full KV tensors costs bandwidth. Sending text instead incurs prefill computation. A serving system must choose a context representation that meets TTFT and response-quality targets under changing bandwidth.
Algorithm and system design
Change-based encoding exploits adjacent-token locality. Layer-sensitive quantization and channel-layer probability models feed arithmetic coding. A streamer adapts each context chunk between compression levels and text recomputation, while GPU decoding overlaps transmission.
Mathematical and graph model
Tensor statistics and layer-quality sensitivity determine encoding. Online selection uses observed bandwidth, chunk size, available GPU computation, and a TTFT budget. Experiments report quality–size and quality–TTFT tradeoffs rather than a constellation optimization model.
Evaluation methodology
A four-A40 server evaluates Mistral-7B and long-context Llama-34B/70B variants on 662 contexts from LongChat, TriviaQA, WikiText, and NarrativeQA. The main comparison uses 3Gbps. Sensitivity spans 0.4–400Gbps, context length and concurrency. Random per-chunk bandwidth traces cover 0.1–10Gbps, averaged across 20 traces.
Baselines
Uniform 3/4/8-bit KV quantization. Text-context prefill through vLLM. H2O and LLMlingua context compression. Encoding and adaptation ablations. H2O is evaluated with an idealized offline query-tensor assumption.
Results and evidence conditions
At 3Gbps, measured TTFT improves 3.2–3.7× over default quantization and 3.1–4.7× over text prefill. KV size improves 3.5–4.3× at similar task quality. Under a 1s TTFT SLO, adaptation reduces violation rate from 81% to 8% in the reported random-bandwidth experiment.
Operating assumptions and evidence scope
The evidence establishes compression and bandwidth-adaptive context streaming on terrestrial hardware. Orbital residual novelty can couple chunk decisions to contact expiration, cache-commit completion, solar/thermal budgets, and losses across interrupted transfers. A fair orbital baseline supplies CacheGen the same contact forecast and compression choices as the proposed scheduler.
Original Figure 1 · Original Figure 1 compares full KV-context sharing with compact KV bitstreams. CacheGen changes transferred representation. An orbital extension additionally schedules representation against the remaining contact capacity.Paper source · Open the full-resolution figure
KVServe: Service-Aware KV Cache Compression for Communication-Efficient Disaggregated LLM Serving
Complete primary full text reviewed · Source version: arXiv2605.13734 primary full text. Official SIGCOMM2026 conference identity
Built for
Terrestrial PD-disaggregated serving and prefix-cache offloading select KV compression by workload quality and service latency.
Problem formulation
Fixed compression pipelines trade communication savings against GPU compression cost and task accuracy. The best profile changes with workload and effective bandwidth.
Algorithm and system design
A composable Transform→Quantizer→Codec pool includes mixed-precision head-wise quantization. Constraint-aware Gaussian-process Bayesian optimization constructs a three-dimensional quality/ratio/throughput Pareto frontier. The controller combines an analytic benefit boundary with a small epsilon-greedy bandit and EWMA latency residuals.
Mathematical and graph model
Equation 1 models profile latency as T_p(c)=T_model(w)+V/s_p+V/(B·cr_p), with baseline T_0=T_model+V/B. Equations 2–3 minimize T_p subject to T_p≤T_SLO and q_p(w)≥q_min. V is original KV bytes, B effective bytes/s, s_p effective compression-plus-decompression bytes/s, and cr_p compression ratio. The model assumes a fixed model/serving configuration within a decision segment.
Evaluation methodology
vLLM0.10.1 and lm-eval-harness evaluate Qwen2.5-7B/32B-Instruct and Llama-3.1-8B-Instruct. Profiling uses four A100-40GB GPUs. Serving uses RTX4090/5090, RTXPro6000 and H100 tiers at 10/50/100Gbps. Four profiling datasets and two held-out QA datasets assess generalization. Linux/NIC rate control sweeps bandwidth.
Baselines
Uncompressed BF16. Integrated CacheGen and KIVI modules. DuoAttention for pruning/quality comparisons. Unified versus service-aware profiles and offline/online controller ablations. The accuracy constraint is 97% relative to the BF16 task baseline.
Results and evidence conditions
Reported maxima are 9.13× lower JCT in PD serving on HotpotQA and 32.8× lower TTFT in prefix caching under the evaluated constrained-bandwidth settings. Table 1 reports 100.35% mean relative accuracy and 8.28× mean compression ratio for service-aware profiles. These are workload averages within that table.
Operating assumptions and evidence scope
Service-aware bandwidth/quality control already defines a strong compression baseline. Orbital novelty must add coupled placement, finite contact deadlines, battery/thermal cost, and transfer recovery semantics. Credit the measured version as arXiv2605.13734 with conference identity verified from the official SIGCOMM2026 program.
Original Figure 6 · Original Figure 6 links offline strategy profiling, online service-aware selection and the serving data path. For orbital work, retain these compression choices while exposing finite contact capacity and energy state to a joint scheduler.Paper source · Open the full-resolution figure
Complete primary full text reviewed · Source version: arXiv2602.21548v2,26February2026. Source title literal: DualPath: Breaking the Storage Bandwidth Bottleneck in Agentic LLM Inference. Conference title from official2026 program
Built for
Multi-turn agentic inference reloads high-hit-rate KV state from SSD-backed distributed storage into separate prefill and decode workers.
Problem formulation
Prefill storage NICs saturate while decode storage NICs remain lightly used. Long contexts with short appends make cached-state transfer dominate execution and leave GPU compute capacity idle.
Algorithm and system design
Dual-path loading combines storage→prefill with storage→decode→prefill over the compute RDMA fabric. CNIC-centric traffic management isolates model-critical collectives. Global routing balances storage queues, and a compute-quota scheduler balances attention execution across engines using chunked prefill.
Mathematical and graph model
Bandwidth accounting bounds admissible P/D ratios using GPUs per node, storage-NIC bandwidth, compute-NIC bandwidth and DRAM traffic. The scheduler fits attention execution time from cached/appended tokens and packs FIFO requests under a compute quota. The transport design assigns model inference and KV traffic separate virtual-lane priorities.
Evaluation methodology
Hopper servers carry eight GPUs, eight 400Gbps compute NICs and one 400Gbps storage NIC. 3FS supplies SSD-backed KV storage. DS660B, an internal DS27B variant and Qwen2.5-32B replay three 500-trajectory agent datasets with 32K/48K/64K context bounds. The scale experiment reaches 48P96D, or 144 servers and 1152 GPUs.
Baselines
Primary gains compare DualPath with Basic, the same internal runtime. SGLang with HiCache/Mooncake/3FS is reported separately with configuration differences. Oracle bypasses disk reads and state transfers. Ablations isolate path choice, traffic management and compute scheduling.
Results and evidence conditions
Against Basic, the primary version reports up to 1.87× offline throughput and 1.96× average online agents/s while meeting TTFT/TPOT SLOs. The 1.87× maximum corresponds to DS660B. The large 48P96D experiment establishes scaling behavior under the authors’ internal framework.
Operating assumptions and evidence scope
The data path relies on a separately provisioned, high-capacity compute fabric with spare bandwidth between collectives. Orbital transfer must debit relay KV bytes against the same ISL capacity used by model traffic and account for expiration, terminal power and shared bottlenecks. Report February arXivv2 measurements separately from the official updated conference title.
Original Figure 4 · Original Figure 4 exposes both KV loading paths, GPU/DRAM staging and compute/storage NICs. An orbital comparison must charge every relay hop against shared laser-link capacity and energy.Paper source · Open the full-resolution figure
Connex: Endpoint Mobility Primitives for Dynamic LLM Serving
Main conferenceT · Terrestrial reference
SIGCOMM · 2026 · Yanying Lin; Vincent Liu; Tao Luo; Chengzhong Xu; Kejiang Ye
Complete primary full text reviewed · Source version: Conference primary paper
Built for
Elastic terrestrial serving changes worker membership while token streams, activations and KV transfers remain in flight.
Problem formulation
Fixed communication groups impose collective quiescence and route rebuilding during join, leave and migration. Reordered or duplicated in-flight state and shared queue pressure amplify P99 request latency during churn.
Algorithm and system design
A stable logical-endpoint mobility contract combines epoch/lease routing, prepare→cutover→commit handover, sequence-based deduplication, receiver credits and traffic-class isolation. ZeroMQ supplies control coordination. Pooled UCX/RDMA connections and capability-aware transport selection carry tensor data.
Mathematical and graph model
Explicit protocol state machines track logical IDs, route epochs, leases, acknowledged sequence ranges and receiver-buffer credits. The continuity guarantee assumes recoverable request state and available replacement endpoints. Irreversible state loss is escalated to the serving framework.
Evaluation methodology
Five servers each contain four A40-48GB GPUs and 100Gbps ConnectX-6 NICs behind one full-bisection switch. Splitwise-derived request lengths drive PD and PP workloads. Joins/leaves, 30–120s preemption intervals, bursty loads and directory tests to 2000 mock endpoints evaluate churn. The source labels its serving model Llama3-13B.
Baselines
NCCL, MooncakeTE, NIXL and ZeroMQ. NCCL2.27.5 shrink and destroy/reinit microbenchmarks. Compact/mobility header and credit-path microbenchmarks. Source goodput is the fraction of issued requests completing with serving-layer continuity.
Results and evidence conditions
The paper reports up to 85% lower churn-induced P99 spikes and 100% continuity success at moderate load versus 0–28% for baselines, with less than 5% steady-state overhead. Pair-local blocking cutover is about 11ms in a cross-pod microbenchmark. NCCL shrink is about 30ms and destroy/reinit about 554ms in a same-node two-rank benchmark.
Operating assumptions and evidence scope
Generic endpoint migration, epoch routing and ordered handover already exist as current networking prior art. Orbital residual novelty concerns finite contact deadlines, predicted separation, disconnected control paths, state-size feasibility and energy-constrained placement. Equal physical links, migration opportunities and forecast information make Connex an informative baseline. SLO-qualified throughput is a separate reported metric.
Original Figure 4 · Original Figure 4 places the mobility contract between applications and transport/physical links. Orbital adaptation can extend the contract with a transfer deadline and contact-budget admission while retaining sequence and credit semantics.Paper source · Open the full-resolution figure
Janus: A Unified Distributed Training Framework for Sparse Mixture-of-Experts Models
Complete primary full text reviewed · Source version: Conference primary paper
Built for
Distributed sparse-MoE training can choose an expert-centric token exchange or a data-centric expert-weight fetch for each MoE block.
Problem formulation
Expert routing produces expensive AlltoAll token exchanges and synchronization. For long sequences and suitable expert size, fetching weights to resident tokens can transfer fewer bytes and overlap computation.
Algorithm and system design
Janus selects communication paradigm through a traffic-volume threshold. Credit-bounded expert buffers, hierarchical per-machine caching and gradient merging, fine-grained asynchronous fetch, PCIe/NVLink-aware pull ordering and layer-ahead prefetch overlap communication with compute.
Mathematical and graph model
Equation 1 derives R=B·S·k/(4·n·H·E) as expert-centric/data-centric traffic ratio: B batch per worker, S sequence length, k top-k, n machines, H hidden dimension and E experts per worker. R>1 favors weight fetching under the model’s balanced token distribution and FFN shape assumptions. Iteration barriers retain synchronized parameter updates.
Evaluation methodology
Four machines contain 32 A100-SXM80GB GPUs, 200Gbps NICs and NVLink/NVSwitch within each machine. Experiments train twelve-block MoE-BERT, MoE-GPT and MoE-Transformer-XL with 32 experts per MoE block. Batch/sequence sensitivity and a pyramidal-residual MoE variant cover 16/32GPU configurations.
Baselines
Tutel supplies the main optimized expert-centric comparison. Janus expert-centric/data-centric variants and topology-priority/prefetch ablations isolate traffic-paradigm and scheduling contributions.
Results and evidence conditions
The source reports up to 16× lower traffic and up to 2.06× training speedup. Its standard 32GPU configuration achieves 1.28×, 1.48× and 1.52× iteration speedup for MoE-BERT/GPT/Transformer-XL versus Tutel. The 2.06× maximum arises in the 16GPU pyramidal-residual MoE experiment.
Operating assumptions and evidence scope
Moving expert weights toward tokens is established training prior art. Orbital novelty can jointly choose bytes, expert placement and update freshness across expiring contacts, charging repeated weight refresh and gradient return. Extend the same R-based selector with contact feasibility before assessing a new temporal policy.
Original Figure 4 · Original Figure 4 shows per-worker expert buffers and per-machine expert caches. Janus supplies a concrete weights-versus-tokens baseline. Orbital versions also track weight freshness and deadline-feasible gradient return.Paper source · Open the full-resolution figure
UBEP: Re-architecting Expert Parallelism Communication Library for Production Superpods
Complete primary full text reviewed · Source version: Conference-formatted arXiv2607.06202 primary paper
Built for
MoE inference dispatch on hierarchical superpod fabrics exposes globally addressable memory and low-latency remote access.
Problem formulation
Bulk-synchronous dispatch kernels serialize metadata, payload and reordering phases. Global barriers and distance-dependent access create idle accelerator cores and uneven expert traffic.
Algorithm and system design
Kernel decomposition splits communication dependencies across accelerator vector cores. Hierarchical token scheduling balances hop-distance classes. Data-as-Flag combines payload readiness with atomic writes through Token-Flag Fusion, Data Checksum or Sentinel Polling.
Mathematical and graph model
A distance hierarchy distinguishes intra-NPU, one-hop and two-hop access. Scheduling maps logical token work to physical vector cores using prefix-sum/virtual-matrix remapping, while dependency analysis overlaps token sending and address calculation. The primary fabric assumption includes 512B atomic remote writes and a unified global address space.
Evaluation methodology
A production CM384 allocation contains 16 Ascend servers and 256 NPU dies. Experiments sweep 16–256 ranks, batch size, expert count and top-k. End-to-end serving covers Qwen3-30B, GLM-4.7, DeepSeek-R1 and DeepSeek-V3.2, spanning 30B–685B parameters. Operator latency and inference TPOT are separate metrics.
Baselines
CANN EP on the same CM384 is the primary performance baseline. An unmapped UBEP variant and Stop-and-Wait/TFF/DC/SP synchronization variants support ablation. DeepEP on H800 is a protocol-capability reference with a separate hardware scope.
Results and evidence conditions
On identical CM384 hardware, dispatch operator latency decreases by up to 52.4% and inference TPOT by up to 11.1% versus CANN EP. Table 4 reports 35.3–40.8% effective-bandwidth improvement across 16–256 ranks. These measurements establish communication-library benefits under the superpod fabric.
Operating assumptions and evidence scope
Fine-grained MoE communication and topology-aware dispatch already supply a current strong baseline. Orbital protocols require explicit reliability, memory-ordering, acknowledgment and epoch semantics over optical packet links. The atomic-global-memory optimization transfers under a matching substrate. Residual novelty concerns expiring contacts and resource-coupled dispatch schedules.
Original Figure 4 · Original Figure 4 joins kernel decomposition, hierarchical token scheduling and Data-as-Flag. Its measured target is MoE inference communication. An orbital implementation must specify the message protocol supporting these dependency semantics.Paper source · Open the full-resolution figure
HyNA: Taming Tail Latency in MoE Training with Hybrid Switch Silicon
Main conferenceT · Terrestrial reference
SIGCOMM · 2026 · Yang Liu; Tianxiang Liu; Haipeng Yao
Built for
Terrestrial training gradient AllReduce uses in-switch accumulation with a fast integer pipeline and embedded exception cores.
Problem formulation
Host parameter-server incast and off-chip fallback for hash collisions amplify synchronization tails under sparse, bursty gradients. A single delayed gradient block extends the BSP barrier.
Algorithm and system design
HyNA couples an RMT line-rate INT32 aggregation path with on-chip RISC-V exception handling for collisions and FP32 overflow recovery. A precision-aware protocol dynamically quantizes gradient blocks, tracks aggregation slots and handles recovery through an on-chip exception loop.
Mathematical and graph model
BSP synchronization time follows the slowest completed gradient block. Slot collisions and exception arrival bursts drive a queueing/throughput model. Little’s Law dimensions exception queues for 200µs sustained bursts. Cycle-level analysis and 7nm synthesis estimate switch bus, core, area and power costs.
Evaluation methodology
An AlveoU280 FPGA at 250MHz implements 100Gbps aggregation. Two physical servers with ConnectX-5 NICs replay closed-loop gradient traces as 256 logical workers, preserving BSP acknowledgment barriers. Traces include Llama3-70B and DeepSeek-V2-236B. Separate Llama3-8B/Qwen7B training on a C4 slice checks convergence over 5000 iterations.
Baselines
BytePS measures host-mediated aggregation throughput. SwitchML measures static INA. ATP is emulated by redirecting collision packets to a fallback-server port. NCCL2.18 FP32 supplies the numerical-fidelity reference. Wire speed supplies a physical upper bound.
Results and evidence conditions
Measured goodput is 84.5Gbps versus 11.5Gbps BytePS and 60Gbps ATP 7.35× and 1.4×, respectively. DeepSeek-V2 gradient synchronization improves 1.6× over ATP and 2.3× over BytePS. Estimated silicon area overhead is 2.9%. The∼14% full-training benefit is a phase-fraction estimate.
Operating assumptions and evidence scope
The explicitly evaluated MoE phase is gradient AllReduce. Expert-routing AlltoAll defines a parallel workload family. The 256-worker scale is hardware-in-the-loop emulation. FPGA datapath and ASIC synthesis supply separate evidence. Orbital INA research must cost onboard aggregator state, radiation recovery, energy and contact-aware partial-gradient completion.
Original Figure 3 · Original Figure 3 keeps integer accumulation and exceptional FP32/collision handling inside the switch. The figure explains on-chip closure. Orbital aggregation additionally requires a contact- and failure-aware lifetime for partial gradient state.Paper source · Open the full-resolution figure
Cyclops: An FSO-based Wireless Link for VR Headsets
Main conferenceT · Optical-terminal adjacency
SIGCOMM · 2022 · Himanshu Gupta; Max Curran; Jon Longtin; Torin Rockwell; Kai Zheng; Mallesham Dasari
Complete primary full text reviewed · Source version: Conference primary paper
Built for
A VR headset that moves and turns while a narrow laser beam keeps feeding it data.
Problem formulation
Both ends of an optical link have to aim at each other. Receiver angle and position together set the optical loss, so a moving endpoint demands fast and well-calibrated pointing.
Algorithm and system design
Headset pose feeds a learned pointing function that emits four steering voltages for the transmit and receive galvo mirrors. A two-stage geometric calibration learns each mirror assembly and the mapping between their coordinate frames. Commodity 10G and 25G optics carry the data.
Mathematical and graph model
A calibrated ray model turns mirror voltages into beam origin and direction, then solves the joint pointing problem backwards from six-dimensional pose. Lateral and angular tolerance plus measured steering delay drive a connectivity simulation over one-millisecond slots.
Evaluation methodology
Bench prototypes span 1.5 to 2 metres on a linear rail, a rotation stage and hand-held mixed movement. iPerf measures throughput and received optical power at 10G and 25G. Trace replay uses 500 one-minute head-motion traces from 50 viewers, with pose reported every ten milliseconds and steering latency measured at one to two milliseconds.
Baselines
Collimated against diverging beams, 10G against 25G optics, and pure linear, pure angular and mixed motion runs that locate the tolerance limits.
Results and evidence conditions
Throughput reaches 9.4 Gbps at 10G and 23.5 Gbps at 25G within the tested movement. The 25G trace study reports 98.6 percent of one-millisecond slots connected across 500 traces, with per-trace connectivity between 95 and 99.98 percent.
Operating assumptions and evidence scope
The scope is an indoor optical terminal on the ground. Orbital reuse would carry over the pose to pointing calibration and the tolerance decomposition, while adding kilometre range, spacecraft attitude jitter, radiation, solar background and thermal qualification.
Original Figure 5 · Original Figure 5 shows tracking reports feeding a learned joint TX/RX mirror controller. It provides a terminal-calibration reference for optical mobility. Orbital designs separately define attitude, range and acquisition envelopes.Paper source · Open the full-resolution figure
Harvest: Adaptive Photonic Switching Schedules for Collective Communication in Scale-up Domains
Photonic scale-up domains with typically 8–64 GPUs, predetermined step-wise collective traffic, bounded per-GPU optical port degree, and GPU multi-hop forwarding. A synchronized controller can choose each topology and the reconfiguration instants.
Problem formulation
Given an existing collective algorithm, its fixed step matrices M_i and data volumes m_i, link bandwidth, port degree and reconfiguration latency α_r, synthesize a topology per step minimizing collective completion time. A topology change trades a setup penalty against propagation distance and shared-link congestion.
Algorithm and system design
Partition collective steps into contiguous intervals. Each interval receives one optimized topology from a degree-constrained maximum-concurrent-flow MISOCP. A dynamic program chooses interval boundaries and then the reconfiguration count. Recursive Doubling connectivity and interval-topology structure yield an analytical subproblem with polylogarithmic schedule synthesis and cached schedules.
Mathematical and graph model
Equation (4) adds per-step launch cost α, δ times path distance, β m_i divided by maximum concurrent flow θ, and α_r for topology changes. Equations (5)–(8) define the interval topology optimization and DP recurrence. Directed integer edge multiplicities obey incoming/outgoing degree limits. Commodity conservation and capacities constrain routing. The guarantee is optimal topology scheduling for the supplied fixed collective and model.
s is collective step count. A and b are interval boundaries. K counts reconfigurations. T_c is the optimized interval completion time. Α_r is the per-change cost. DP excludes that additive cost until choosing k.
§4.2 Equation (7), PDF p6; §4.3 Equation (8), PDF p7
Evaluation methodology
ASTRA-sim packet-level extensions, flow/numerical optimization, and an eight-GPU emulation testbed cover 8–64-GPU scale-up domains. Analytical Recursive Doubling runtime scales to 1024 modeled nodes. Simulated ports use 800 Gb/s. The eight BlueField-3 NICs use 100-Gb/s optics and GPUDirect RDMA. NCCL operations execute step by step. Measured runtimes are summed with a supplied fixed switch penalty. Reconfiguration latency spans 10 ns–10 ms.
Baselines
Static rings, 2D/3D tori and generalized Kautz topologies. Birkhoff–von Neumann schedules reconnect communicating pairs at every step. Best-of-static-and-BvN. Ring versus Recursive Doubling collective choices. Workloads include Recursive Doubling, Swing/Bine butterfly, Bruck AllReduce and All-to-All, direct All-to-All, binomial/binary-tree broadcast.
Results and evidence conditions
At <1-µs switch latency and 1–256-KB messages, packet simulation reports 6.4×, 4.7× and 20× over selected static Recursive Doubling, Swing and All-to-All executions. At 100 µs, 1–256-KB messages average 7.3×, 10× and 5.3× over BvN respectively. Hardware emulation shows about 3× over a static ring and an intermediate regime beating both extremes. Recursive Doubling DP computation is <20 µs up to 64 nodes and averages <35 µs up to 1024. The calibrated model uses α=30.32 µs and effective bandwidth 85.11 Gb/s.
Operating assumptions and evidence scope
The eight-GPU testbed emulates reconfigurable optics through NIC flow steering and additive switch penalties. A physically changing photonic switch and full training-job deployment require dedicated evidence. General MISOCP reaches up to 64 GPUs. The microsecond synthesis result concerns the structured Recursive Doubling path. Collective algorithm selection, shared-job switching, overlapping pipeline traffic and scale-out integration are extension areas. Source appendices are labelled supporting material.
Original Figure 2 · Figure 2 shows Recursive Doubling step demands, the selected physical topologies and the resulting congestion. Direct optical reconnection trades congestion against setup.Paper source · Open the full-resolution figure
Opus: Photonic Rail-Optimized Fabric in ML Datacenters
Main conferenceT · Terrestrial reference
SIGCOMM · 2026 · Eric Ding, Barry Lyu, Bhaskar Kataria, Rachee Singh
Built for
Rail-optimized scale-out ML clusters with predictable hybrid-parallelism phases, strong scale-up connectivity, commodity one-to-one OCS circuits, per-rail orchestrators and an application-level coordination network.
Problem formulation
Electrical rails provide high fan-out connectivity at substantial power and cost. Replace their packet switches with optical circuits while retaining useful per-phase connectivity for TP/DP/PP/CP/EP. The controller assigns the same limited ports to different parallelism dimensions over an iteration and hides reconfiguration in idle windows.
Algorithm and system design
A PyTorch shim profiles the first five steps, intercepts collectives, classifies management versus data traffic and identifies phase boundaries. A per-job controller synchronizes ranks and issues topology IDs to per-rail OCS orchestrators. Locks and completion callbacks drain affected traffic before circuit changes. Provisioning starts the next configuration after the previous phase. Per-stage sub-mappings permit asynchronous pipeline progress.
Mathematical and graph model
This is a system/protocol design with phase-indexed topology state and rank-ready counters. Exposed switching cost is Σ_i max(0,T_reconfig−T_window,i). Safety invariants serialize communication and reconfiguration on affected sub-mappings. Topology encoding captures up to nine symmetric parallelisms plus an asymmetric PP dimension. The power/cost model counts electrical ports, OCS ports and transceivers separately.
T_reconfig is circuit setup duration. T_window,i is the post-phase idle window. Affected communication starts after configuration completion. Reconfiguration starts after affected in-flight work completes.
§4.2 Provisioning, PDF p7: source displayed expression; safety invariants G1/G2 in the same section
Evaluation methodology
Physical hardware: four dual-L40 servers, a 64-port Polatis 6000 OCS, dual ConnectX-6 Dx NICs per server and two 100-Gb/s rails, running six-layer Llama-3. Perlmutter emulation executes TorchTitan training up to 64 A100 GPUs with logically enforced circuit connectivity and injected switching delays. ASTRA-sim with Chakra traces evaluates dense/MoE iteration times up to 2048 modeled H200/B200 GPUs, 0–1000-ms switching and 100–1600-Gb/s scale-out links.
Baselines
Hardware validates phase reconfiguration and link recovery. Perlmutter compares native NCCL/EPS, Opus and Opus+Provisioning. Simulation compares static EPS with every potentially configured link active and ideal one-shot allocation of the same total bandwidth across parallelisms. Power/cost compares rail-optimized EPS and fat-tree EPS using declared per-port accounting.
Results and evidence conditions
Physical optics recover within the 200-ms observation interval, while NIC firmware reports link-up around 6 s, falling to about 3 s with auto-negotiation disabled. At 50-ms injected switching, Perlmutter provisioning reduces step overhead to about 1%/2% for the two Llama configs. Zero-switch control overhead at 64 GPUs falls from 6.13% to 0.79% with provisioning. Simulation reports 5.31% slower than EPS at 128 H200/100 ms, 2.49% at 512 B200/10 ms, and 11.22% at 2048 B200/10 ms. Estimated rail power savings are 23.9× H200 and 15.4× B200. Cost savings are 4.3×/3.2×.
Operating assumptions and evidence scope
Physical OCS deployment exposes a NIC firmware recovery bottleneck. Low-overhead millisecond results use injected-delay emulation or simulation. Simulated EPS has a higher total bandwidth budget and abstracts switch congestion. Energy/cost ratios are per-port estimates with fiber costs outside the accounted components. MoE scale-out All-to-All and shorter phase windows increase overhead: at 88.9% scale-out EP traffic, 256-GPU simulation reports 22.5% degradation at 10-ms switching.
Original Figure 7 · Figure 7 shows the shim, per-job controller, per-rail OCS orchestrators and metadata tables coordinating phase-triggered topology changes and RDMA traffic.Paper source · Open the full-resolution figure
MixNet: A Runtime Reconfigurable Optical-Electrical Fabric for Distributed Mixture-of-Experts Training
Main conferenceT · Terrestrial reference
SIGCOMM · 2025 · Xudong Liao; Yijun Sun; Han Tian; Xinchen Wan; Yilun Jin; Zilong Wang; Zhenghang Ren; Xinyang Huang; Wenxue Li; Kin Fai Tse; Zhizhen Zhong; Guyue Liu; Ying Zhang; Xiaofeng Ye; Yiming Zhang; Kai Chen
Built for
Distributed MoE training on a terrestrial GPU cluster augments a global electrical packet fabric with runtime-reconfigurable regional optical circuits. TP remains inside the local scale-up domain. Regional EP traffic uses OCS, while DP and PP use the electrical fabric.
Problem formulation
Data-dependent expert routing creates spatially skewed and temporally changing all-to-all demand. A fixed fabric pays for uniform bisection bandwidth, while an optical design must allocate finite server ports and absorb reconfiguration time before collective phases.
Algorithm and system design
Regional topology controllers collect expert demand. A greedy bottleneck-pair algorithm allocates degree-bounded circuits and permutes NIC mappings for NUMA locality. The custom RDMA collective runtime delegates inter-server EP traffic through gateway GPUs, overlaps inter-host and intra-host transfers, and retains hierarchical DP all-reduce on EPS. Four collective matrices within a layer share identical or transposed structure. Available compute phases hide later reconfigurations.
Mathematical and graph model
Algorithm 1 uses expert demand E, server demand D, optical degree α and allocated circuit matrix C. The next allocation targets the largest D[i,j]/C[i,j] completion estimate and proceeds when both endpoints retain spare ports. AppendixB.1 fits a column-stochastic expert-transition matrix P by weighted squared prediction error over a recent window, then predicts next-layer loads from the current-layer distribution. The simulator converts a profiled computation/communication DAG into packet-level events.
P maps normalized expert-load distribution X_i in one layer to Y_i in the next. K is the recent window and w_i its temporal weights. This is traffic prediction. Circuit allocation uses Algorithm 1 and optical degree α.
AppendixB.1 Eq1 PDFp17; probability constraints stated immediately below Eq1
Evaluation methodology
Production profiling uses 128 H800 GPUs and 128 ConnectX-7 400Gbps NICs. The prototype has four servers, 32 A100 GPUs, 16 ConnectX-6 100Gbps NICs, a32×32 Polatis OCS and SN3700 Ethernet switch. Each server assigns 3 NICs to OCS and 1 to EPS. RoCEv2, NCCL and ibverbs carry real Megatron-LM training of truncated Mixtral8×7B, LLaMA-MoE and Qwen-MoE models. FlexFlow plus htsim evaluates full Mixtral8×7B/8×22B, Qwen-MoE and DeepSeek-R1 configurations, normally 1024 GPUs, 100–800Gbps links, 1µs propagation and 25ms OCS setup. Scale sweeps reach 32768 GPUs.
Baselines
The prototype compares an ideal 4×100Gbps-per-server EPS switch configuration. Simulations compare full-bisection fat-tree, 3:1 oversubscribed fat-tree, rail-optimized fabric and TopoOpt. Fixed parallel strategies isolate the fabric contribution. Prediction alternatives use uniform demand and the previous layer distribution. Setup and optical-degree sweeps expose hardware sensitivity.
Results and evidence conditions
The reported 32-GPU prototype iteration times are comparable to the ideal EPS baseline under its adjusted activation-time accounting. Simulated networking performance per dollar improves 1.2–1.5× over fat-tree at 100Gbps and 1.9–2.3× at 400Gbps across four MoE configurations. These ratios measure network cost efficiency. Simulated iteration time improves up to 2.5× over TopoOpt. Commodity OCS setup averages 41.44–46.75ms across 1–16 pairs. Separate NIC reactivation averages 5.67s and reaches 6.33s at P99.
Operating assumptions and evidence scope
AppendixC calculates prototype training time with NIC reactivation removed. The simulated 25ms optical setup is a separate assumption. Optical fiber circuits, region locality, available EPS fallback, fixed parallel strategies and constant propagation define the evaluated regime. Orbital transfer should preserve demand prediction and greedy port allocation while constraining circuits to the same forecast contact graph and charging optical PAT plus transceiver recovery. Residual research can optimize expert-placement and collective epoch commits against externally imposed contact expiry and forecast error, measuring durable optimizer progress, rollback bytes and terminal-energy cost.
Original Figure 6 · Original Figure 6 separates local scale-up connectivity, regional optical circuits and the global electrical fabric. This hierarchy already co-designs MoE communication and runtime optical reconfiguration. Orbital adaptation adds finite contact validity, terminal acquisition and epoch progress constraints.Paper source · Open the full-resolution figure
GeoOrchestra: Orchestrating Heterogeneous Geo-Distributed Training with Network-Aware Scheduling
Dense LLM training across heterogeneous terrestrial GPU clusters shares a constrained WAN. The planner combines resource selection, intra-DC parallelism, inter-DC pipeline partitioning, memory buffering and bandwidth allocation.
Problem formulation
Compute and memory capabilities scale asymmetrically across GPU generations, while shared WAN contention changes the usefulness of a parallel plan. The system seeks low iteration latency subject to stage memory limits and user cost budgets, with stable multi-tenant bandwidth service.
Algorithm and system design
An Analyzer prunes resource subsets through optimistic latency and cost bounds. The Orchestrator greedily shifts contiguous layers away from straggler stages or expands activation buffers to hide WAN delay, then adjusts bandwidth toward the rate needed by the compute window. The Runtime combines virtual-hard-pipe time slots with work-conserving interleaving, candidate-plan failover, synchronized Check-and-Commit launch and RDMA gateway buffering through final receiver commit ACK.
Mathematical and graph model
Equations 1–4 minimize modeled iteration time over resource set R and parallel strategy S under peak memory bounds. Pruning uses a continuous compute-throughput relaxation, PP payload divided by guaranteed bandwidth plus RTT, CDI=T_base/T_lower>1 and a cost ceiling. Equation 9 bounds buffer depth by available memory. Equation 10 models bubble reduction through extra overlapped micro-batches. Each tenant receives B_min=|T_u|·BW_max/N from its allocated slots.
P is pipeline stage count, M micro-batch count, T_step the bottleneck stage latency and T_comm the exposed WAN communication during warm-up. Equation 2 adds M_peak=M_static+β·μ_act+M_frag≤M_limit. Β is buffered micro-batch depth, μ_act activation memory per micro-batch and M_frag fragmentation overhead.
§3.2.1 Eq1 PDFp5; iteration-latency approximation for pruning and planning
Evaluation methodology
A six-node physical testbed has 48 GPUs, 24 H20-141GB and 24 V100-32GB. Each server has four ConnectX-7 100Gbps NICs. The cross-cluster WAN spans 2000km with 10Gbps capacity and 20ms RTT. Experiments cover dense OPT1.3B–175B and Qwen1.5 1.8B–72B families. Simulations extend to 256–1024 mixed V100/H20/A100/H100 GPUs across 4–16 clusters. Two-cluster traces validate simulator error within 5%. Reported metrics include throughput, iteration/memory prediction error and planner latency.
Baselines
Aceso, Varuna, DTFM and Sailor compare parallel planning and training throughput. Homogeneous physical, heterogeneous physical, two-cluster simulation validation and multi-cluster scaling are separate settings. Table 5 compares pruned search with the corresponding unpruned search. Pure-DP systems are discussed under the model-replica memory requirements of large-model V100 deployments.
Results and evidence conditions
Physical heterogeneous throughput improves up to 32% over Sailor. Homogeneous physical throughput improves about 1.15× over Sailor and matches Aceso. Large-scale simulations report 1.63× over Sailor for Qwen and 1.8× for OPT. The abstract 1.6–1.8× headline aligns with this scaling evidence. Heterogeneous iteration-time prediction error stays below 12% and memory error below 18%. Table 5 search-plus-pruning takes 41.5/96.5/164.8s at 32/64/128 GPUs, versus 958.7/1748.2/3641.9s for unpruned search.
Operating assumptions and evidence scope
The evaluated workload is dense training with fixed tensor shapes and sufficient batch depth. Extra overlap benefits depend on memory headroom. Existing contributions cover joint strategy/bandwidth search, dynamic WAN slots, synchronized launch, gateway final commit ACK and failed-chunk restart or reroute. Orbital residual should couple externally imposed, forecast-bounded contact expiry with PAT setup, buffer/energy limits and dependency-consistent collective epoch commits. Dedicated isolation, recovery, durable-progress and power measurements can establish that residual.
Original Figure 5 · Original Figure 5 connects heterogeneous clusters and user constraints to the Analyzer, Orchestrator and Runtime feedback loop. The paper already jointly plans computation and WAN resources. The orbital research question adds externally imposed contact deadlines and durable collective progress.Paper source · Open the full-resolution figure
PReCCL: Performant and Resilient Collective Communication via Integrated Inband Telemetry and Workload Reallocation
Repeated training collectives share heterogeneous virtual topologies in multi-tenant GPU clusters, where one slow topology delays the entire collective.
Problem formulation
A collective communication task partitions tensor bytes across ordered GPU graphs called virtual topologies (VTs). Equal byte allocation leaves healthy VTs waiting for a congested or partly failed VT. The library needs a collective-level view and consistent runtime reallocation across ranks.
Algorithm and system design
Four modules collect FIFO stall counts, choose valid cross-VT policies, compute allocation and enforce it at collective boundaries. Ring/Tree use independent contiguous tensor blocks. AlltoAll uses an intra-node, single-relay GPU policy that prices the extra hop. Epoch-tagged piggyback metadata carries VT ordering and checksum. All ranks validate and deterministically derive the next allocation after the current collective completes, retaining existing NCCL transport connections. Partial-VT failure triggers auxiliary socket signaling, masking, collective retry and lightweight recovery probes.
Mathematical and graph model
Equation 1 estimates VT completion from stall count, bytes and fixed overhead through a fitted linear model. A TeXCP-inspired iterative policy shifts work toward faster VTs and normalizes the total byte allocation. The epoch invariant keeps each allocation immutable during execution and admits its successor after completed execution and validated common metadata. Appendix A models stable positive effective bandwidth within a collective and a min-max allocation objective. These assumptions define the analytical scope. Calibration refits every 10 s by default using a 1000-sample window, at least 100 samples, outlier filtering and EMA smoothing.
The estimated completion time T uses a declared time unit. Count is a dimensionless stall-event count and byteSize is bytes. Alpha has time per stall event, beta has time per byte, and Delta has time units. Parameters depend on GPU group and architecture. This empirical estimator supplies the allocation policy and requires calibration to the replay hardware and contact regime.
§3.2.1 Equation 1, PDF p5/proceedings p400; fitted per-VT completion estimator
Evaluation methodology
The real testbed has four servers with 32 Hopper GPUs, 80 GB HBM per GPU, eight 400 Gbps ConnectX-7 NICs per server, NVLink/NVSwitch and a two-tier leaf–spine fabric. NCCL v2.29 and Megatron-LM run concurrent GPT, Qwen-MoE and BERT training. Multiverse simulates 512/1024 GPUs with Poisson job arrivals and random four-host placements. Matched testbed bus-bandwidth points agree within 6%. A separate 300-job Crux-placement replay runs on 1024 H200 GPUs. The production trial compares 146 completed jobs over two weeks with a preceding two-week NCCL period on 1024 H200 GPUs across 256 servers. Appendix K labels this evidence observational.
Baselines
Real training compares NCCL v2.29, SyCCL and MCCS. Large-scale simulation additionally compares Crux and FuseLink. Crux-placement replay compares Crux with NCCL against Crux with PReCCL. Network-layer experiments use ECMP/DCQCN, packet spraying and HPCC. Ablations replace stall-count estimation with direct completion-time measurement and the coordinated allocator with per-VT AIMD. Startup nccl-tests chooses algorithm/group-size activation thresholds.
Results and evidence conditions
Under the stated 32-GPU multi-tenant workload, average Ring-AllReduce/AlltoAll bus bandwidth improves 1.8×/2.1× over NCCL for messages above 64 MB. GPT/Qwen/BERT training speeds up 1.19×/1.21×/1.18×. The 300-job placement replay reduces median/P95 JCT by 5.5%/22.1%. The observational production trial reports median/P95 JCT reductions of 5.7%/51.2% and median NIC utilization improvement of 21.4%. Gray-failure recovery drives much of the tail gain. At 64 MB, reported AlltoAll and Ring/Tree overheads are 0.11% and 0.97%. A partial NIC failure retains 78% of pre-failure bus bandwidth after reconvergence within five reported rounds.
Operating assumptions and evidence scope
Adaptation uses at least one preceding collective and stable effective bandwidth within each collective. Ring/Tree activation thresholds range from 8–64 MB across the reported algorithm/group sizes. Single-shot and smaller operations use default allocation. Recovery assumes surviving VTs and a functioning auxiliary control path. Full group disconnection uses checkpoint restart. AlltoAll evaluation uses symmetric per-rank data and bounded intra-node relay candidates. Production gains have observational before/after scope. The Appendix A convergence-rate arithmetic and the main/appendix averaging definitions merit independent proof/implementation reconciliation. The five-round result is reported empirical evidence. Configured NCCL timeout, retry duration and retried bytes define absolute recovery latency. Tensor-output checks establish payload correctness beyond metadata checksums.
Original Figure 5 · Figure 5 connects collective FIFO congestion/fault signals to inband telemetry, cross-VT policy selection, data reallocation and next-collective enforcement. These modules already implement collective-level runtime adaptation. The orbital comparison adds externally bounded contacts and progress commit under the same forecast.Paper source · Open the full-resolution figure
BIER-DC: Stateless Multicast for In-Orbit Space Data Centers in LEO Constellations
The official ICNP 2026 technical program lists this main-conference title with Mostafa Abdollahi, Wenjun Yang, Kousar Malekinasab and Jianping Pan, all at the University of Victoria. This program entry establishes the venue, title and authors, and signals active interest in orbital datacenter forwarding. Its full-text mechanism, baselines and quantitative results carry technical status unverified in this report. The full-primary corpus and original-figure coverage count apply to the analyzed papers above.
Planet-Scale IoT Connectivity via LEO Satellites. Ziyue Zhang; Xianjin Xia; Ruonan Li; Jinhong Liu; Yuanqing Zheng; Linghe Kong; Mo Li. SIGCOMM, 2026. Main conferenceA/C · Contact-limited IoT service
SDN in the Stratosphere: Loon’s Aerospace Mesh Network. Frank Uyeda; Marc Alvidrez; Erik Kline; Bryce Petrini; Brian Barritt; David Mandle; Aswin Chandy Alexander. SIGCOMM, 2022. Main conferenceX · Stratospheric adjacency
Exploring the “Internet from space” with Hypatia. Simon Kassing; Debopam Bhattacherjee; André Baptista Águas; Jens Eirik Saethre; Ankit Singla. IMC, 2020. Main conferenceA · Communication constellation
A First Look at Starlink Performance. François Michel; Martino Trevisan; Danilo Giordano; Olivier Bonaventure. IMC, 2022. Main conferenceA · Communication constellation
Assessing LEO Satellite Networks for National Emergency Failover. Vaibhav Bhosale; Ying Zhang; Sameer Kapoor; Robin Kim; Miguel Schlicht; Muskaan Gupta; Ekaterina Tumanova; Zachary S. Bischof; Fabián E. Bustamante; Alberto Dainotti; Ahmed Saeed. IMC, 2025. Main conferenceA · Communication constellation
CacheGen: KV Cache Compression and Streaming for Fast Large Language Model Serving. Yuhan Liu; Hanchen Li; Yihua Cheng; Siddhant Ray; Yuyang Huang; Qizheng Zhang; Kuntai Du; Jiayi Yao; Shan Lu; Ganesh Ananthanarayanan; Michael Maire; Henry Hoffmann; Ari Holtzman; Junchen Jiang. SIGCOMM, 2024. Main conferenceT · Terrestrial reference