The Whole Story in One Minute
FP8 number formats let the GPU's tensor cores run matrix multiplications at twice the BF16 peak, and an FP8 weight file halves the bytes the GPU must stream for each weight matrix. A roofline calculator therefore says every projection matmul should get 2× cheaper, no matter which limit binds. The deployment question is whether that 2× GEMM efficiency survives the trip through a real serving engine into isolated vLLM engine-step latency. We turn it into a falsifiable test on a single quantity — the per-cell BF16/FP8 speedup ratio — with a nominal, parameter-free transfer model that adds ZERO new FP8-fitted constants: it halves the entire projection term of an existing BF16 mechanism model and holds everything else (KV traffic, elementwise kernels, the host floor) precision-invariant. This is a deliberate straw-man, NOT an upper bound. We then test it on Llama-3.1-8B across 60 cells (30 decode, 30 prefill) on H100 and H200.
1 · Prefill: the efficiency transfers
Prefill is compute-bound, so the matmuls dominate the step and doubling the FP8 peak helps. Measured prefill speedup is 1.45× against a nominal 1.59× — a 10.2% mean error from a model that fit nothing to FP8. The nominal model is biased high (it over-predicts in 29/30 cells, but one cell exceeds it — confirming it is a straw-man, not a bound). All 30 prefill cells have a 95% CI strictly above 1. The 2× GEMM efficiency partially transfers.
2 · Decode: falsified, and FP8 is slower
Decode is memory- and host-bound, so the closed form predicted only a small 1.10× speedup. Reality has the opposite sign: FP8 decode is 1.27× SLOWER than BF16 (measured ratio 0.79, 39.0% mean error). Every one of the 30 decode cells has a 95% CI strictly below 1 — the falsification is sharp, not noisy.
3 · Why decode breaks: activation quant
A W8A8 FP8 path must quantize the activations to FP8 on every step before each matmul. An nsys trace counts it directly: a per-matmul scaled_fp8_quant kernel runs ~181 times/step (absent in BF16, ~1.0 ms/step of GPU time) plus ~245 extra host kernel launches/step. In eager mode vLLM runs one CUDA stream with serial kernels, so this added work lands on the critical path by construction. At decode batch sizes the halved weight-stream saves almost nothing (the step is already host- and KV-dominated), while the added quant work is paid every step. FP8 nets a 27% slowdown on average, up to 47% at the largest batch×ctx.
4 · The decision-relevant headline
The same FP8 checkpoint has opposite latency value in the two phases. Weight+activation FP8 helps prefill-heavy and throughput-oriented serving (a real, predictable ~1.45×), but HURTS decode-latency-bound serving with tight per-token SLOs. The actionable rule: phase-aware precision — FP8 prefill workers, BF16 decode workers — and FP8 decode kernels that fuse or amortize activation quantization.
The Roofline 2× and the Two Phases
No background is assumed. Three ideas carry the rest of the page: what the 2× FP8 GEMM efficiency is, why prefill and decode sit on opposite sides of it, and why a per-step host cost can flip the sign of the answer.
The 2×: two datasheet numbers move
Each projection matmul obeys the roofline below: its time is the larger of a compute branch (FLOPs over peak rate) and a memory branch (bytes over HBM bandwidth). FP8 changes exactly two datasheet quantities for the weight matrices — the matmul peak doubles, and the weight bytes per element halve. Where the weight stream or the dense FLOPs dominate, the projection time approaches a 2× drop. That nominal 2× is the transfer target whose realization in real latency we test — not assume.
Here $P_f$ is the BF16 peak, $\beta_{hbm}$ the HBM bandwidth, $B$ the weight bytes per element, and $\bar\eta,\eta_m$ are efficiencies measured once with ncu microbenchmarks — never fit to served latency. FP8 sets $P_f\!\to\!2P_f$ and $B\!\to\!B/2$, so $t_{\text{gemm}}$ halves on either branch.
Prefill and decode sit on opposite branches
Prefill processes the whole prompt at once, so the matmuls have many rows ($M$ large) and the compute branch binds — doubling the peak should help. Decode emits one token per request per step, so $M$ is tiny and the memory branch binds: only the halved weight bytes help, and only on the small slice of the step that is weight-streaming. The rest of a decode step is attention/KV traffic and a CPU-side host floor that FP8 does not touch at all.
Prefill (compute-bound)
matmuls dominate the step; doubling the FP8 peak should move the speedup toward 2×Decode (memory + host-bound)
the weight-stream FP8 halves is a small slice; the host floor and KV traffic dominateThe hidden cost FP8 ADDS
W8A8 must quantize activations to FP8 every step — a per-step cost the roofline omitsA Zero-Constant Transfer Prediction
We reuse a BF16 single-GPU mechanism model whose constants come only from ncu microbenchmarks and datasheets — never fit to served step-time. It decomposes a step into projection GEMMs, attention/KV traffic, elementwise kernels, a kernel-launch floor, a non-overlapped host/scheduler term, and sampling.
The predicted speedup $r$ is the BF16 step over the FP8 step. For prefill, $T_{\text{proj}}$ dominates and the host term is small, so halving $T_{\text{proj}}$ pushes $r$ toward 2×. For decode, the memory branch makes $T_{\text{proj}}$ small while a large minority of the step is a non-overlapped host floor, so even halving $T_{\text{proj}}$ barely lifts $r$ above 1 — the closed form predicts 1.10×, essentially 'no transfer, slight help.' The measurement below shows decode is worse than this: an actual slowdown.
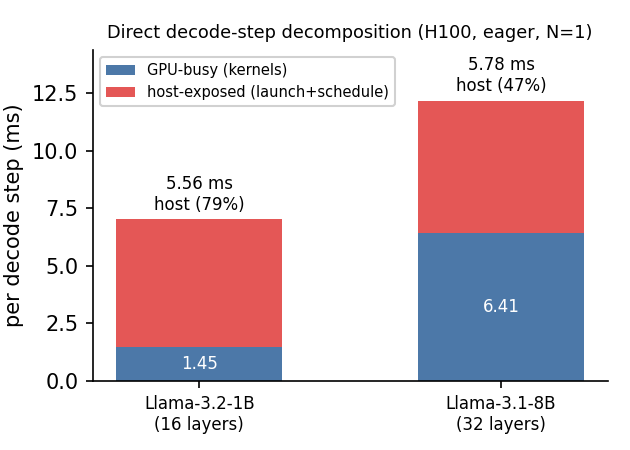
Direct host-vs-GPU split of the small-batch decode step (H100, eager, N=1, ctx-2048), from differencing two nsys runs. The 8B step is 6.41 ms GPU-kernel + 5.78 ms host-exposed (47.4%); the host floor is model-size-invariant (5.56 ms at 1B). FP8 halves only a slice of the GPU part and adds quant kernels, leaving this host floor — why small-batch FP8 decode is slower.
How a phase is isolated and timed
For $N$ prompts of length ctx we generate 65 tokens with ignore-eos and greedy sampling. The DECODE step is (wall(65) − wall(1)) / 64, which cancels the prefill and startup overhead and leaves the per-step decode work (sampling included). The PREFILL step is wall(1), the single-step latency to emit the first token. We sweep batch $N\in\{1,4,16,32,64\}$ and ctx $\in\{512,2048,8192\}$, 15 timed reps per cell after 2 warmups, medians per arm. The per-cell FP8/BF16 ratio is median(BF16)/median(FP8); its 95% CI is a bootstrap that resamples each arm's 15 reps independently.
Two Clean, Opposite Outcomes
Across 60 cells (30 decode, 30 prefill) on H100 and H200, two opposite outcomes emerge. The table summarizes per-phase: the measured speedup ratio, the nominal zero-FP8-constant prediction, the mean absolute error, and how many cells have a 95% CI separated from the no-effect line of 1.0.
| Phase | measured (×) | nominal pred (×) | MAPE | range (×) | CI separated | verdict |
|---|---|---|---|---|---|---|
| Prefill | 1.45 | 1.59 | 10.2% | 1.07–1.59 | 30/30 > 1 | transfers (partial) |
| Decode | 0.79 | 1.10 | 39.0% | 0.68–0.84 | 30/30 < 1 | falsified — FP8 slower |
A ratio above 1.0 means FP8 is faster than BF16; below 1.0 means slower. Decode's measured ratio 0.79 corresponds to FP8 being 1.27× slower (1/0.79).
Prefill: the efficiency transfers
Measured prefill speedup is 1.45× (range 1.07–1.59×) against a nominal prediction of 1.59×, a 10.2% mean absolute percentage error (16.1% max). All 30 prefill cells have a 95% CI strictly above 1: FP8 reliably speeds up prefill. The nominal model is biased high — it over-predicts in 29/30 cells but is exceeded in one (H200 N=1 ctx-2048: measured 1.52× vs predicted 1.46×), confirming it is a straw-man transfer model, not an upper bound. The transfer is strongest where the step is most compute-bound (e.g. H200 N=4 ctx-2048 at 1.59×) and weakest at the smallest prefill (the H200 N=1, ctx-512 cell measures 1.07×), exactly where the compute branch barely binds. Both SKUs agree: 1.42× on H100, 1.48× on H200. We claim a consistent ~1.45× prefill speedup, not a clean climb to 2×.
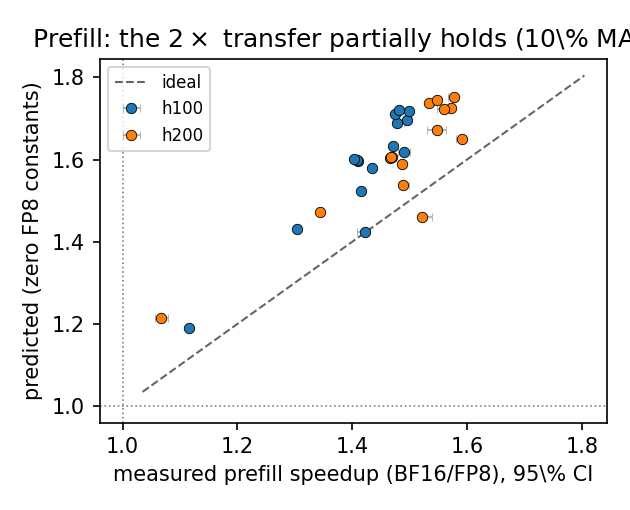
Prefill — nominal prediction (zero FP8 constants) vs measured BF16/FP8 speedup, with measurement 95% CIs. Points cluster around 1.4–1.5×; all 30 cells sit above 1.0. The 2× GEMM efficiency partially transfers to compute-bound prefill (measured ~1.45×), and the nominal model tracks it to 10.2% MAPE (biased high — it is a straw-man, not a bound).
Speedup ratio (FP8 vs BF16) scaled to a 2.0× axis. Prefill clears 1.0 as predicted; decode is predicted just above 1.0 but measured below it — FP8 makes decode slower.
Decode: falsified, and FP8 is slower
The closed form predicted 1.10× (a slight speedup). The measurement has the opposite sign: a ratio of 0.79, i.e. FP8 decode is 1.27× SLOWER than BF16 (39.0% mean error, 54.7% max). The falsification is sharp — all 30 decode cells have a 95% CI strictly below 1, so the slowdown is not measurement noise. In absolute terms FP8 adds 3.3 ms to a decode step on average — 27.0% of the BF16 step, rising to 47.1% at the largest batch×ctx, where the per-step activation-quantization work scales with the token count. Both SKUs slow down: 0.77 on H100, 0.81 on H200; the higher-bandwidth H200 slows slightly less, consistent with its weight-stream win being a larger share of its faster step.
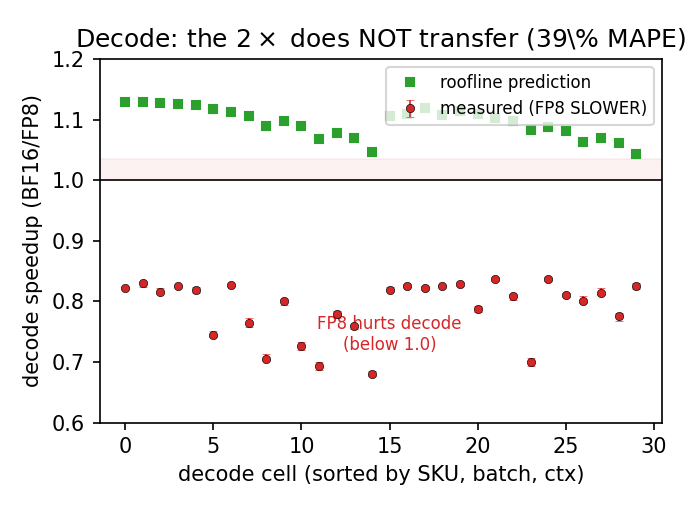
Decode — measured BF16/FP8 ratio (red, with 95% CIs) vs the nominal zero-FP8-constant prediction (green). The model predicts a small speedup above 1.0; every one of the 30 measured cells is a slowdown below 1.0. The 2× GEMM efficiency does not transfer — FP8 hurts decode. CIs are within-harness repeatability only.
The transfer map: where the speedup appears
Plotting the measured speedup against tokens-processed-per-step makes the boundary explicit. Decode cells (one token per request, so few tokens/step) are all below 1.0 regardless of batch; prefill cells (M = batch × ctx, many tokens/step) sit well above 1.0, clustered near ~1.45×. The sign flips at the compute-bound vs memory/host-bound boundary the roofline identifies — the 2× GEMM efficiency transfers (partially) in the compute-bound regime and inverts to a slowdown in the memory/host-bound regime.
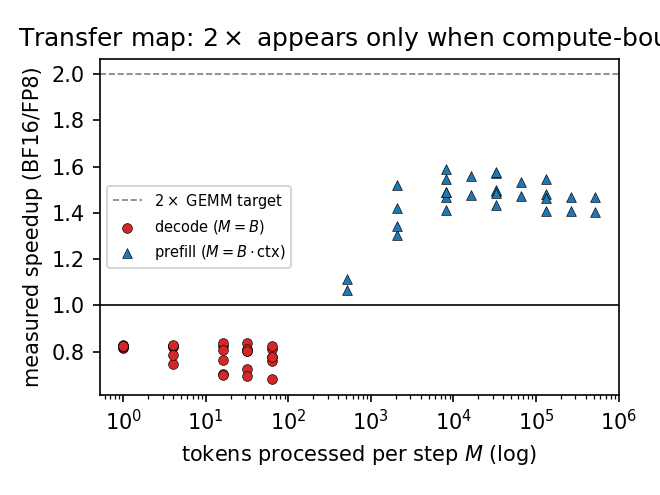
Transfer map — measured BF16/FP8 speedup vs tokens processed per step (log scale). Decode (one token/request) sits below 1.0 regardless of batch; prefill (many tokens/step) sits well above 1.0, near ~1.45×, short of the 2× GEMM target. The boundary is the compute-bound vs memory/host-bound regime, not the 2× itself.
A worked, reproducible example
A representative small-batch decode cell is N=1, ctx-512 on H100 — minimal compute, a large host-exposed share. BF16 step 9.41 ms, FP8 step 11.45 ms: FP8 is 2.04 ms (21.6%) slower. Here the projection GEMM is the smallest, so the FP8 weight-stream win is near zero and the activation-quant kernels (one per matmul, present only in FP8) are pure added cost. We make no claim about the absolute composition of this step — the model's microbench floor (s₀ ≈ 16.6 ms H100 / 14.0 ms H200) over-predicts the BF16 step by 2.7×, sitting above the directly-measured 5.78 ms host floor — so the load-bearing facts are the measured ratio and the measured quant kernels FP8 adds.
Isolated-precision control: the decode sign is not a two-checkpoint artifact
The headline arms are two different checkpoints (meta-llama BF16 vs neuralmagic W8A8), so a confound remains: the slowdown could be a loader/layout/kernel-selection artifact rather than a precision effect. We control for this by running the SAME BF16 checkpoint with and without vLLM's online FP8 quantization over the full grid on both SKUs. The decode slowdown reproduces — FP8 decode is slower in 13/15 cells on H100 and 14/15 on H200 — so the decode SIGN is a precision-path effect. It also holds across model families: repeating the control on Qwen2.5-7B gives FP8 decode slower in 14/15 cells. The online-FP8 magnitude is milder than the deployed W8A8 path (~16% Llama / ~21% Qwen vs ~27% headline) — the sign is the robust, isolated result; the magnitude depends on the FP8 implementation.
| SKU (model) | decode FP8-slower | decode mean (×) | prefill FP8-faster | prefill mean (×) |
|---|---|---|---|---|
| H100 (Llama-3.1-8B) | 13/15 | 0.87 | 14/15 | 1.29 |
| H200 (Llama-3.1-8B) | 14/15 | 0.87 | 14/15 | 1.33 |
| H100 (Qwen2.5-7B) | 14/15 | 0.83 | 15/15 | 1.34 |
Isolated-precision control: same BF16 checkpoint, vLLM online FP8 vs none, full 3×5 grid, bootstrap CIs. The decode slowdown reproduces without the two-checkpoint confound on both SKUs and on a second model family; it flips only in the largest compute-bound decode cells.
A Decision Rule for FP8
The transfer map yields a concrete provisioning rule on these SKUs. The same FP8 checkpoint has opposite latency value in the two phases, which argues for phase-aware precision.
Use FP8 here
Prefill-heavy / throughput-oriented serving — large prompts, large chunked-prefill batches, or prefill-disaggregated nodes — should adopt W8A8 FP8: the 2× GEMM efficiency partially transfers to a real ~1.45× step speedup, in the right direction predicted from the BF16 breakdown with zero FP8-fitted parameters.
Avoid FP8 here
Decode-latency-bound serving — small interactive batches, tight per-token (TPOT) SLOs — should NOT use this W8A8 path for latency: it is 1.27× slower because the activation-quant overhead exceeds the halved weight-stream. The fix is FP8 decode kernels that fuse or amortize activation quantization, or BF16 decode workers in a disaggregated split.
We model latency only; FP8's memory-capacity and accuracy trade-offs are orthogonal and unchanged by these results. This page is part of a portfolio whose recurring thesis is that a per-step non-overlapped host/elementwise term — the cost GEMM-centric latency models leave out — is repeatedly the load-bearing quantity in real serving. See the full host-term portfolio →
Exactly What Was Measured
The claims are deliberately bounded. Each item names a specific way the result could be over-read and the precise scope that remains valid.
- Single FP8 kernel path. The decode result is specific to the neuralmagic W8A8 dynamic-activation FP8 path in this vLLM build. A kernel that fuses or amortizes activation quantization, or a weight-only / static-scale variant, could shift or remove the decode slowdown. We do NOT claim FP8 decode is slow in general — only that this deployed W8A8 path is.
- Mechanism counted on H100, one shape; per-cell ablation is future work. An nsys trace directly counts the activation-quant kernels (~181/step, absent in BF16, ~1.0 ms/step GPU) and ~245 extra host launches/step the FP8 path adds — added work, on the critical path by construction in eager mode, of the right order as the traced cells' slowdown. The trace is H100-only and on one decode shape; a per-cell ablation showing quant GPU time tracks each cell's slowdown across the grid is in flight, not done. The per-cell quantity we stand on is the measured ratio.
- Two checkpoints — but the decode sign is isolated. The headline arms differ in loader, kernel selection, and layout, not only precision. An isolated-precision control (same BF16 checkpoint with vLLM online FP8, full grid, both SKUs, and Qwen2.5-7B) reproduces the decode slowdown (13/15, 14/15, 14/15 cells), so the decode-slowdown SIGN is a precision-path effect, not a two-checkpoint artifact; the exact magnitude still depends on the deployed path.
- CIs are within-harness repeatability only. The bootstrap CIs resample timed reps within a single back-to-back run, so 'all CIs exclude 1' establishes repeatability inside this harness — not confidence over run-order, job-to-job, GPU-to-GPU, or thermal variation. Job-level replication is future work.
- Eager mode. Host/elementwise work is on the critical path in eager execution; CUDA-graph capture may overlap part of it and change the decode magnitude, though the weight-stream-vs-overhead balance that sets the SIGN is kernel-level.
- Coverage. Headline Llama-3.1-8B, with the phase-dependent sign also confirmed on Qwen2.5-7B; vLLM eager, H100/H200, TP-1, batch ≤ 64, ctx ≤ 8192, BF16 KV cache, isolated step latency (not throughput). Larger models, FP8 KV cache, tensor parallelism, graph mode, throughput/serving regimes, and other engines are out of scope; the prefill 'transfers' and decode 'does not' statements are scoped to this regime.
- Latency only. FP8's memory-capacity and accuracy trade-offs are orthogonal to these latency results and are not measured here.
The conclusions hold for Llama-3.1-8B in BF16 vs neuralmagic W8A8 FP8 on the single-GPU PACE SKUs H100 and H200, eager vLLM, over the 60-cell grid (with the decode sign also confirmed on Qwen2.5-7B). The central finding — that FP8's 2× GEMM efficiency partially transfers to prefill but inverts to a measured slowdown for decode, because a per-step activation-quantization cost the roofline omits exceeds the halved weight-stream — is the part expected to generalize beyond this grid in sign, if not in exact magnitude.